Lab 12: Nuclear Gamma Ray Spectra
Archie Wheeler
Arnold Chand
04.16.2012
A pdf version of this lab may downloaded here.
The doc version of this lab may be downloaded here.
Abstract
In this lab, we used a photodetector to observe the spectra of 60Co, 22Na, and 137Cs. The purpose of this lab was to observe the effects of the backscattering, the Compton edge, and the shielding effects of lead. Most of the numerical data gathered matched the models that we currently use to describe these effects. One of the greatest challenges we faced in this lab was dealing with our 60Co graph, which showed very small peaks. However, the peaks were not dramatic enough for us to nail down a specific value for a maximum and give us confidence that the numbers that we were using in analysis were correct. However, overall, this lab was a success.Contents
Objectives
- To use a NaI crystal detector and nuclear spectrometer to obtain and analyze a gamma ray spectrum of nuclear decay.
- To measure the absorption of gamma radiation by matter.
Setup
Materials:- NaI crystal detector
- Multichannel analyzer (nuclear spectrometer)
- Sources: 60Co, 22Na, 137Cs
- Lead and Aluminum absorber sets.
- Computer with Spectrum Analysis and Graphical Analysis software.
Methods
First, we made sure that the gamma ray sources were fresh. On the computer with the Nuclear Spectrometer, we launched the UCS30 program. We set the high voltage to 900V, the course gain to 8, the LLD to 1.7, the fine gain to 1.5, and the ULD to 32.9. We set both the Preset and real time for 120 seconds and verified that the Pixel Size was set to 2 points.
To get the actual data, we first placed a 22Na source into the second-to-top slot in the detector holder. We then used the software to accumulate a spectrum. We saved the file using the Na22ourinitials.ssf into the My Documents folder for further analysis and repeated the data collection for 137Cs and 60Co. We repeated the 137 part 4 times, with one through four lead plates to absorb the gamma rays. We emailed these files to ourselves for analysis on the station computers via UCS30.
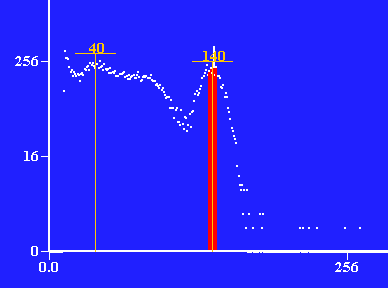
In order to calibrate oour scale, we used our 22Na spectrum. Super imposed our cobalt and cesium graphs on top of our sodium graph and used the peaks of the sodium graph to calibrate the energy scale by setting the peaks to accepted values. The narrow peak at the center we set to 511keV and the peak at the far right as 1274keV. We used the calibrated graphs to compare our experimental values to the accepted and predicted values for backscatter energy and Compton edge.
Data
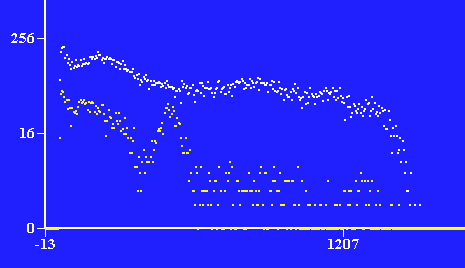
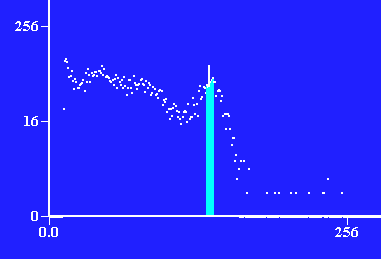
Photons detected at specific energies. Number of photons on y-axis plotted against energy in keV.
60Co in white, 22Na in yellow.
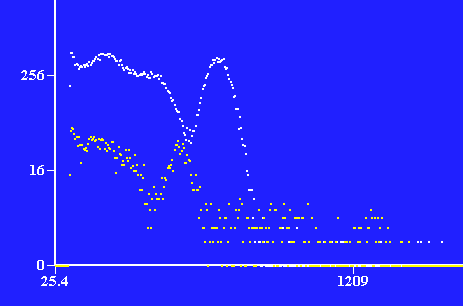
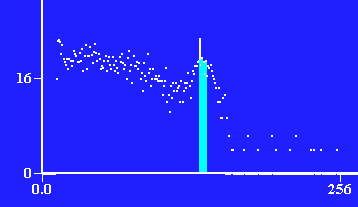
Photons detected at specific energies. Number of photons on y-axis plotted against energy in keV.
137Cs in white, 22Na in yellow.
Photons detected vs. energy of photon through 1 layer of lead, ≈ .65cm
Photons detected vs. energy of photon through 2 layers of lead, ≈ 1.3cm
Photons detected vs. energy of photon through 3 layers of lead, ≈ 1.95cm
Photons detected vs. energy of photon through 4 layers of lead, ≈ 2.6cm
Analysis
| Source | Epublished | Eobserved | %Error |
|---|---|---|---|
| 22Na | 0.511 | 0.511 | 0.00% |
| 22Na | 1.274 | 1.274 | 0.00% |
| 60Co | 1.173 | 1.145 | 2.39% |
| 60Co | 1.333 | 1.321 | 0.90% |
| 137Cs | 0.662 | 0.658 | 0.60% |
| Element | Epeak (keV) | Ebackscatter theoretical (keV) | Ebackscatter observed (keV) | %Error | ECompton edge predicted (keV) | ECompton edge observed (keV) | %Error |
|---|---|---|---|---|---|---|---|
| Na | 511 | 170 | 178 | 4.50% | 333 | 353 | 6.01% |
| Cobalt | 658 | 184 | 261 | 41.82% | 397 | 441 | 11.08% |
| Cesium | 1159 | 209 | 248 | 18.46% | 911 | 863 | 5.27% |
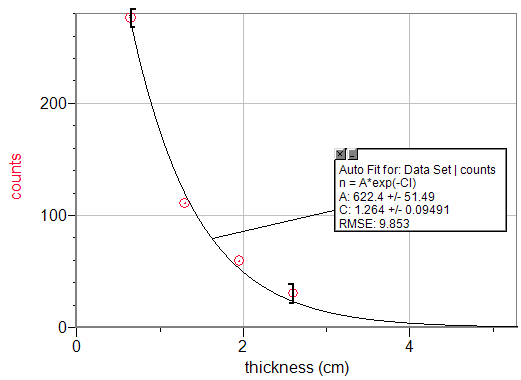
Maximum intensity of gamma rays vs. thickness of lead shield.
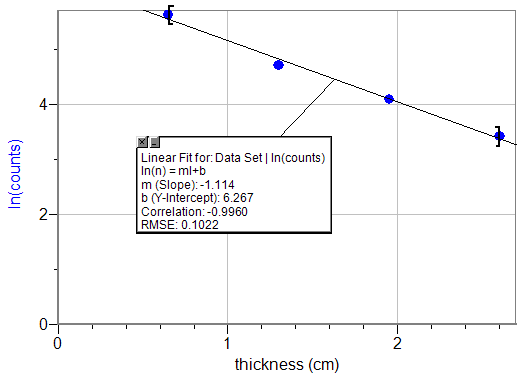
Natural log of maximum intensity of gamma rays vs. thickness of lead shield.
kaccepted=1.19cm-1
kexponential fit=1.264cm-1
%Error=6.22%
klinear fit=1.114cm-1
%Error=6.39%
I believe that the exact placement of of the radioactive sample while we were taking data could have changed the amount of radiation that the photodetector picked up. If the sample was directly under the detector, it may have picked up a different spectrum than if it was slightly off to the side, and so on and so forth.
We did not have the presence of mind to measure the absolute error while we were doing the shielding portion of the experiment. We returned to our lab stations and only then did we realize we needed to know the exact thickness of the lead plates. Using a calipers, I measured the thickness of one of the plates, which came out to be about .65. There really was no way of knowing which lead plates we used when, so the uncertainty really cannot be measured accurately. The absolute uncertainty of one slab was .65±.005cm, which is so small that it would not show up on a graph, so we did not bother to include it in our calculations.
Conclusion
Considering that it was difficult to extract exact values from our graphs, I believe that our lab was a success. The relationships of Compton scattering and backscatter were proven within reasonable bounds, and we learned to use some new and exciting software. The best part about it is that its free. I have already installed it on all of my personal computers and have been gathering oodles of gamma ray information just for kicks because I have tons of free time the two weeks before finals.
In order to improve the results of this lab, I would have set up a target under the photodetector so that all of our radioactive samples would be at the same position. I have a feeling that the spectra would be more ideally shaped and there would be less error across the different samples.
Signature
Archie Wheeler
04.18.12