Precalculus by Richard Wright
Has this helped you?
This book is available
in print and ebook.

Precalculus by Richard Wright
Has this helped you?
This book is available
in print and ebook.
Do not let your heart envy sinners, but always be zealous for the fear of the Lord. There is surely a future hope for you, and your hope will not be cut off. Proverbs 23:17-18 NIV
Summary: In this section, you will:
SDA NAD Content Standards (2018): PC.5.3, PC.6.6
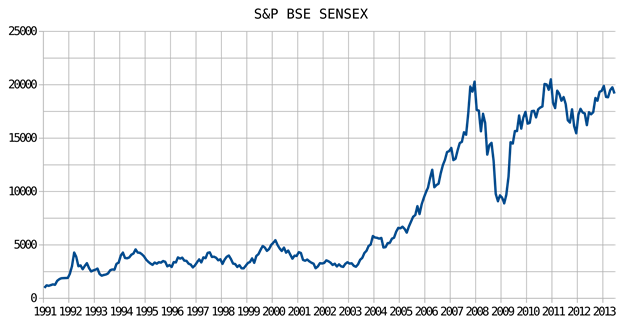
A picture is worth a thousand words. Equations are useful and descriptive, but a picture of the equation is far more descriptive. For example, the stock market is described by numbers of how stocks or indices are changing. However, a graph of the stocks or indices such as in in figure 1 more easily shows trends which are important for stock traders.
An equation in two variables can be represented by a graph. The most basic way to create a graph is to make a table. To create a table, start by solving the equation for y. Then choose values for the x-variable, and calculate the corresponding value for y. Finally, plot all the points and connect them with a line.
The x-values chosen for the table are arbitrary, but usually include both positive and negative numbers. However, if the the equation models a real-world situation, then consider what values for x are reasonable such as if x represents time, then it should probably only be positive numbers.
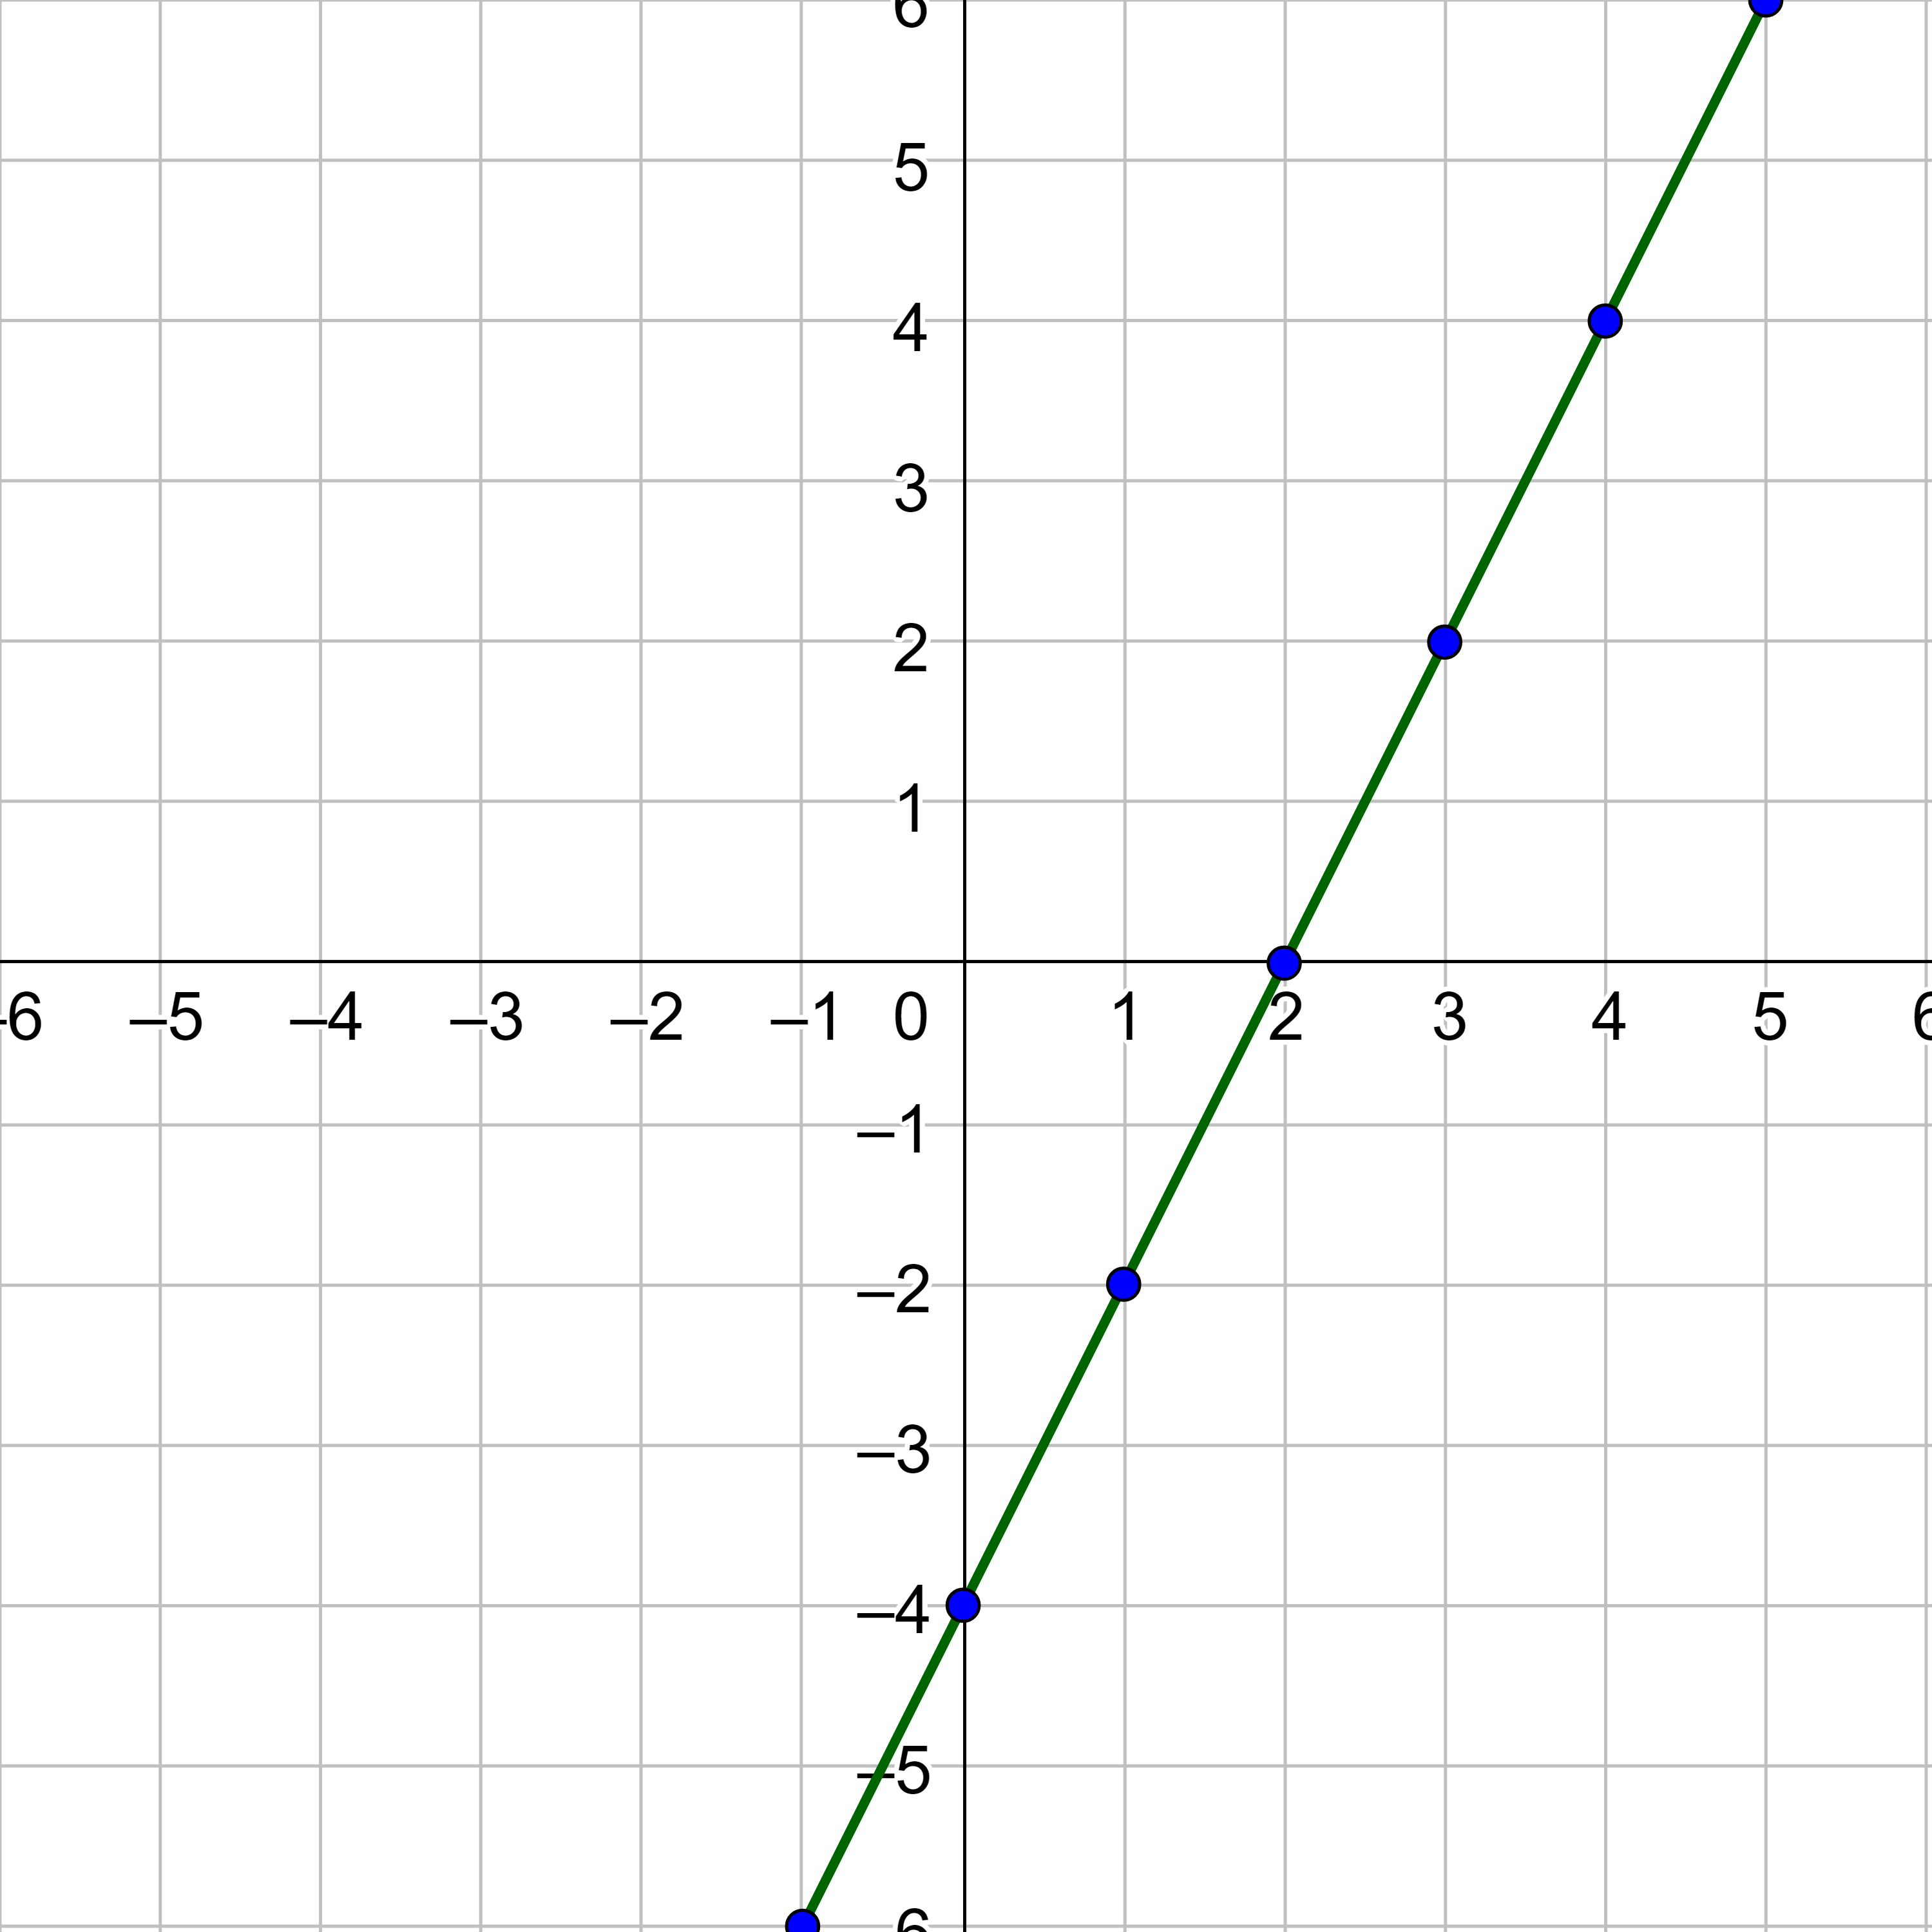
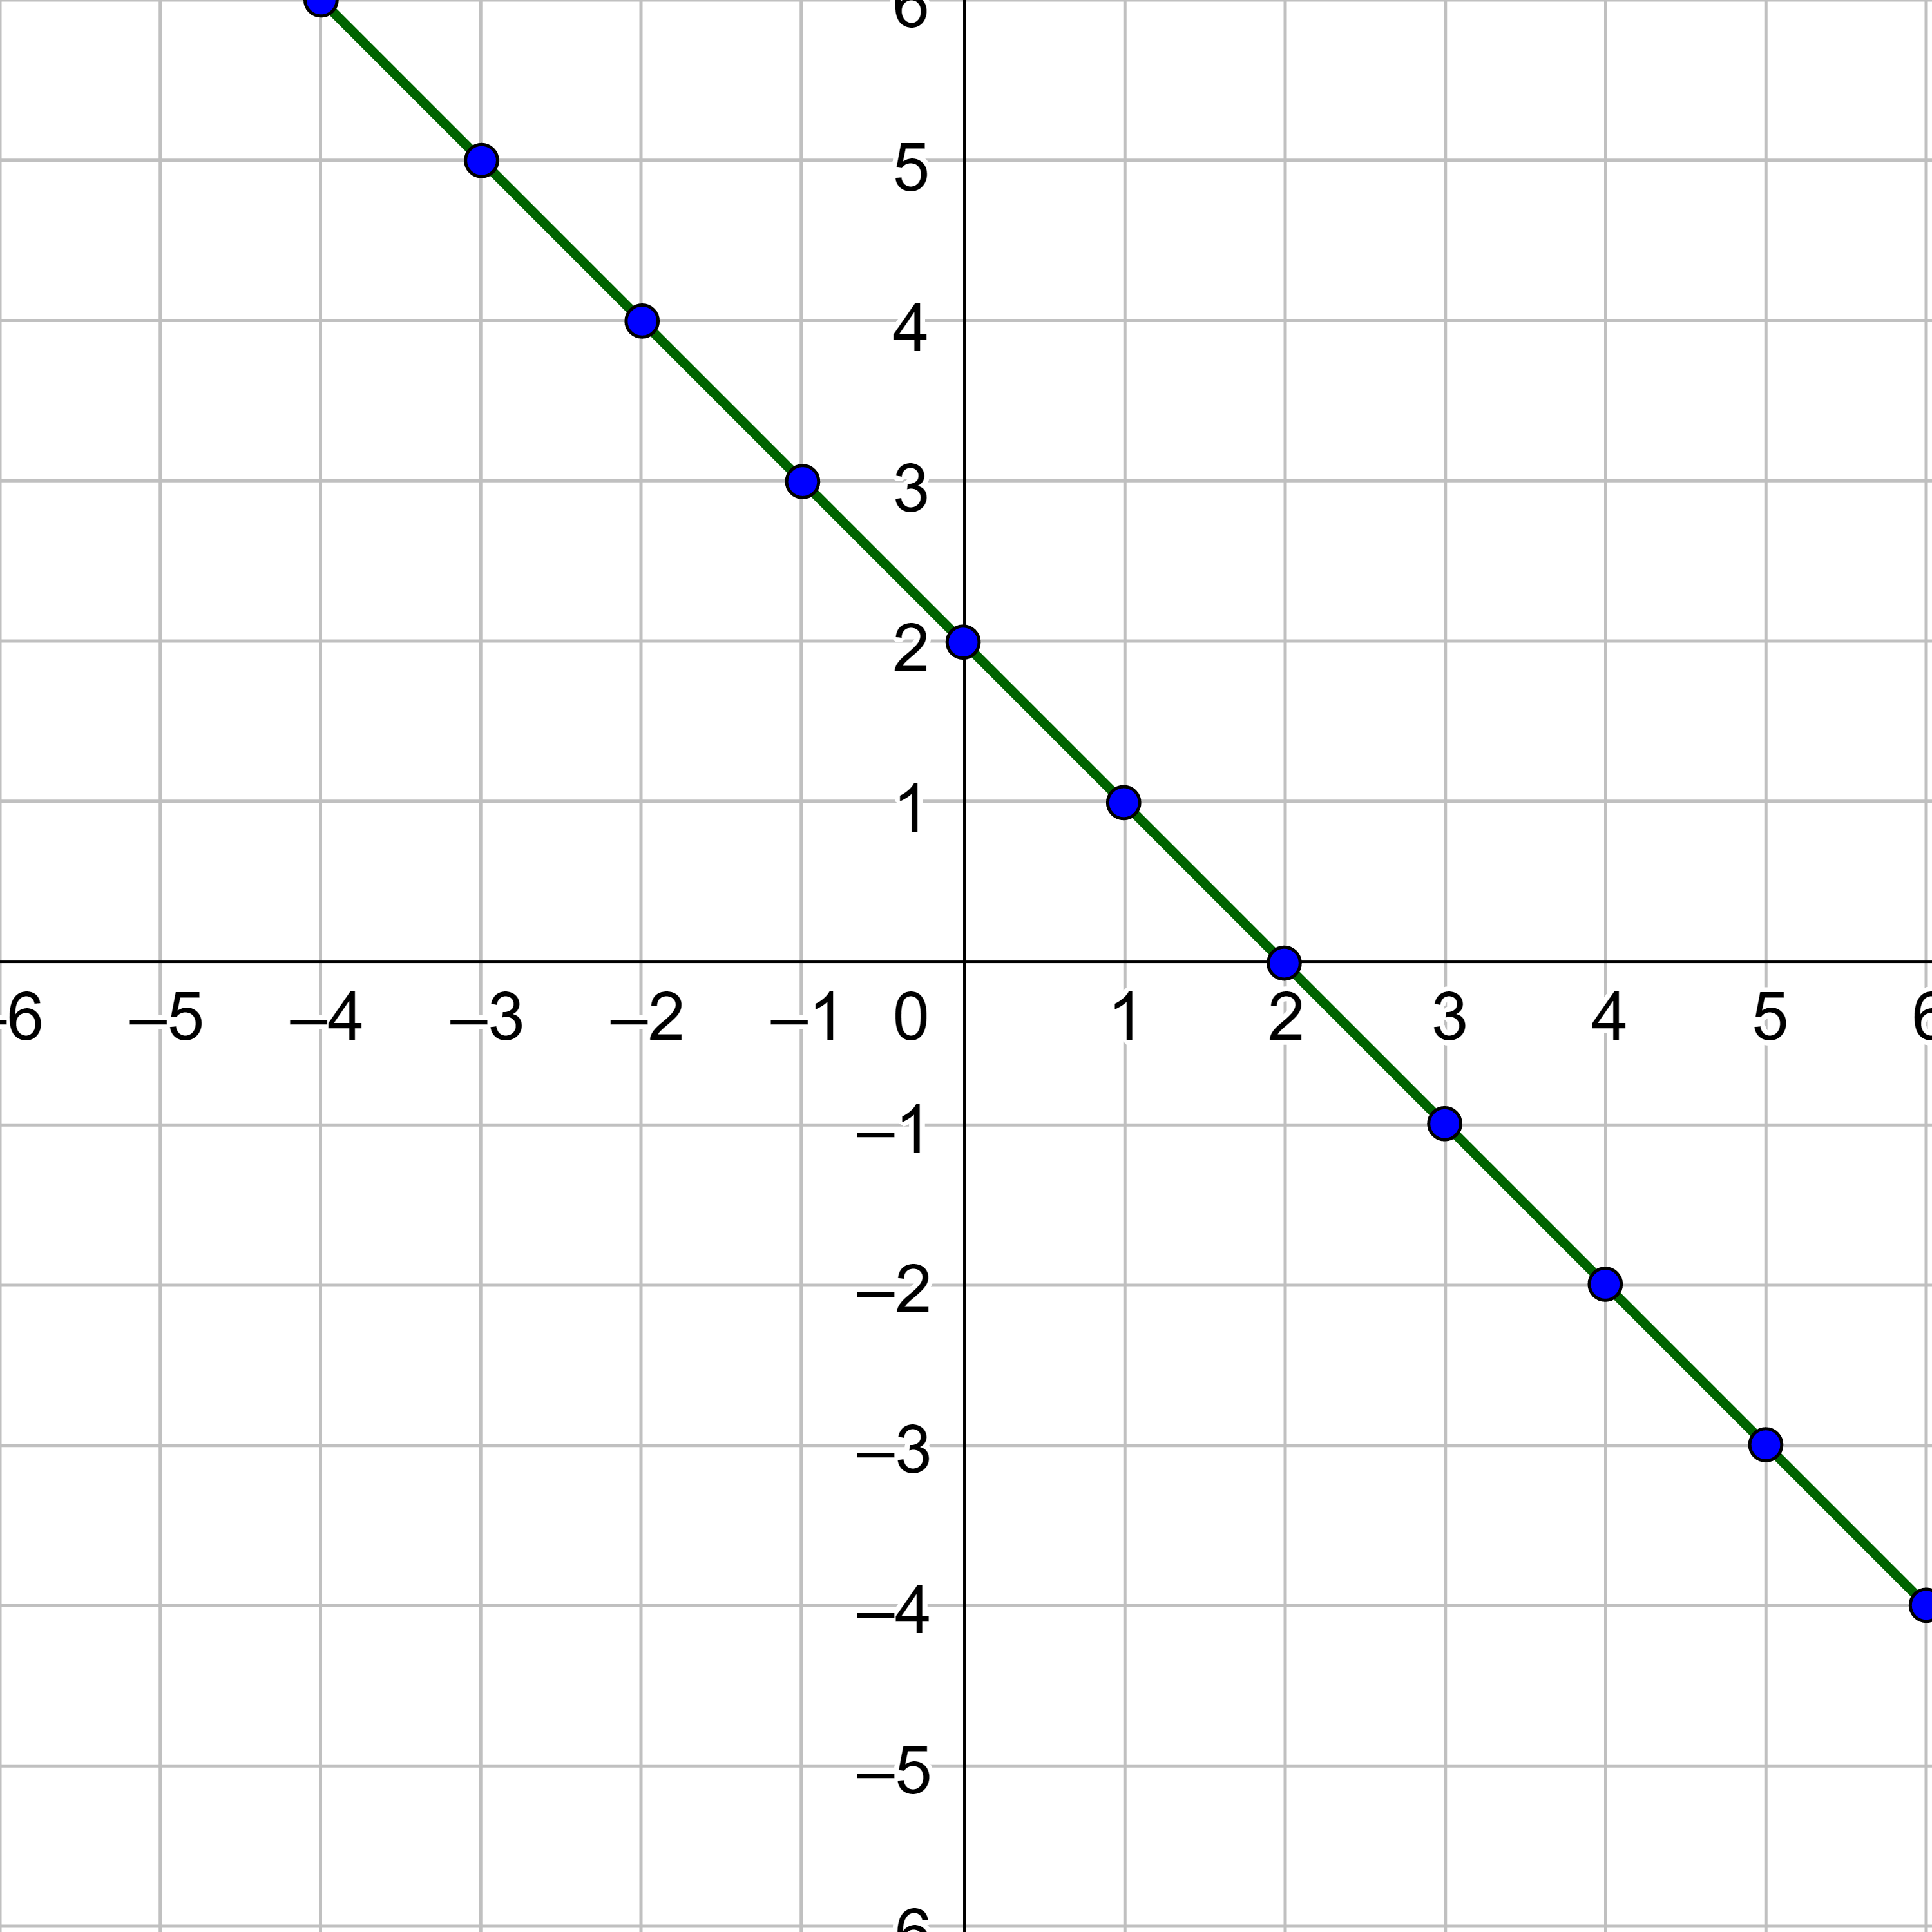
Graph y = 2x − 4.
Solution
Create a table with x and y rows. Pick both positive and negative values for x.
| x | −6 | −5 | −4 | −3 | −2 | −1 | 0 | 1 | 2 | 3 | 4 | 5 | 6 |
|---|---|---|---|---|---|---|---|---|---|---|---|---|---|
| y |
Substitute each x-value into the equation and calculate the corresponding y-value. For example, substitute x = −6.
y = 2x − 4
y = 2(−6) − 4 = −16
Fill that in the table and calculate the next number.
| x | −6 | −5 | −4 | −3 | −2 | −1 | 0 | 1 | 2 | 3 | 4 | 5 | 6 |
|---|---|---|---|---|---|---|---|---|---|---|---|---|---|
| y | −16 | −14 | −12 | −10 | −8 | −6 | −4 | −2 | 0 | 2 | 4 | 6 | 8 |
Some of the points are much farther away from the origin than others. Make the axes scale something reasonable. For this and many graphs in this book, making the scale go from −6 to 6 will produce a nice graph. Some problems will need a bigger scale, however. For this graph, plot the points that fit between −6 and 6 and draw a line through the points.
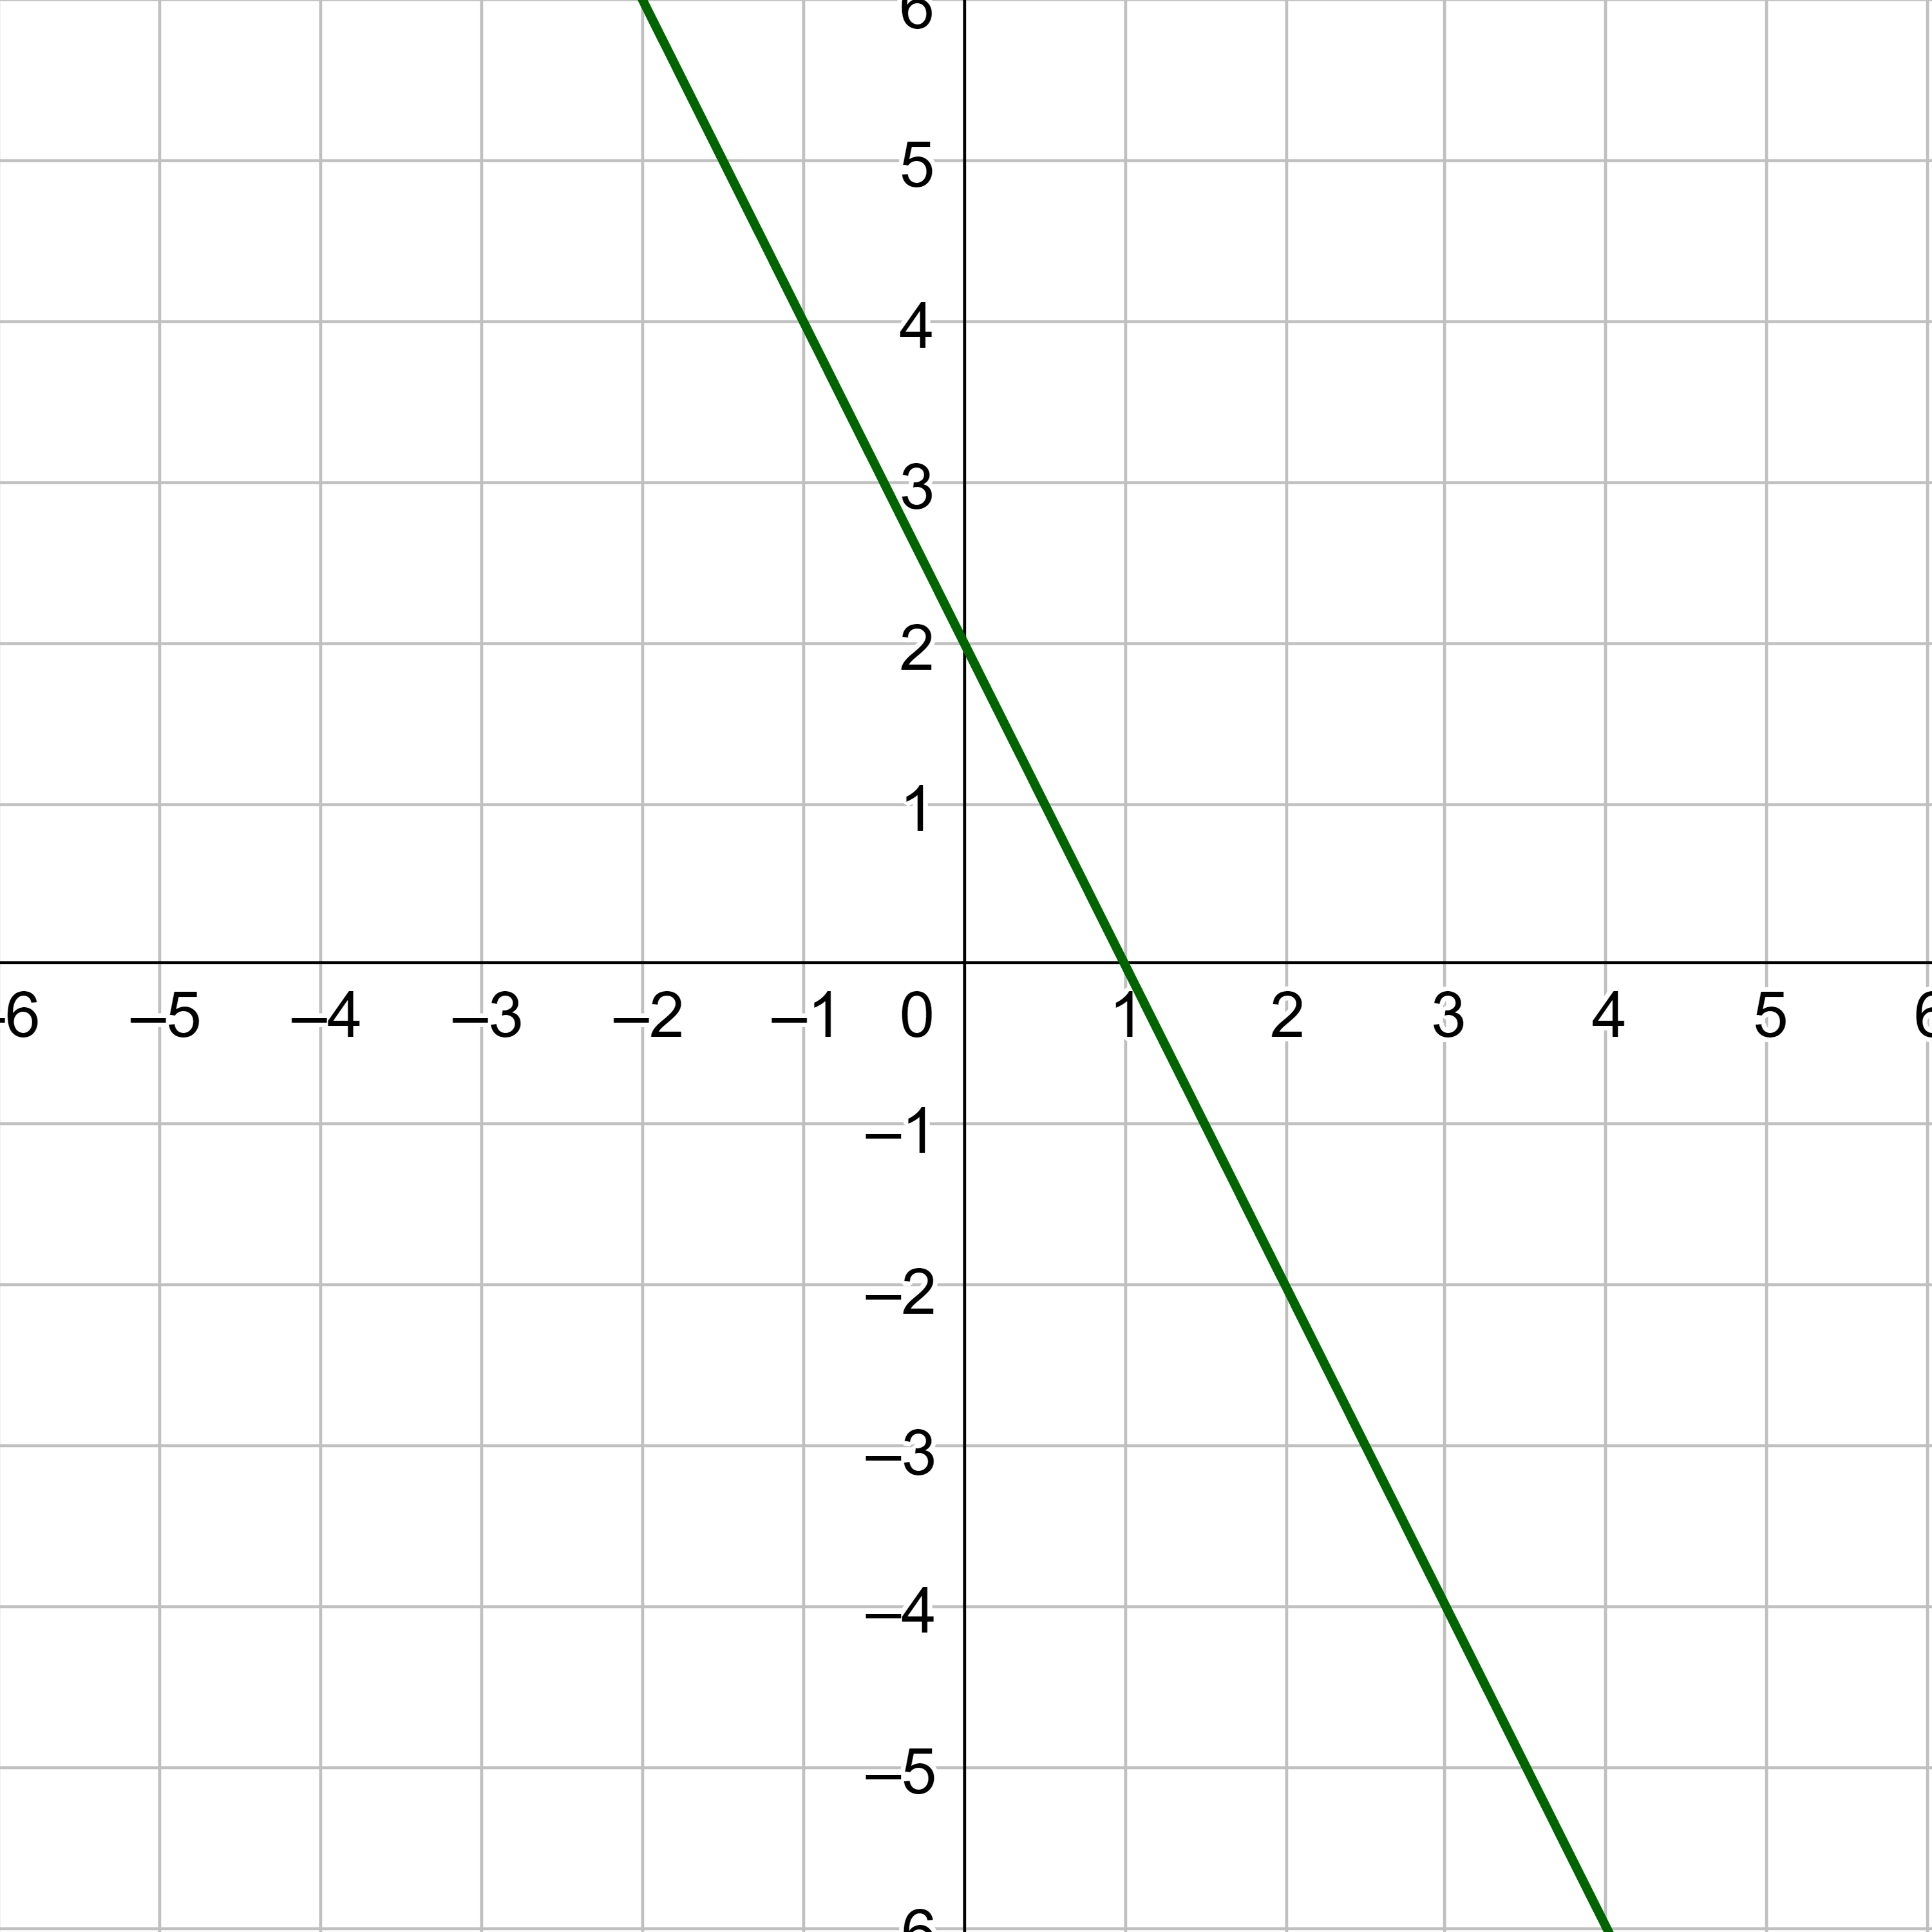
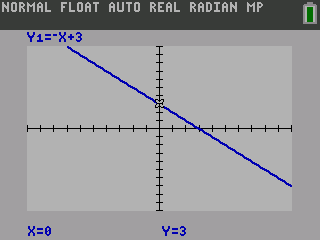
Graph y = −x + 2.
Answer
Graphing calculators will make a graph of an equation. For most graphing calculators, the equation will need to be solved for y. The most commonly used graphing calculator in schools is the TI-84 Plus, but other good graphing calculators are made by other companies such as Casio and NumWorks.
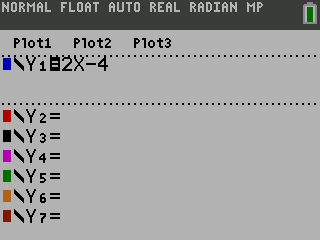
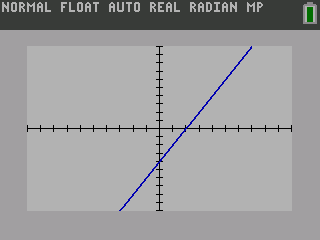
To graph on a TI-84, press the o button on the top left. Then enter your equation (figure 3a). To see the graph, next press the s button on the top right (figure 3b).
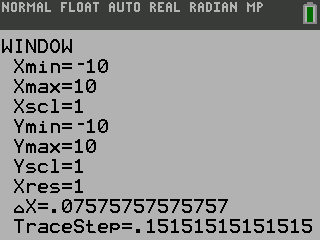
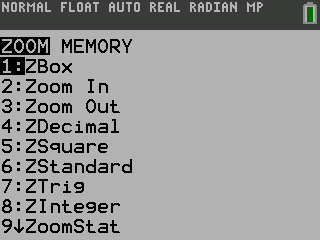
The viewing window may need adjusted to see the graph well. This can done by pressing the p button (figure 4a) or by choosing a zoom option in the q button menu (figure 4b). The standard window goes from −10 to 10 in both the x and the y. This can easily be set by choosing ZStandard in the Zoom menu.
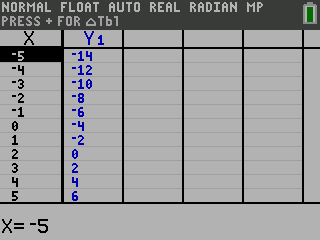
To use the graphing calculator to draw the graph on your paper, use the 0 button. Press y then 0 which is above the s button. Use that table to plot points on your paper and draw the line connecting them. Then check to make sure your graph matches the one on the calculator.
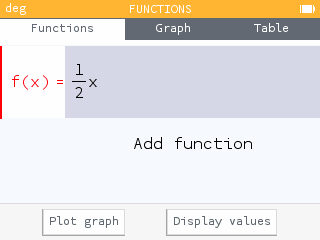
To graph on a NumWorks calculator, press the H button and select Functions. In the Functions tab, add a new function or edit the existing function. Then move to the Graph tab.
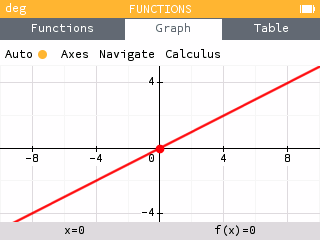
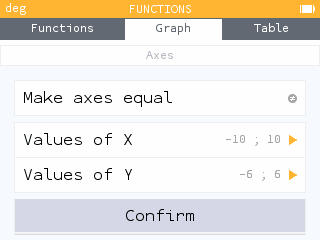
The viewing window may need adjusted to see the graph well. By default, the graph zooms to an auto window that is often huge. Use the arrow pad to select Axes. To get a window with the same scale in the x and y, set the Values of X to −10; 10 and the Values of Y to −6; 6, then select Confirm. The Zoom level of the screen can be changed by pressing the + and - buttons.
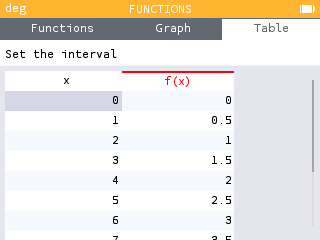
To use the graphing calculator to draw the graph on your paper, use the Table tab. By default the table starts at 0, but can be changed by selecting Set the interval or the desired x-values can simply be entered into the table.
The other brands of graphing calculators work in a similar method, but have different buttons. You may need to look at your calculator's manual to learn how to make a graph and table.
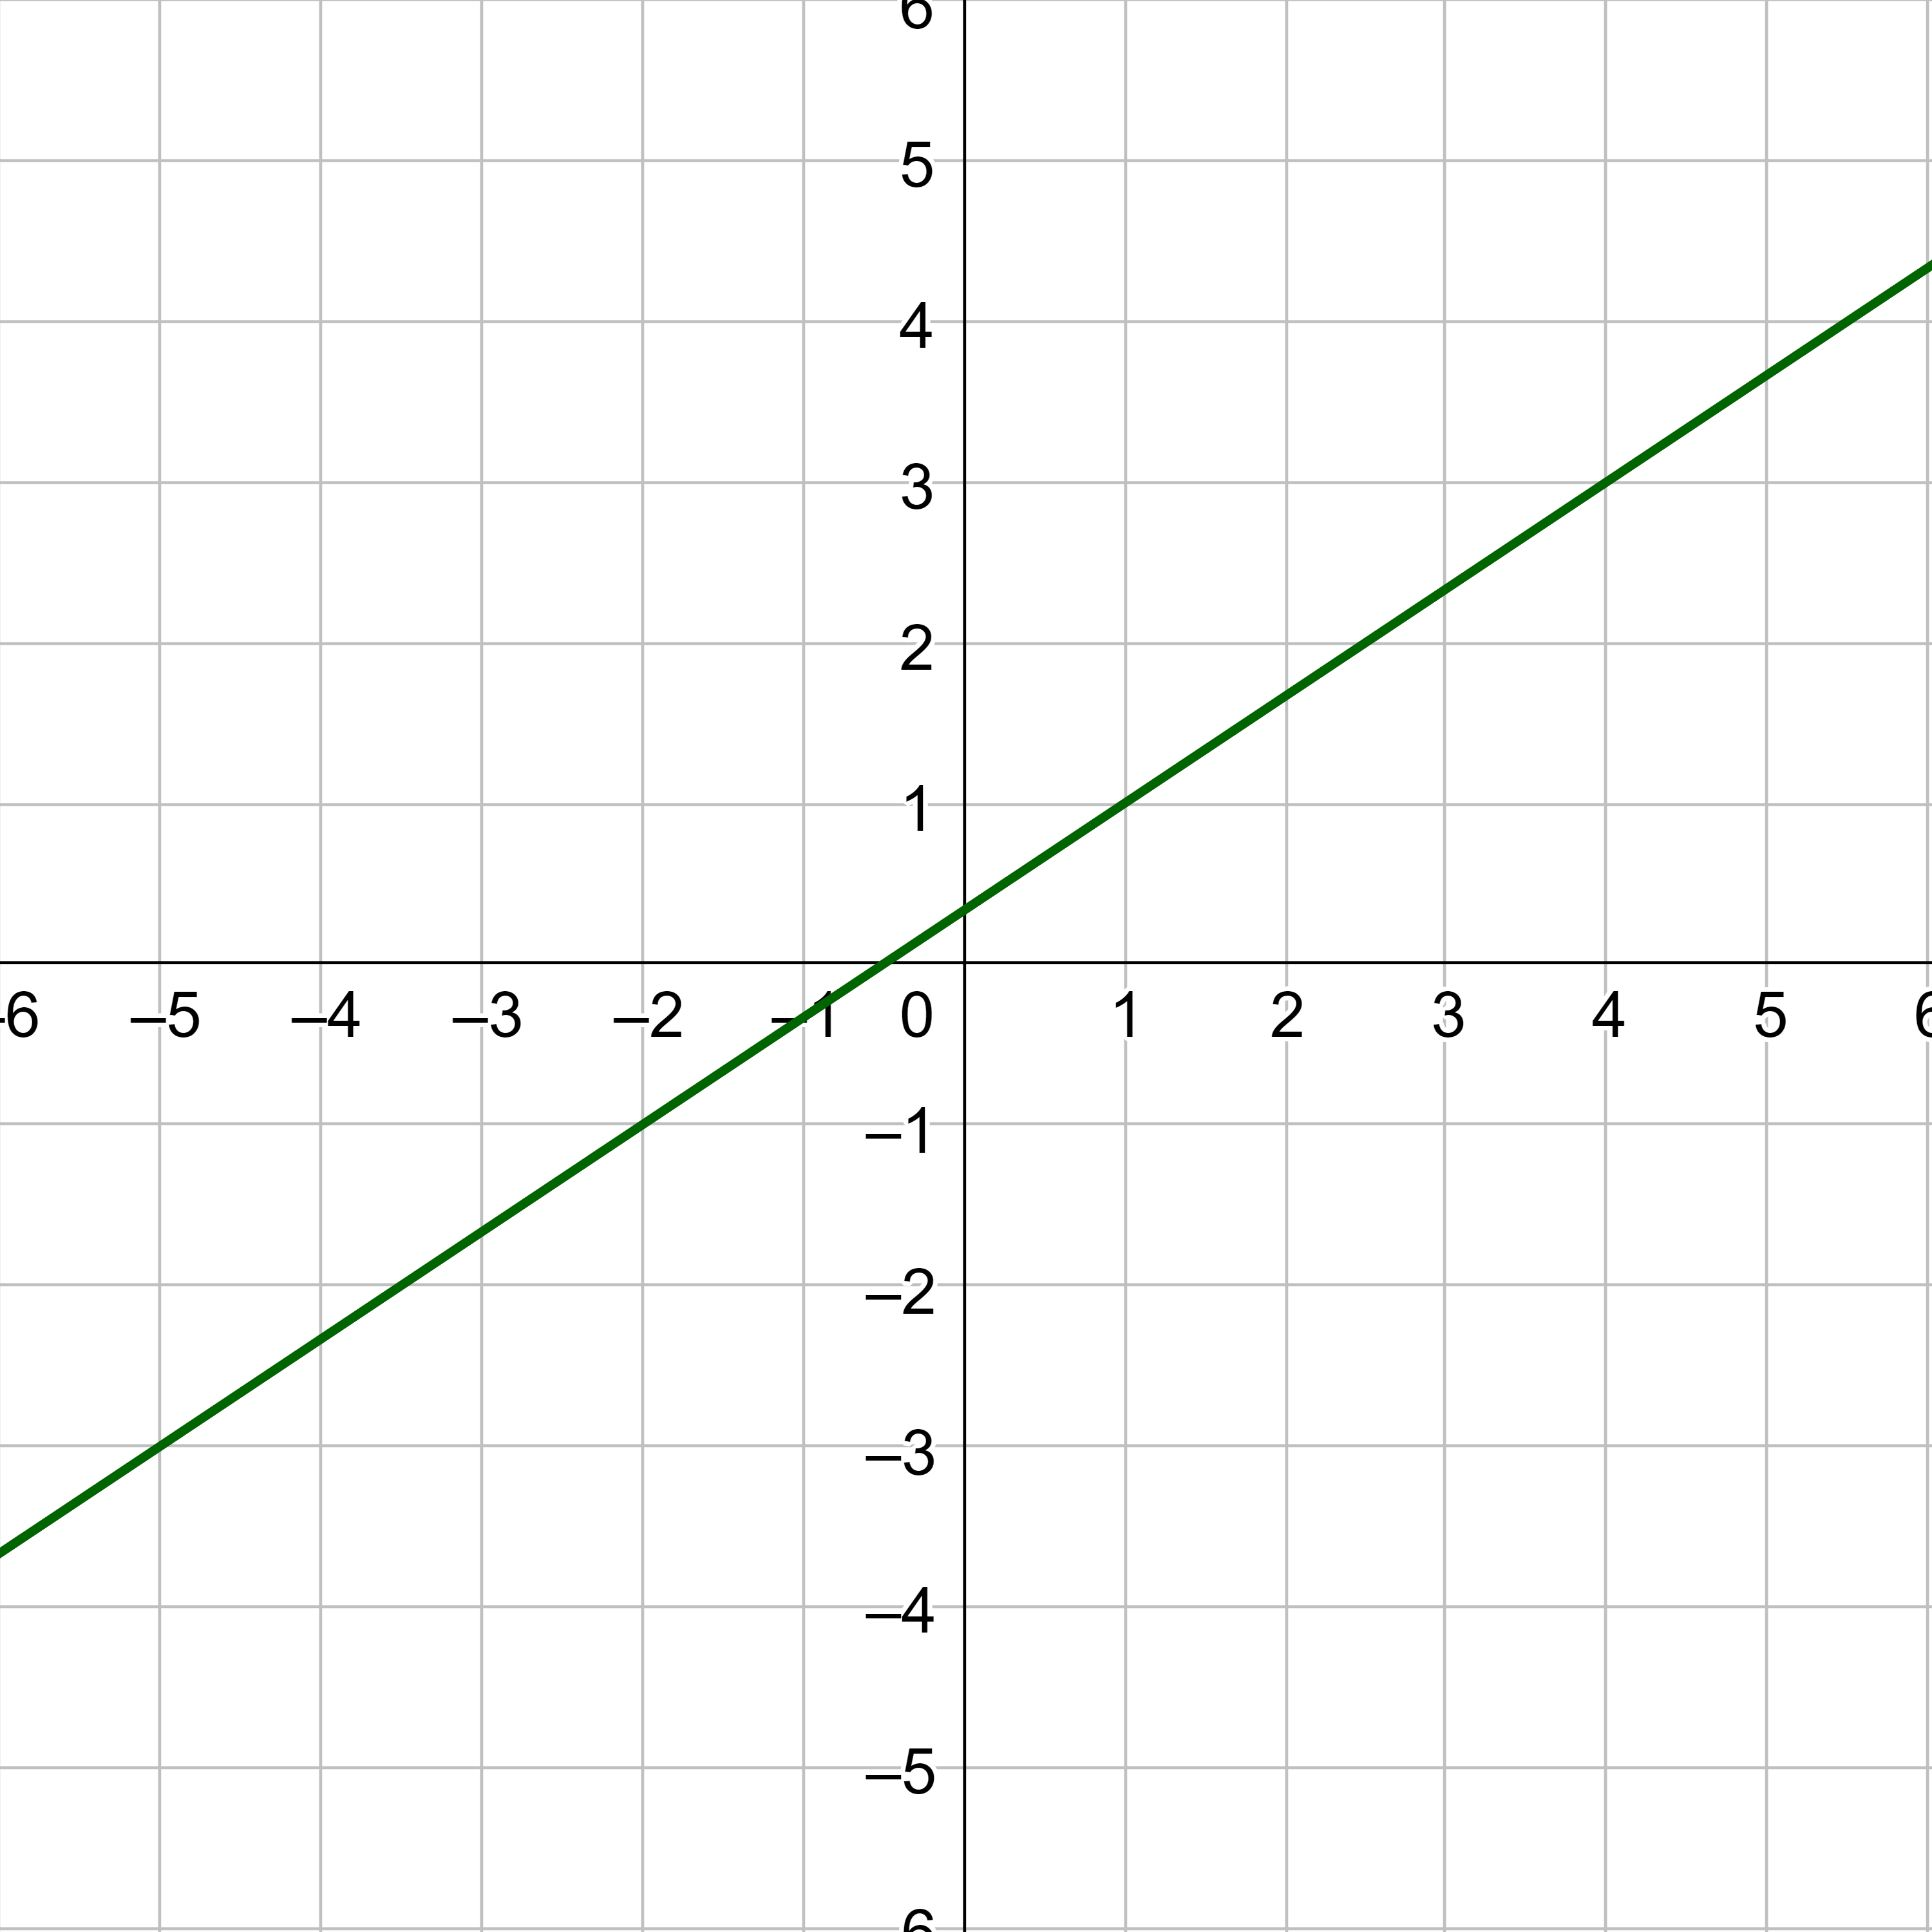
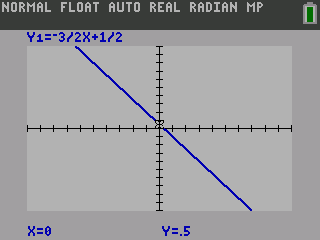
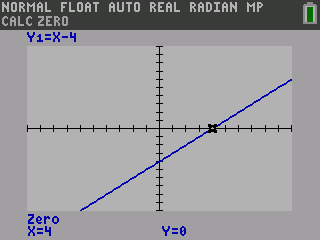
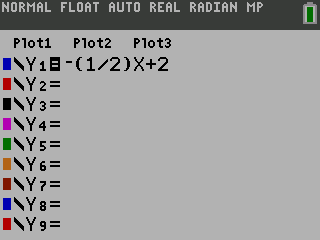
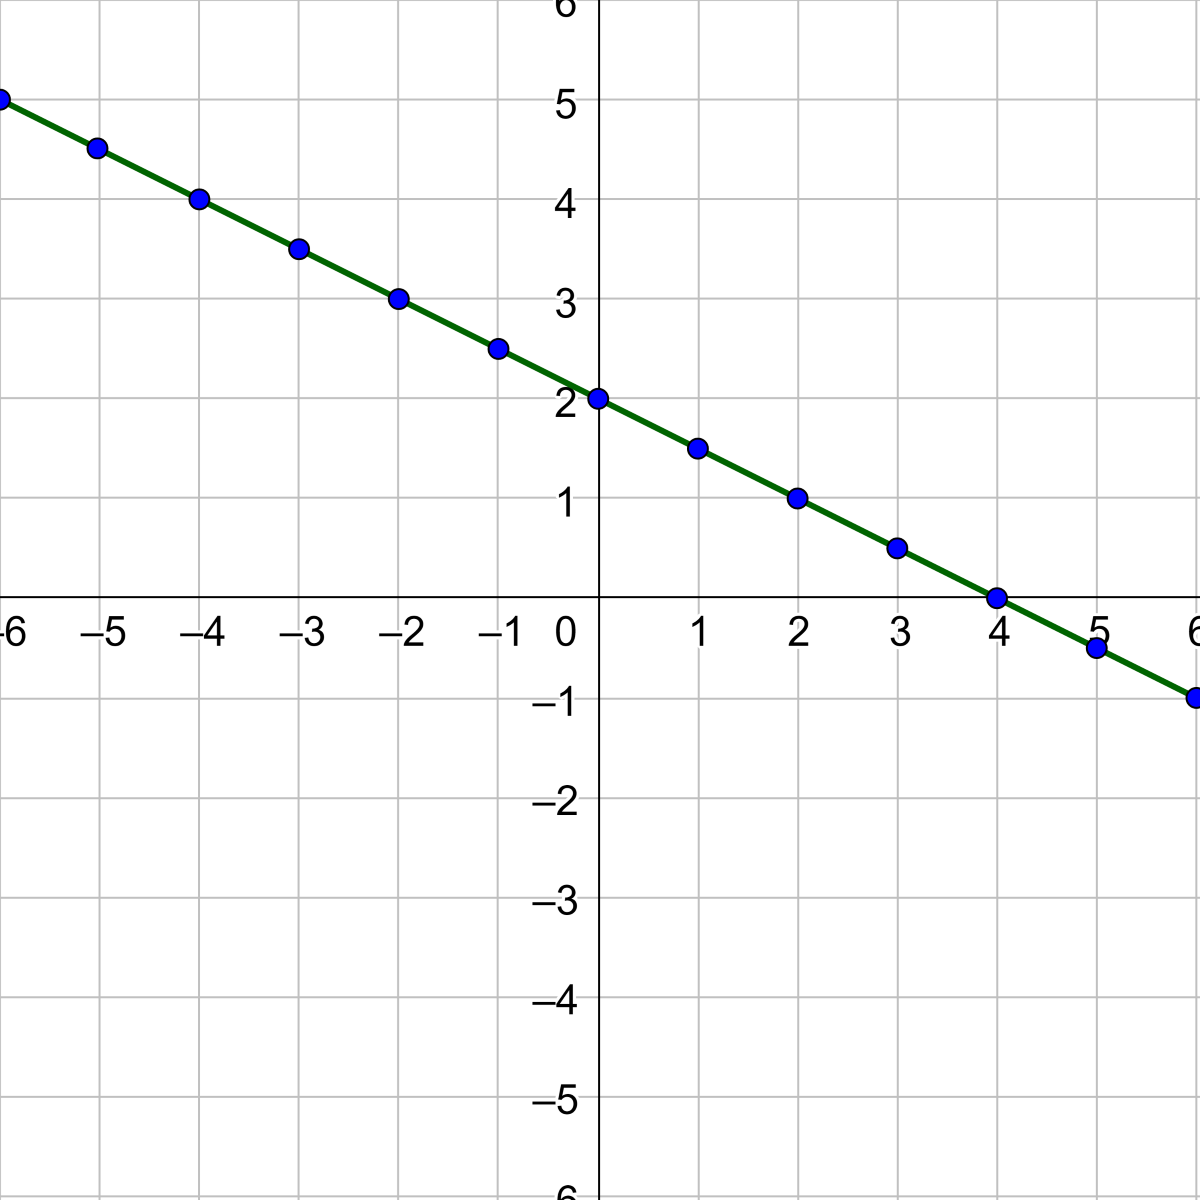
Use a graphing calculator to graph \(y = -\frac{1}{2}x + 2\).
On a TI-84, start by pressing the o button and enter the equation.
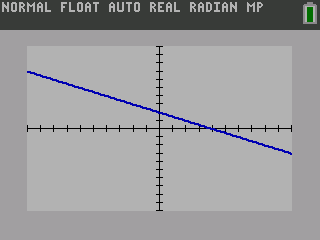
Press s to see the graph.
To draw your graph, press y 0 to get the table of points.
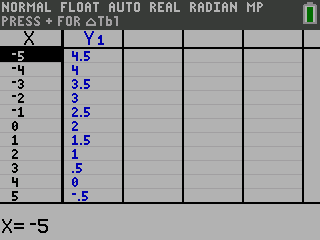
Plot several of the points on your paper and draw a line through them.
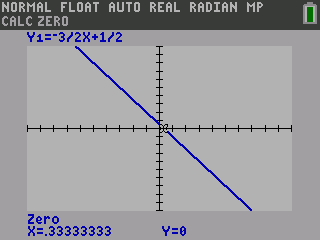
On a NumWorks, start by selecting Functions from the home screen. In the Functions tab, enter the equation.
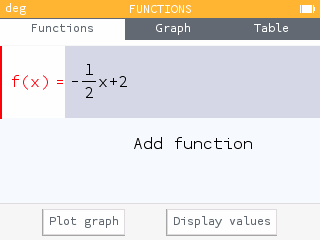
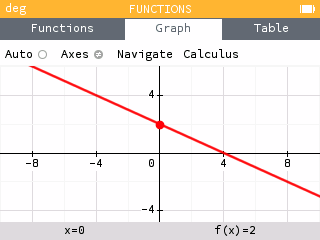
Select the Graph tab to see the graph.
To draw your graph, select the Table tab. Either Set the interval or enter the desired x-values to get the table of points.
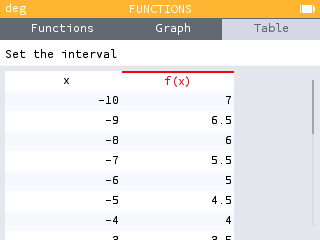
Plot several of the points on the paper and draw a line through them.

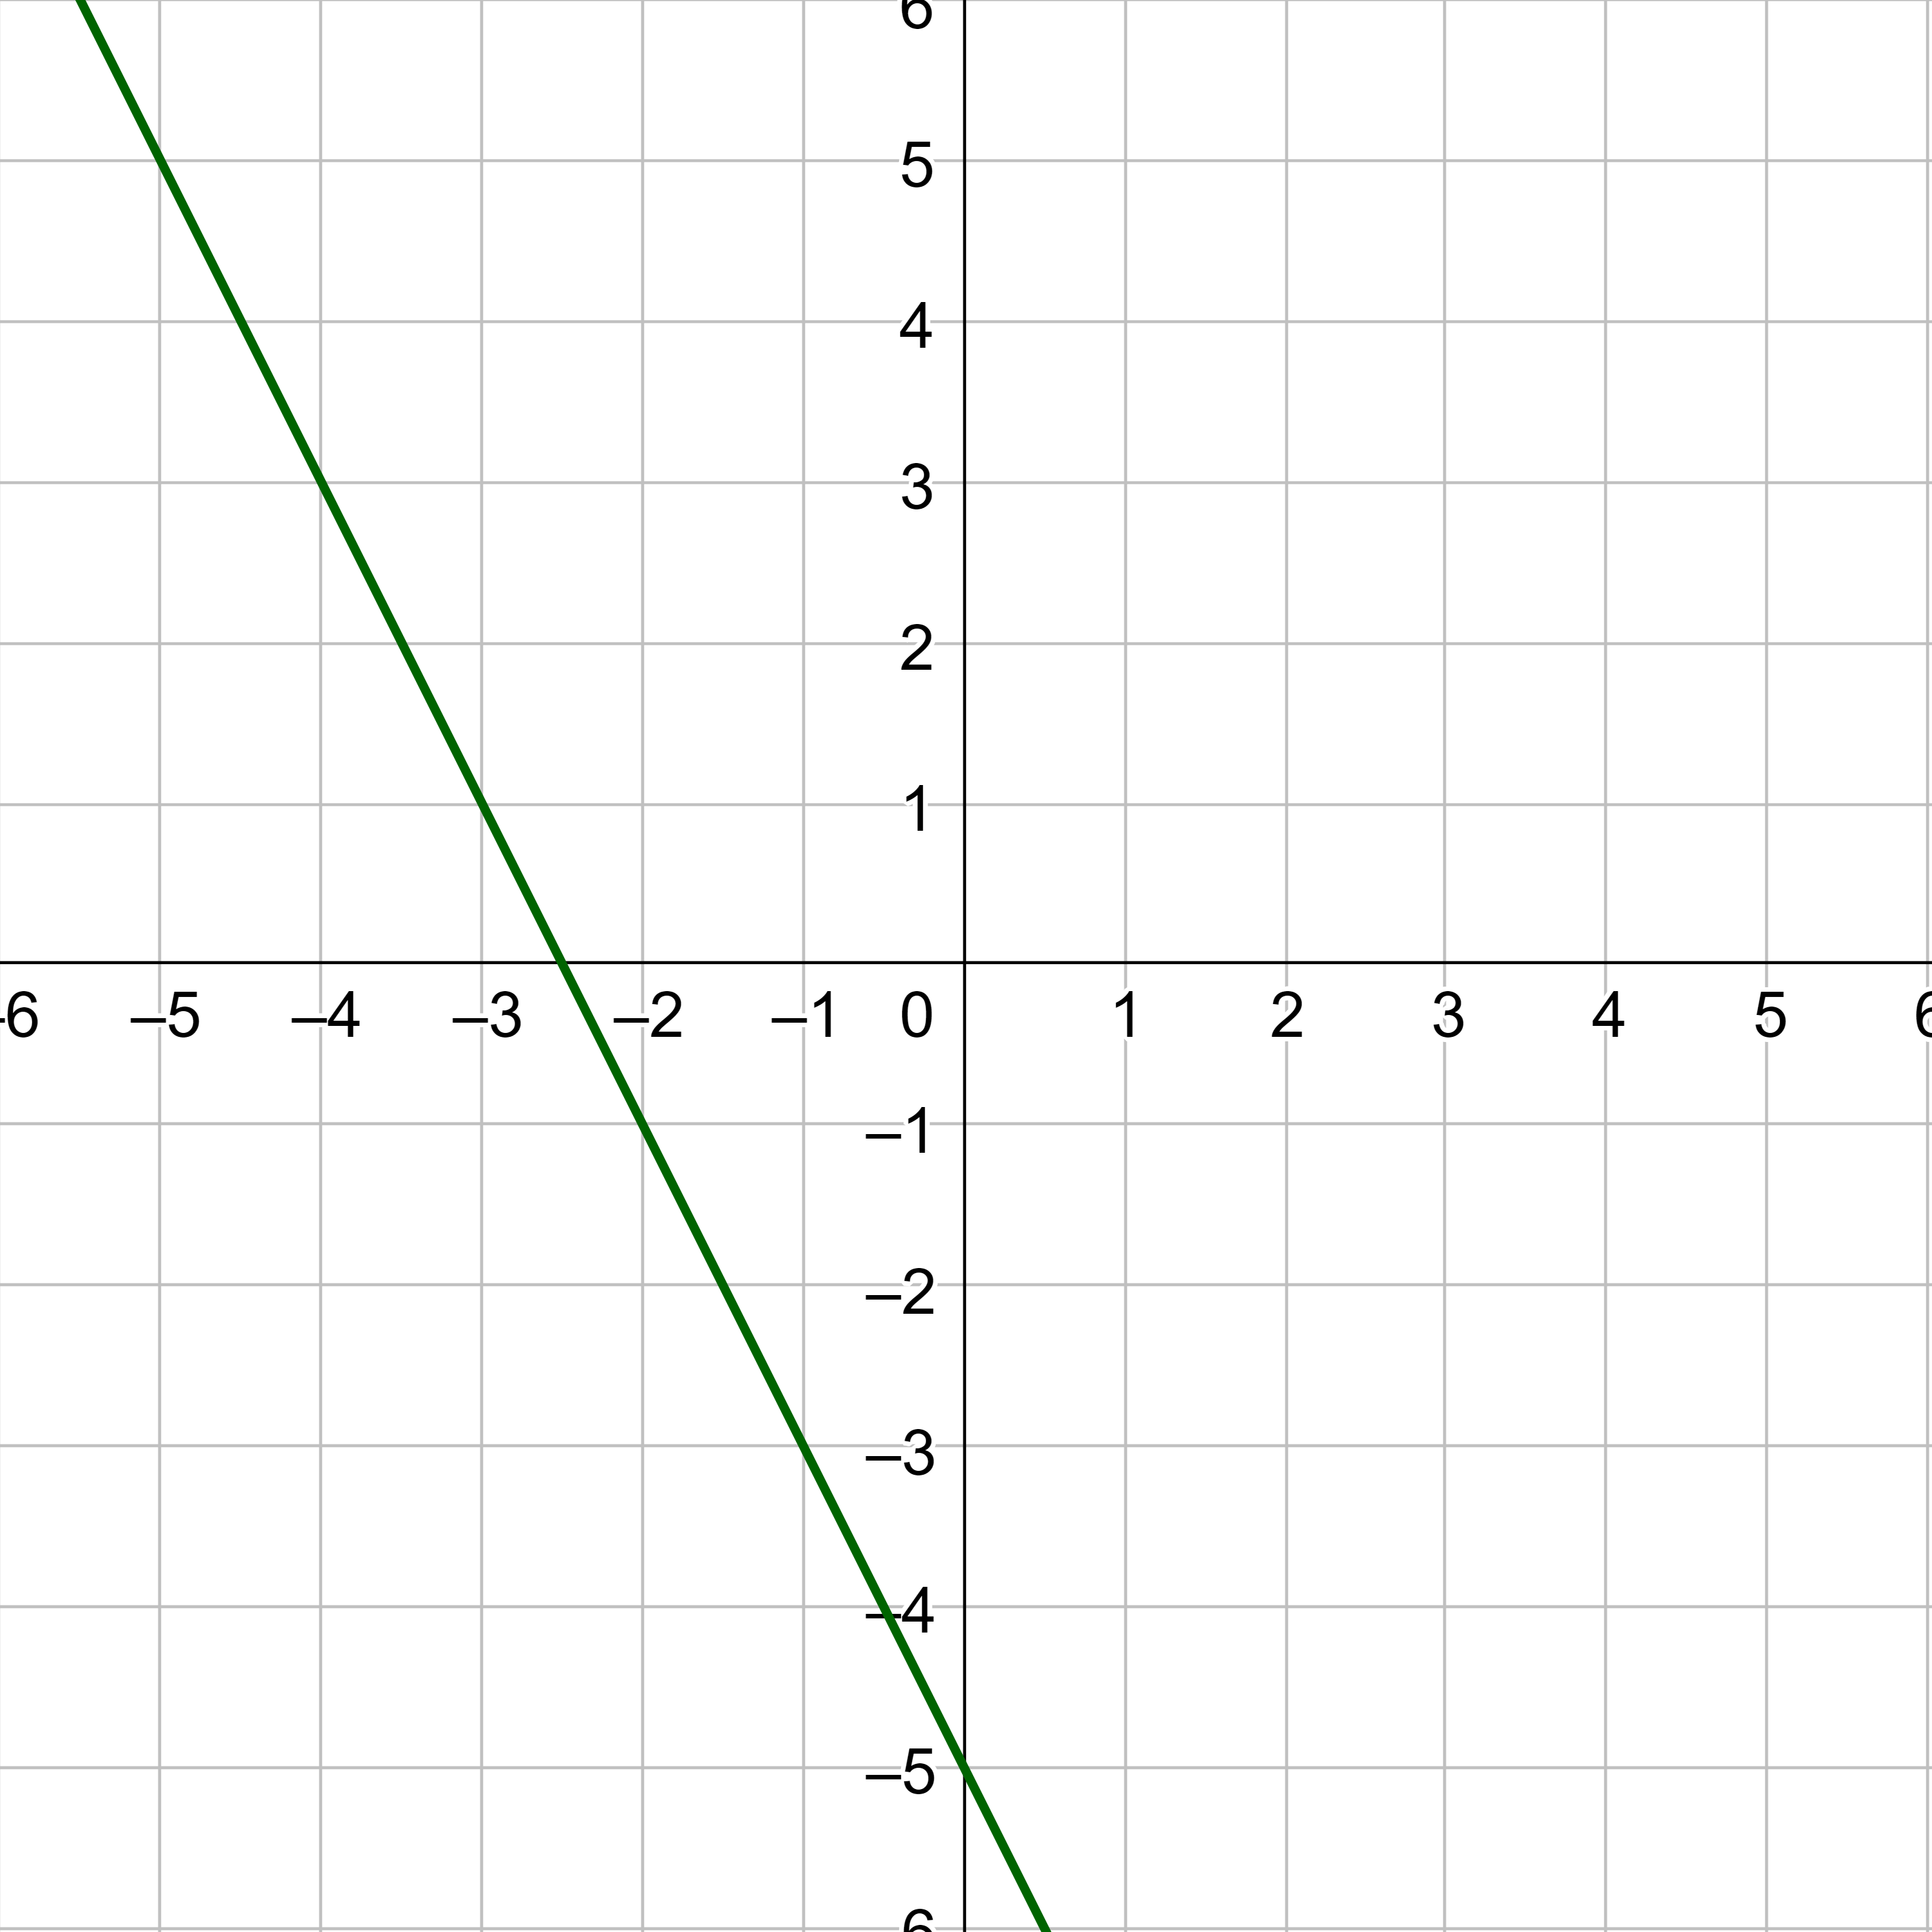
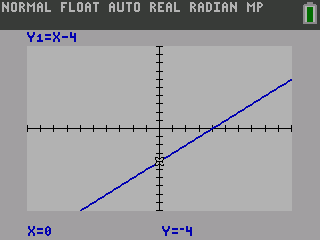
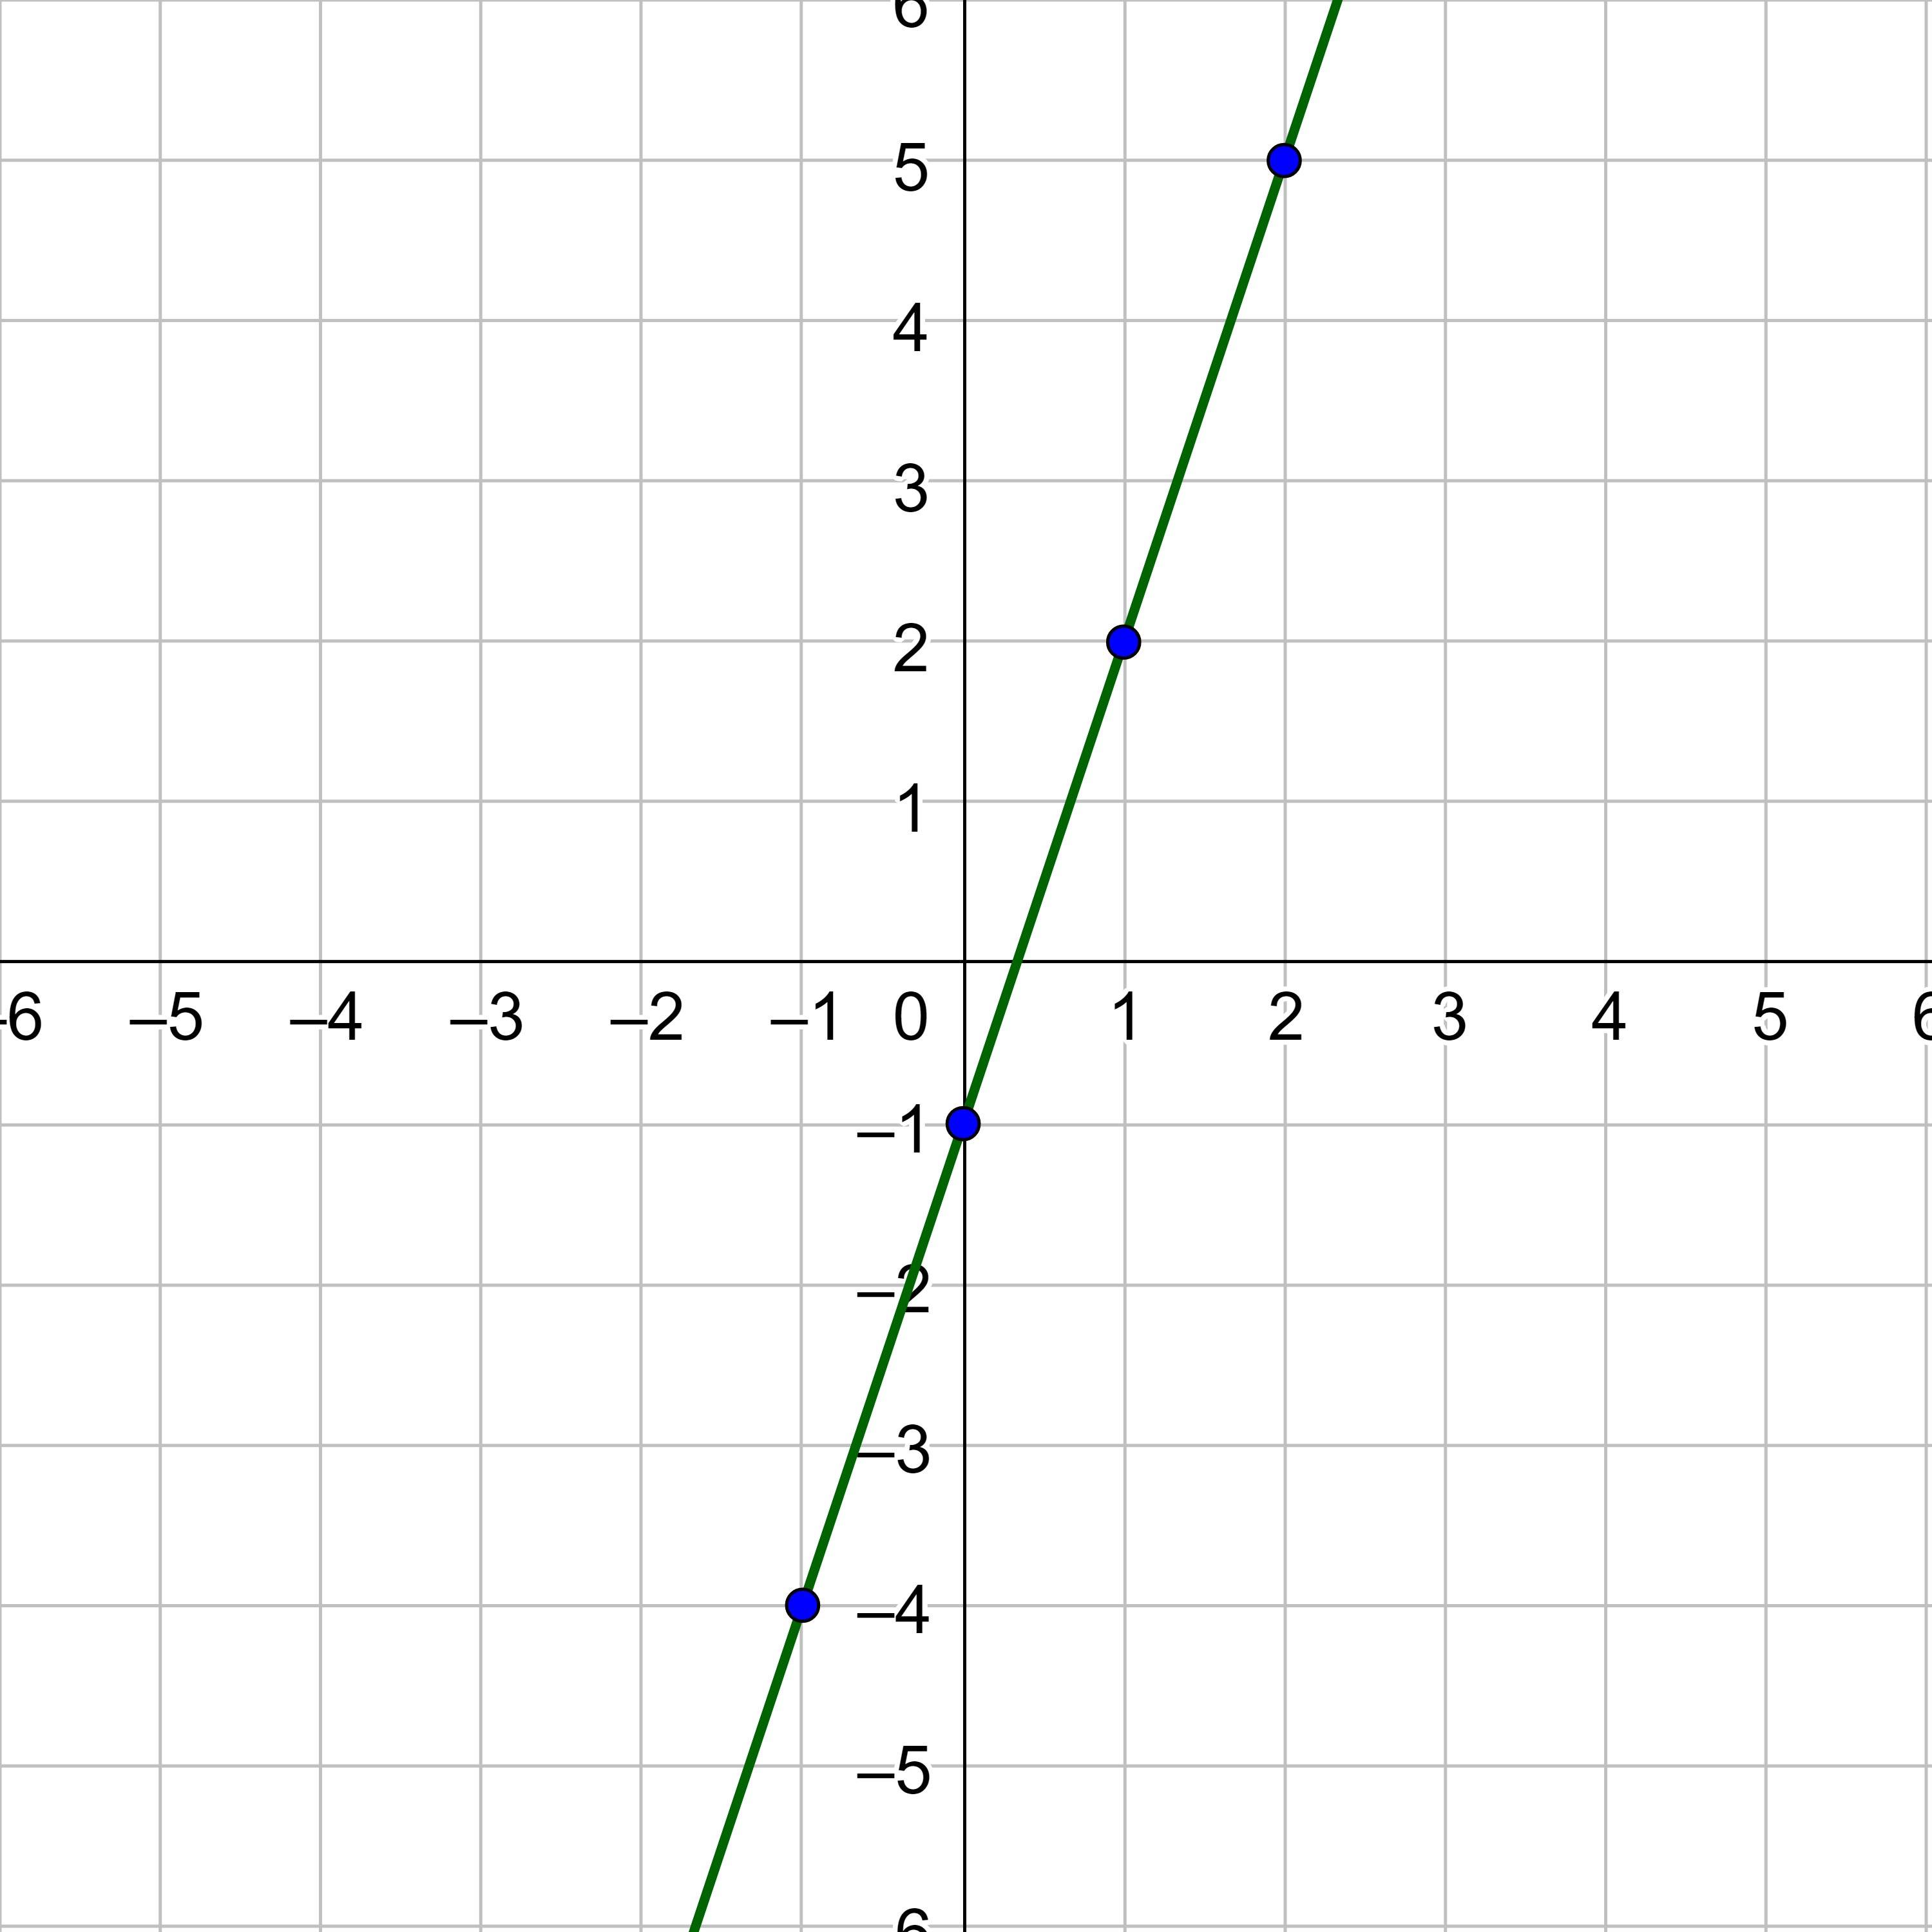
Use a graphing calculator to graph y = 3x − 1.
Answer
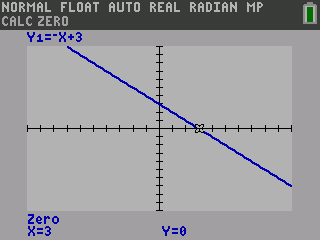
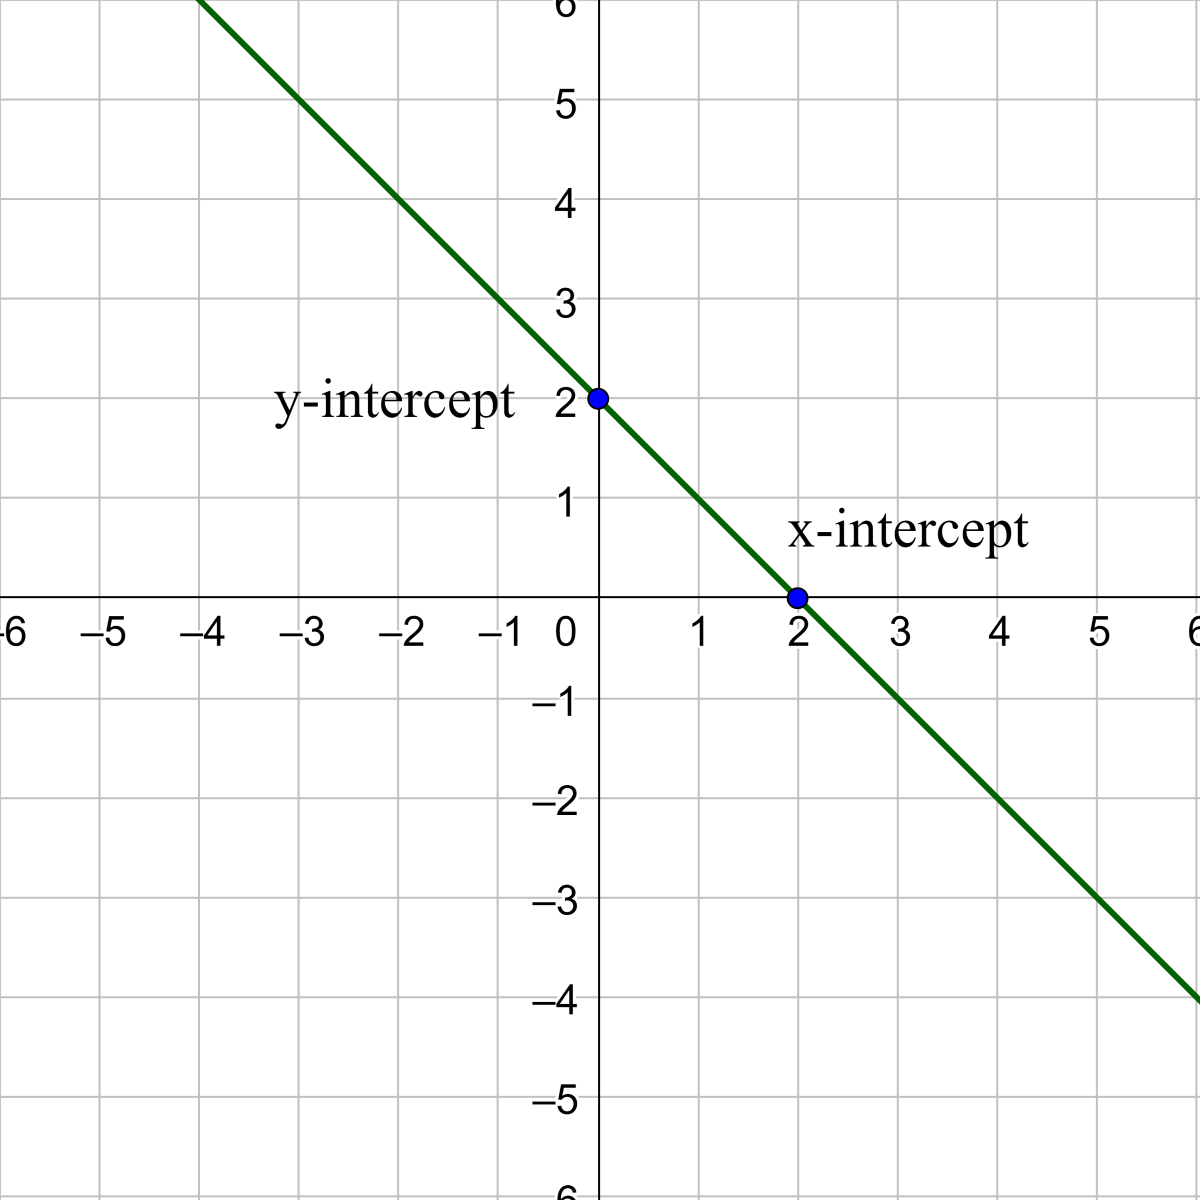
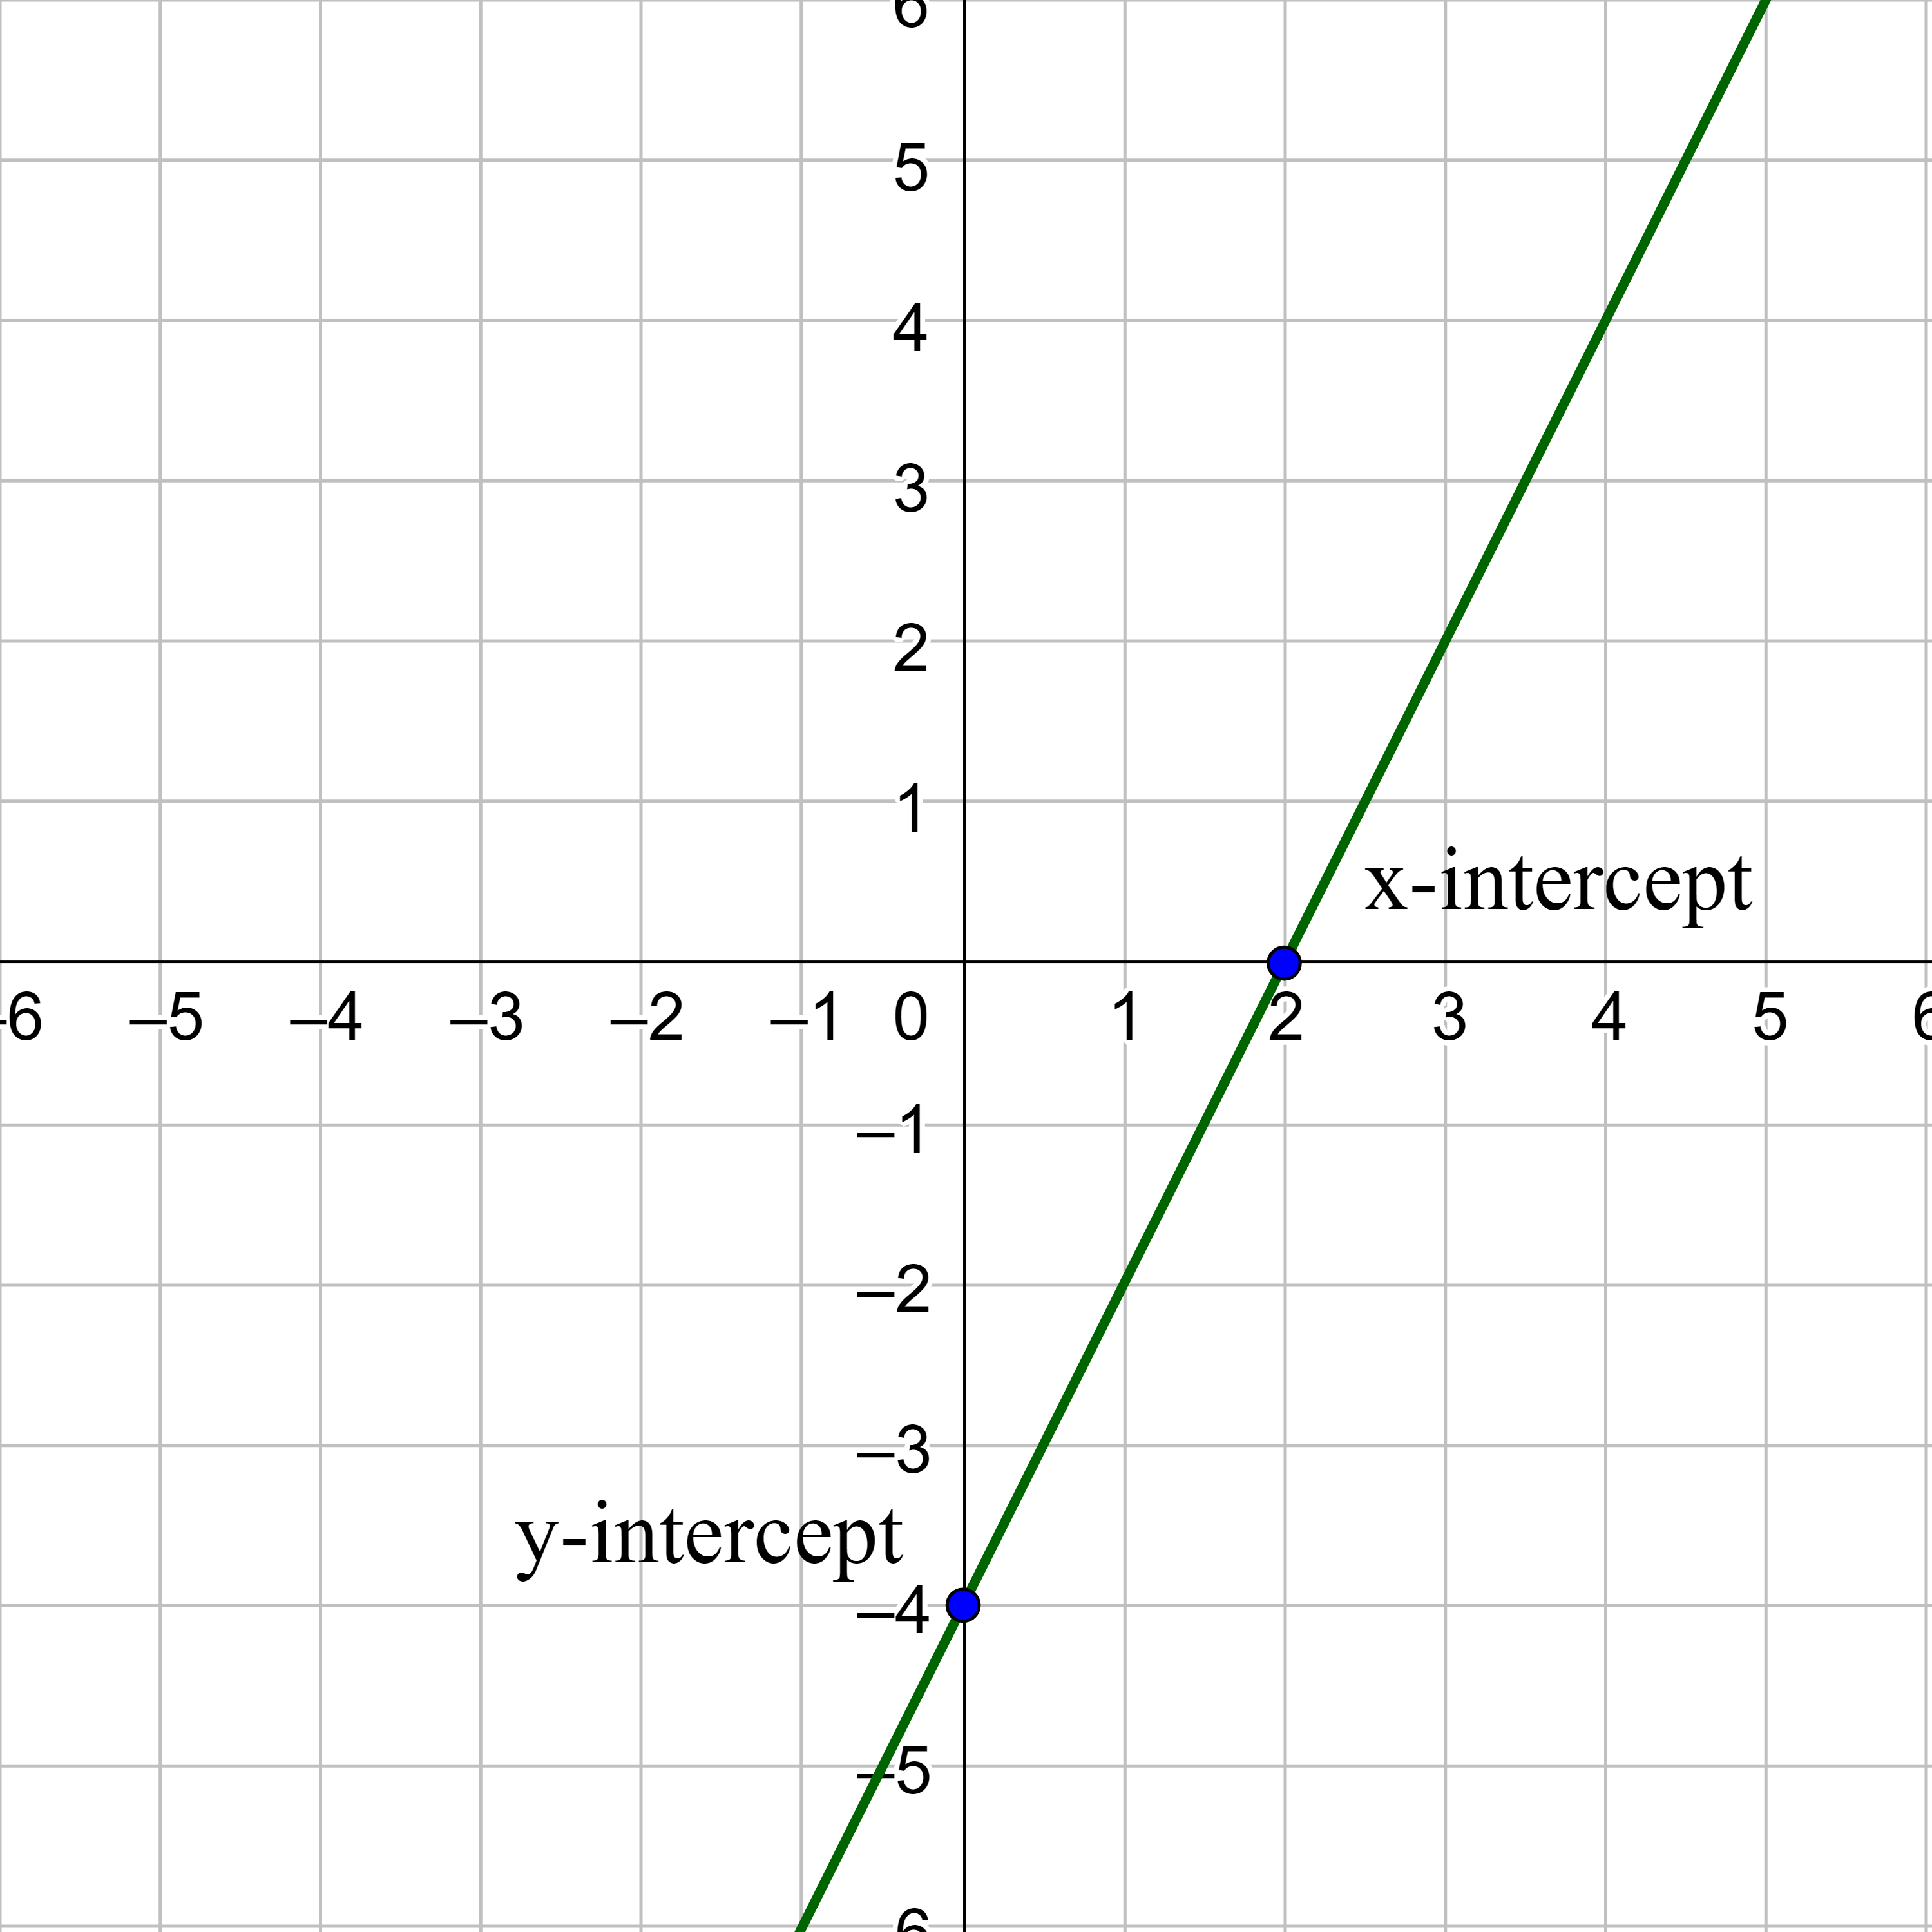
Two important points on a graph are the x-intercept and the y-intercept. The x-intercept is where the graph intersects the x-axis. Points on the x-axis are not up or down, so the y-coordinate is 0. To find the x-intercept, let the y be 0 and solve for x.
The y-intercept is where the graph intersects the y-axis. Points on the y-axis are not left or right, so the x-coordinate is 0. To find the y-intercept, let the x be 0 and solve for y.
x-intercept:
y-intercept:
Find the (a) x-intercept and (b) y-intercept of y = 4x − 2.
Solution
To find the x-intercept, substitute y = 0 and solve for x.
y = 4x − 2
0 = 4x − 2
2 = 4x
$$ x = \frac{1}{2} $$
\(\left(\frac{1}{2}, 0\right)\)
To find the y-intercept, substitute x = 0 and solve for y.
y = 4x − 2
y = 4(0) − 2
y = −2
(0, −2)
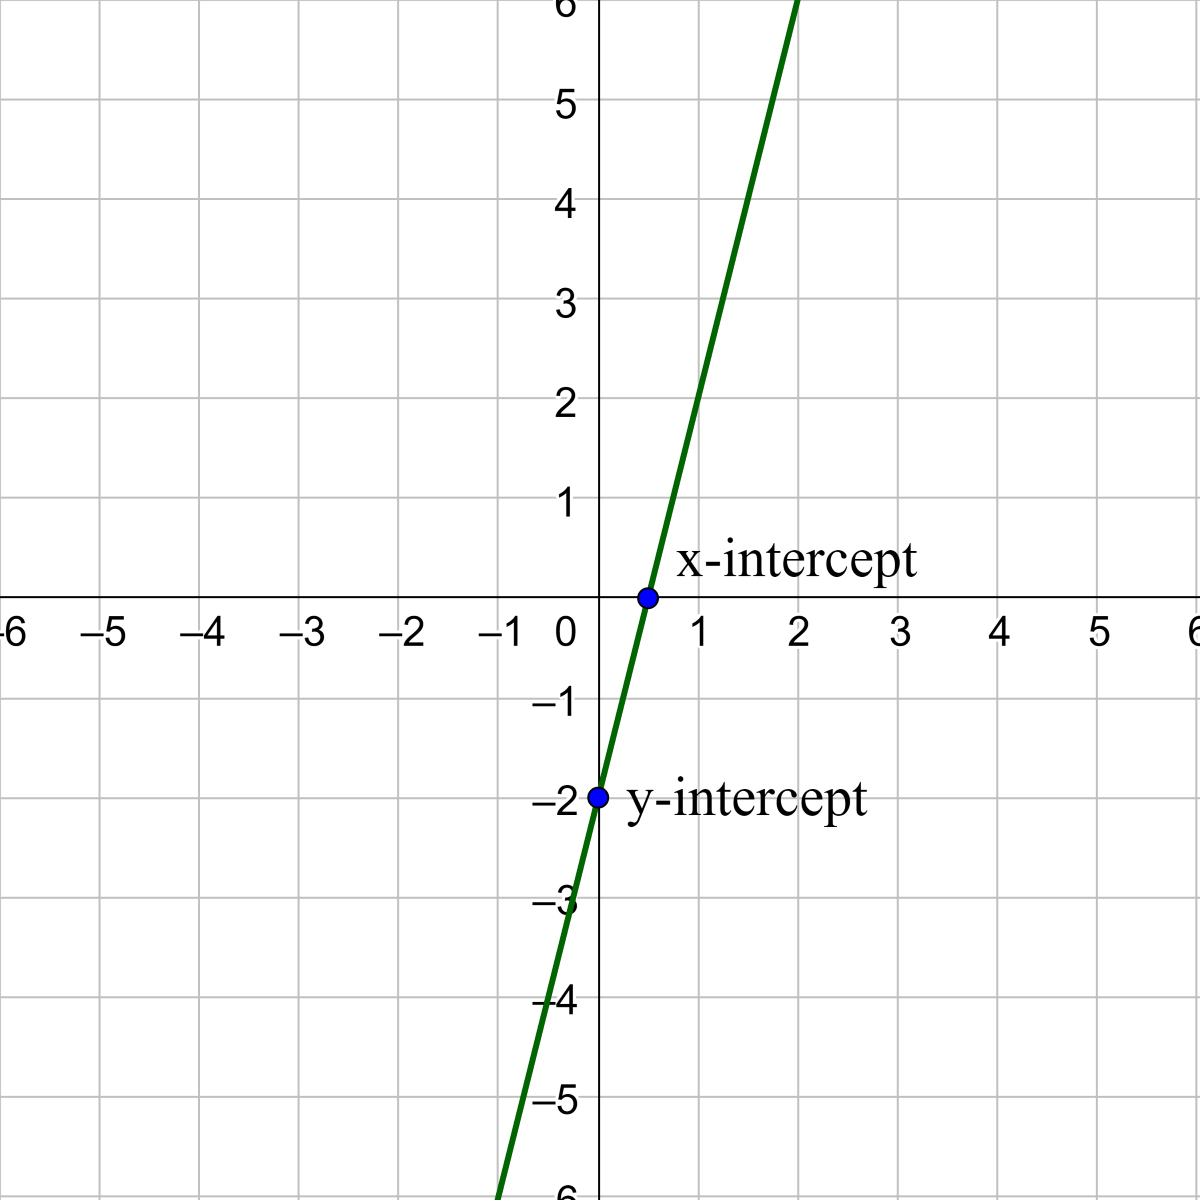
Find the (a) x-intercept and (b) y-intercept of 2x − y = 4.
Answer
(2, 0); (0, −4)
Circles are the set of all points, (x, y) a given distance, r, from the center point (h, k). The distance formula gives the equation of a circle.
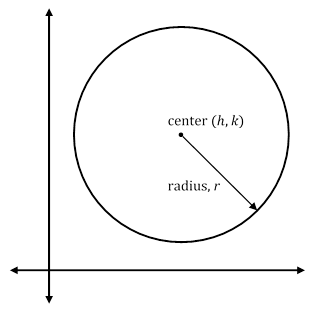
$$ r = \sqrt{(x - h)^2 + (y - k)^2} $$
Square both sides and rearrange.
$$ (x - h)^2 + (y - k)^2 = r^2 $$
Graph a circle by plotting the center and then moving the radius away from the center in every direction.
$$ (x - h)^2 + (y - k)^2 = r^2 $$
where (h, k) is the center and r is the radius.
Graph a circle by plotting the center and then moving the radius away from the center in every direction. See .
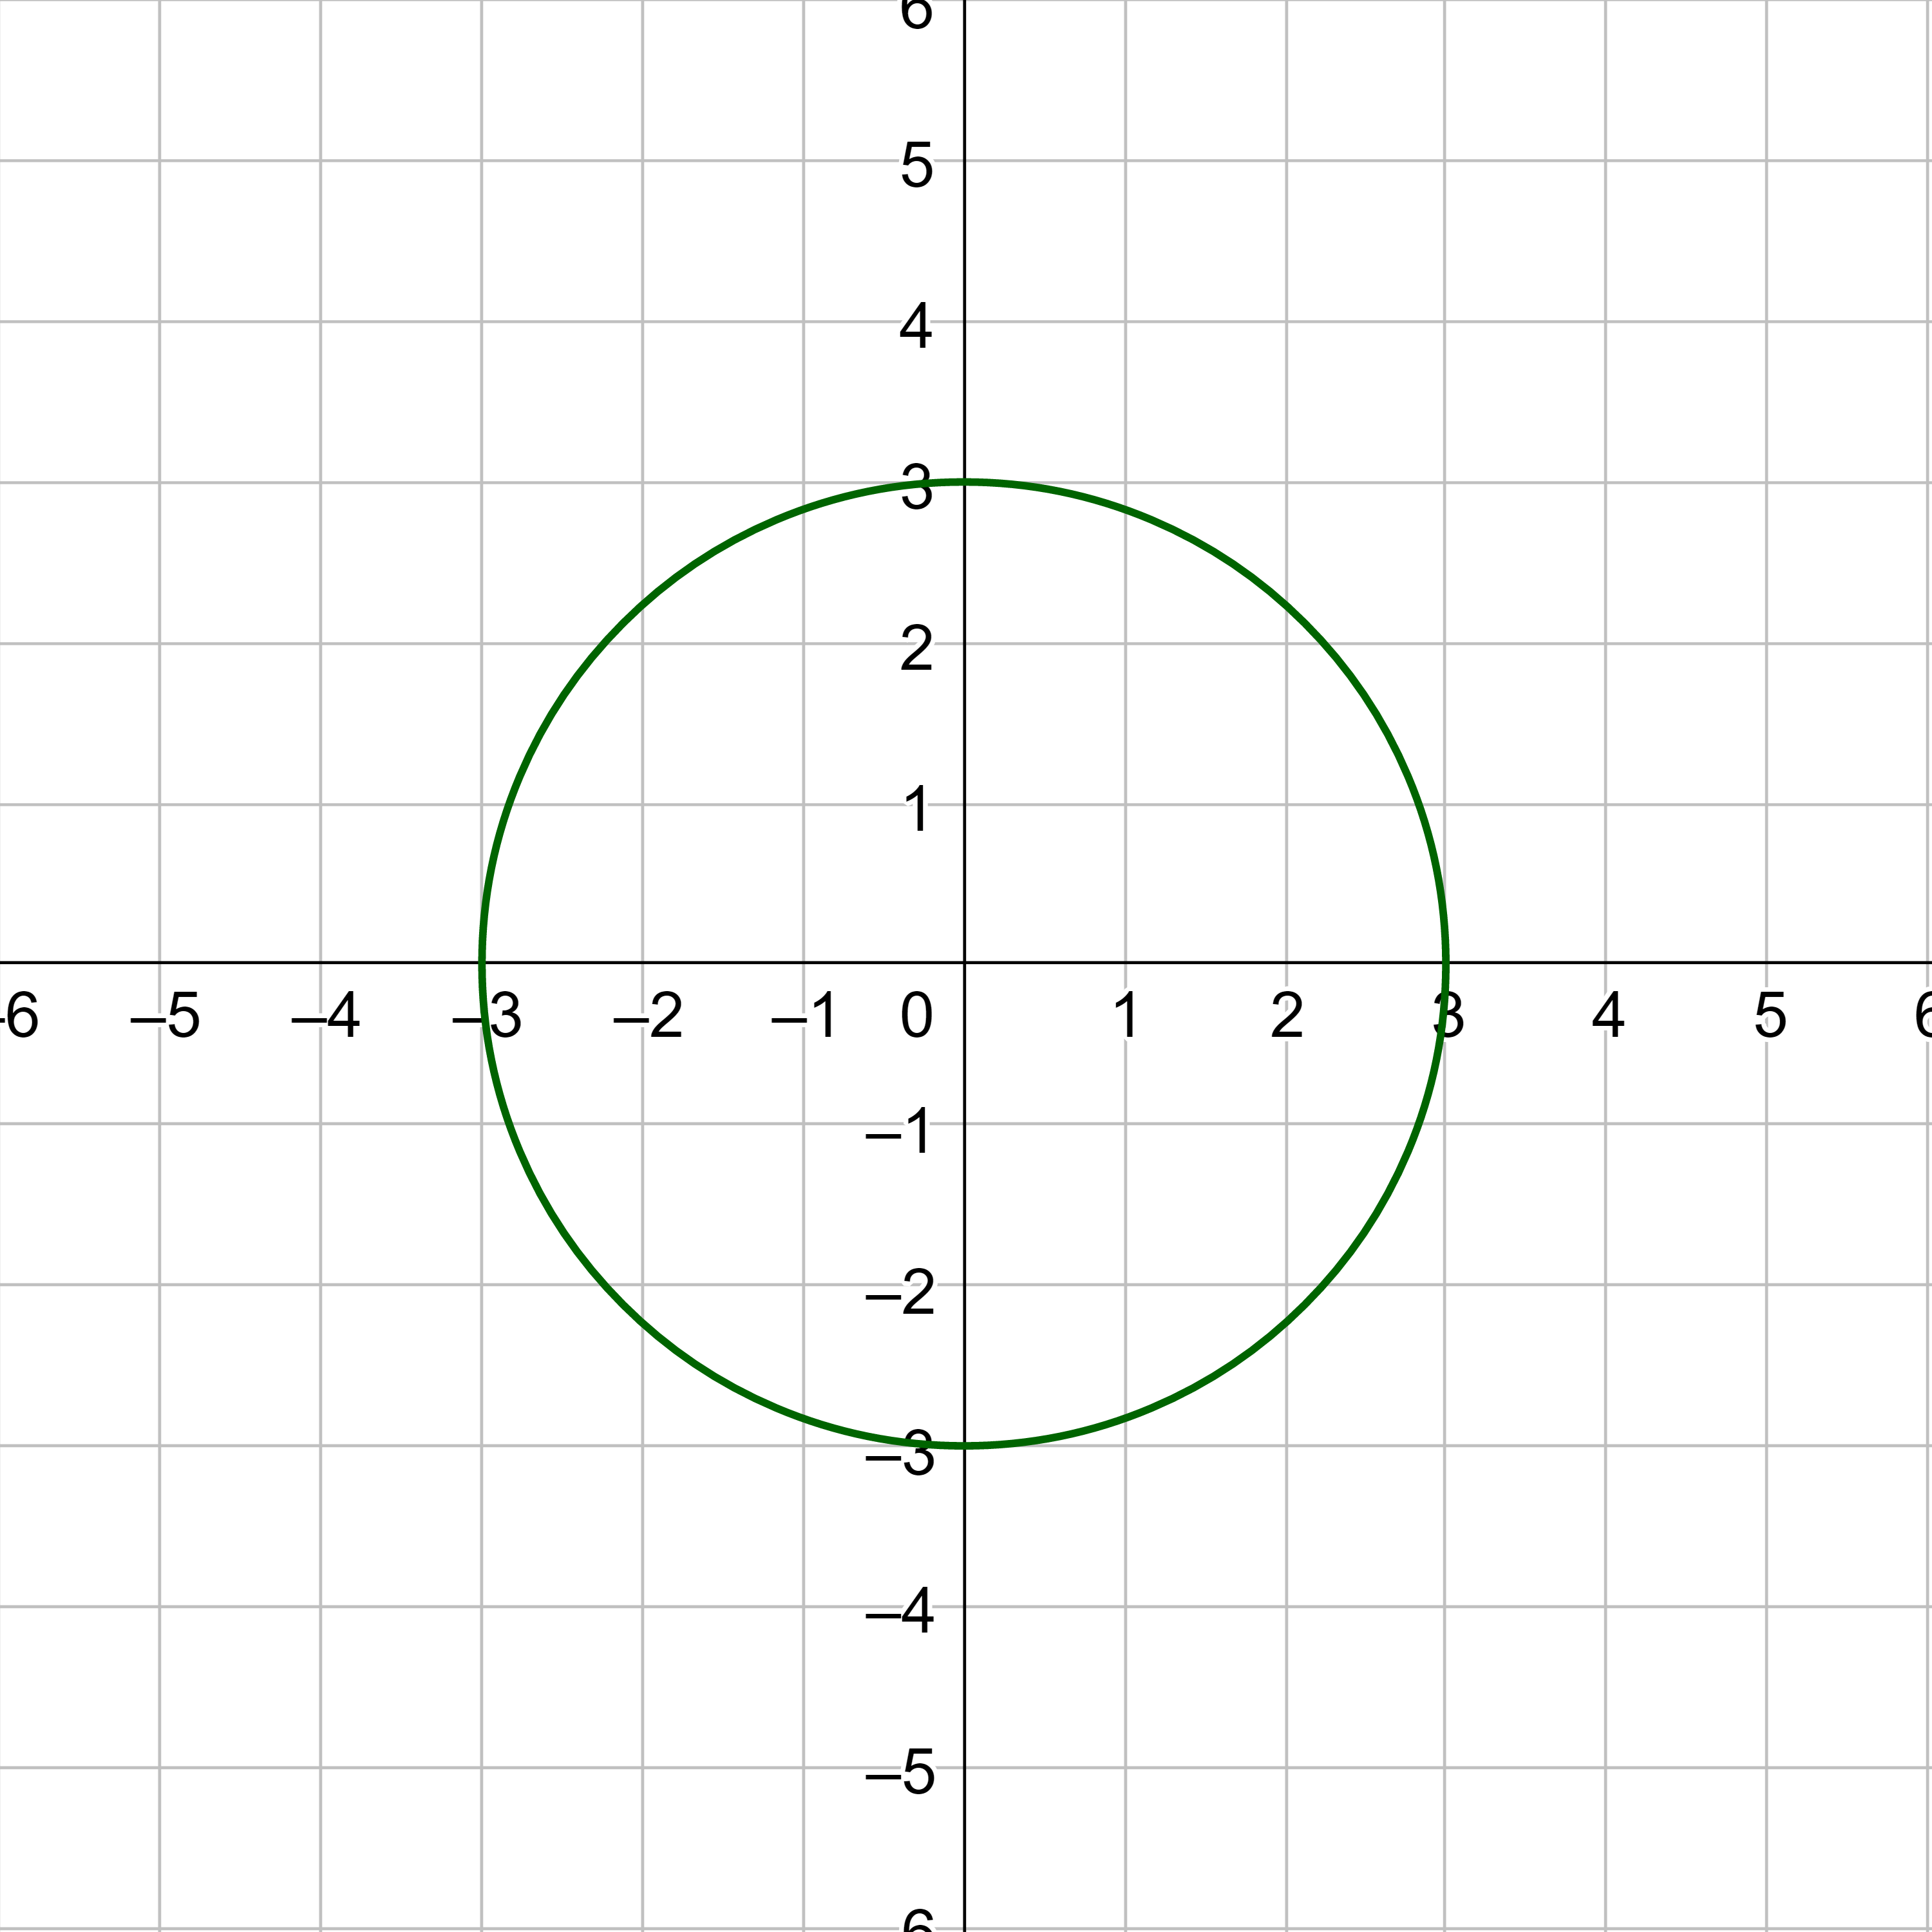
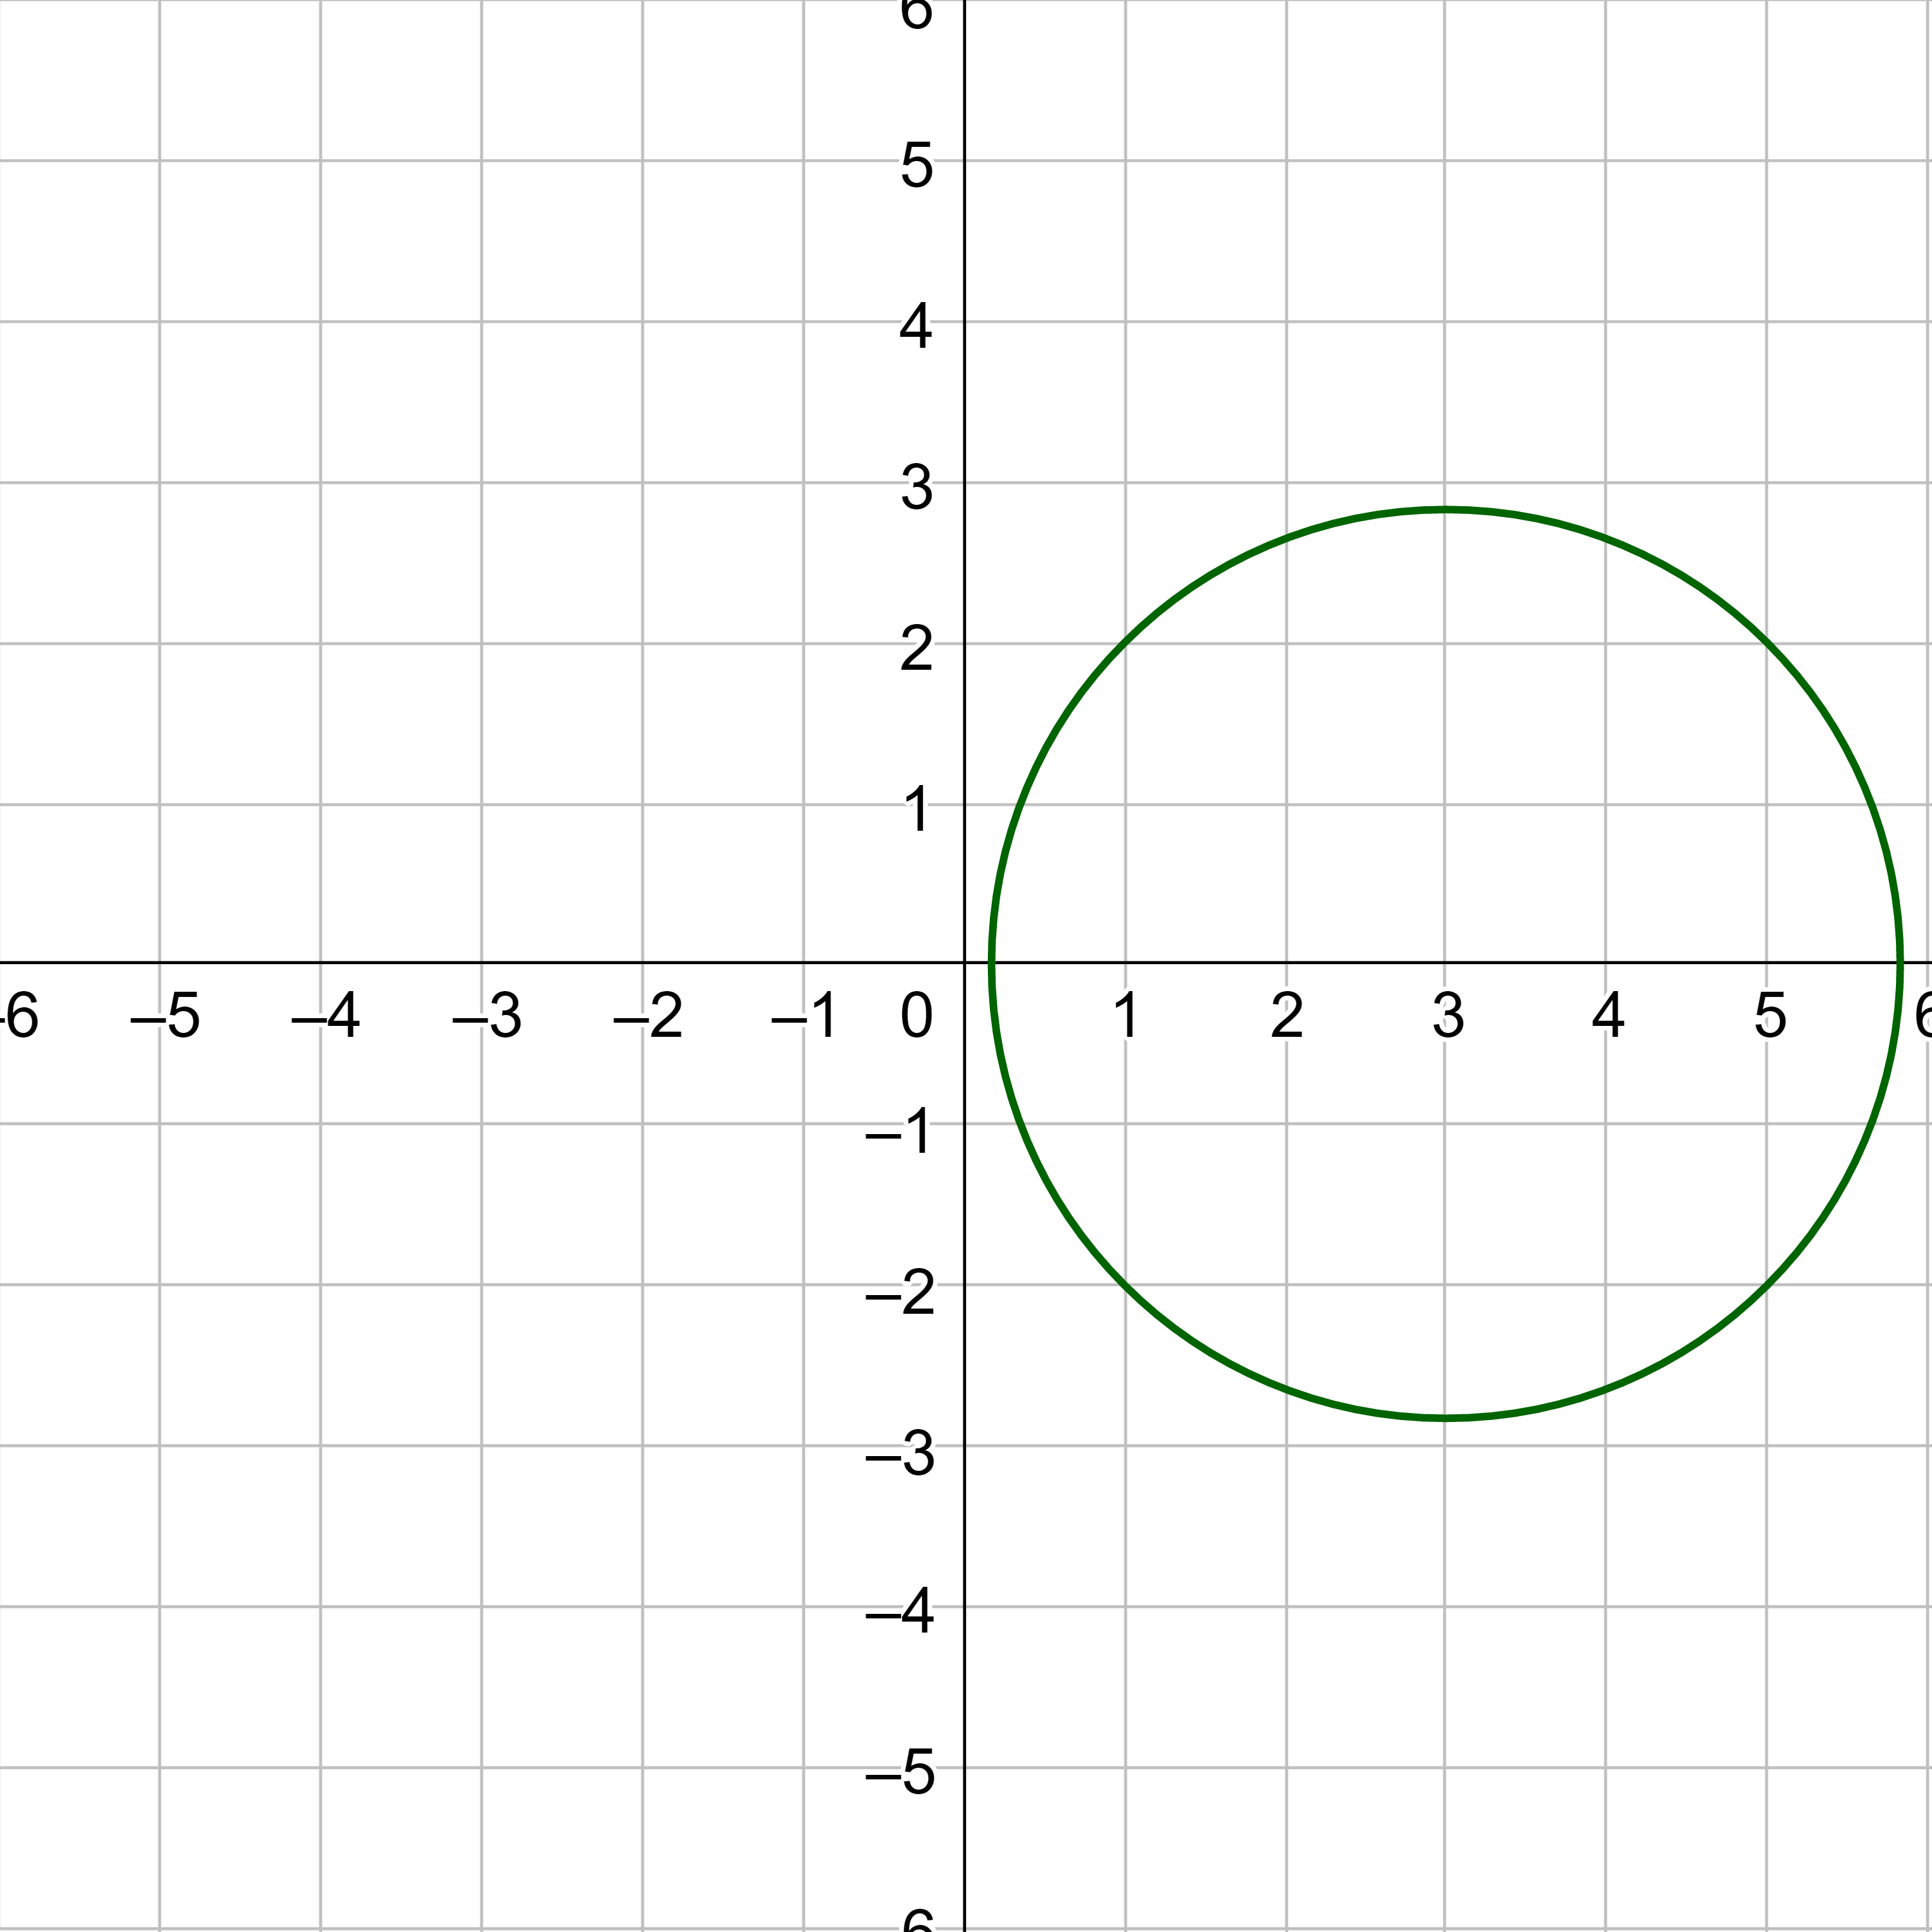
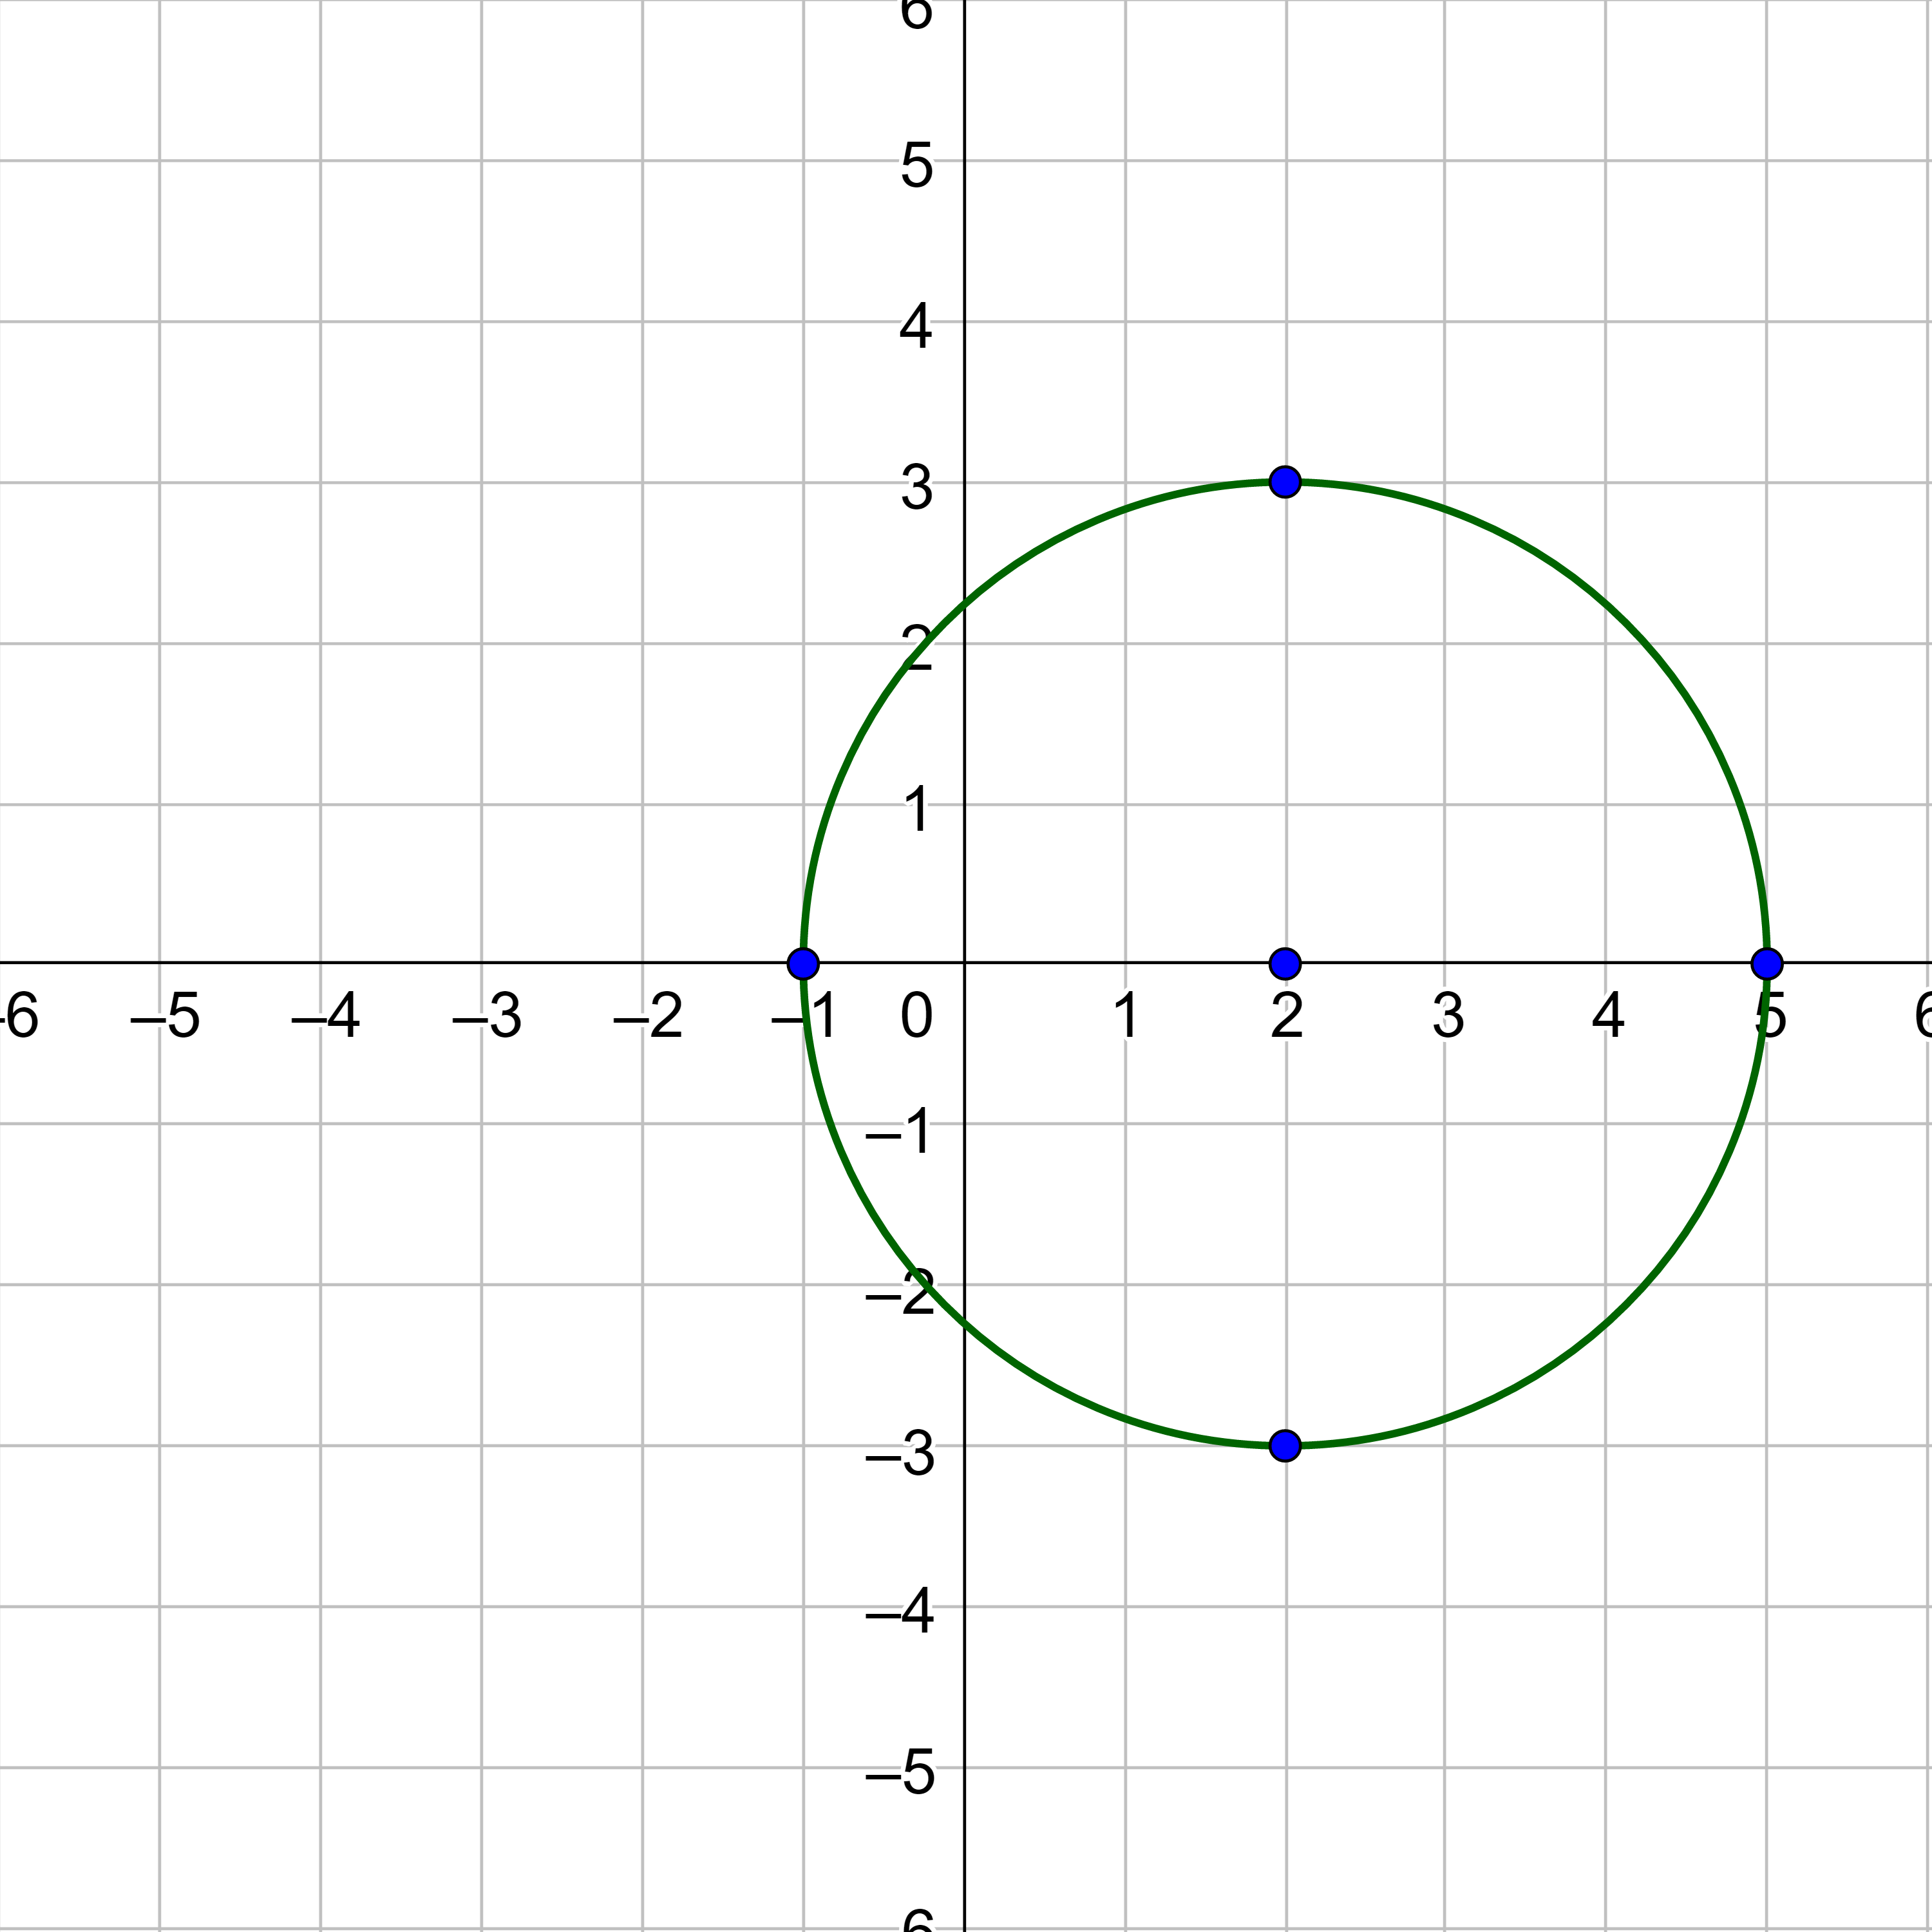
Graph \((x - 2)^2 + y^2 = 9\).
Solution
Compare \((x - 2)^2 + y^2 = 9\) with \((x - h)^2 + (y - k)^2 = r^2\) to see that h = 2, k = 0 because \((y - 0)^2 = y^2\). Also, \(r^2 = 9\), so r = 3. Thus the center is (2, 0) and the radius is 3. Plot the center and then move the distance of the radius in every direction.
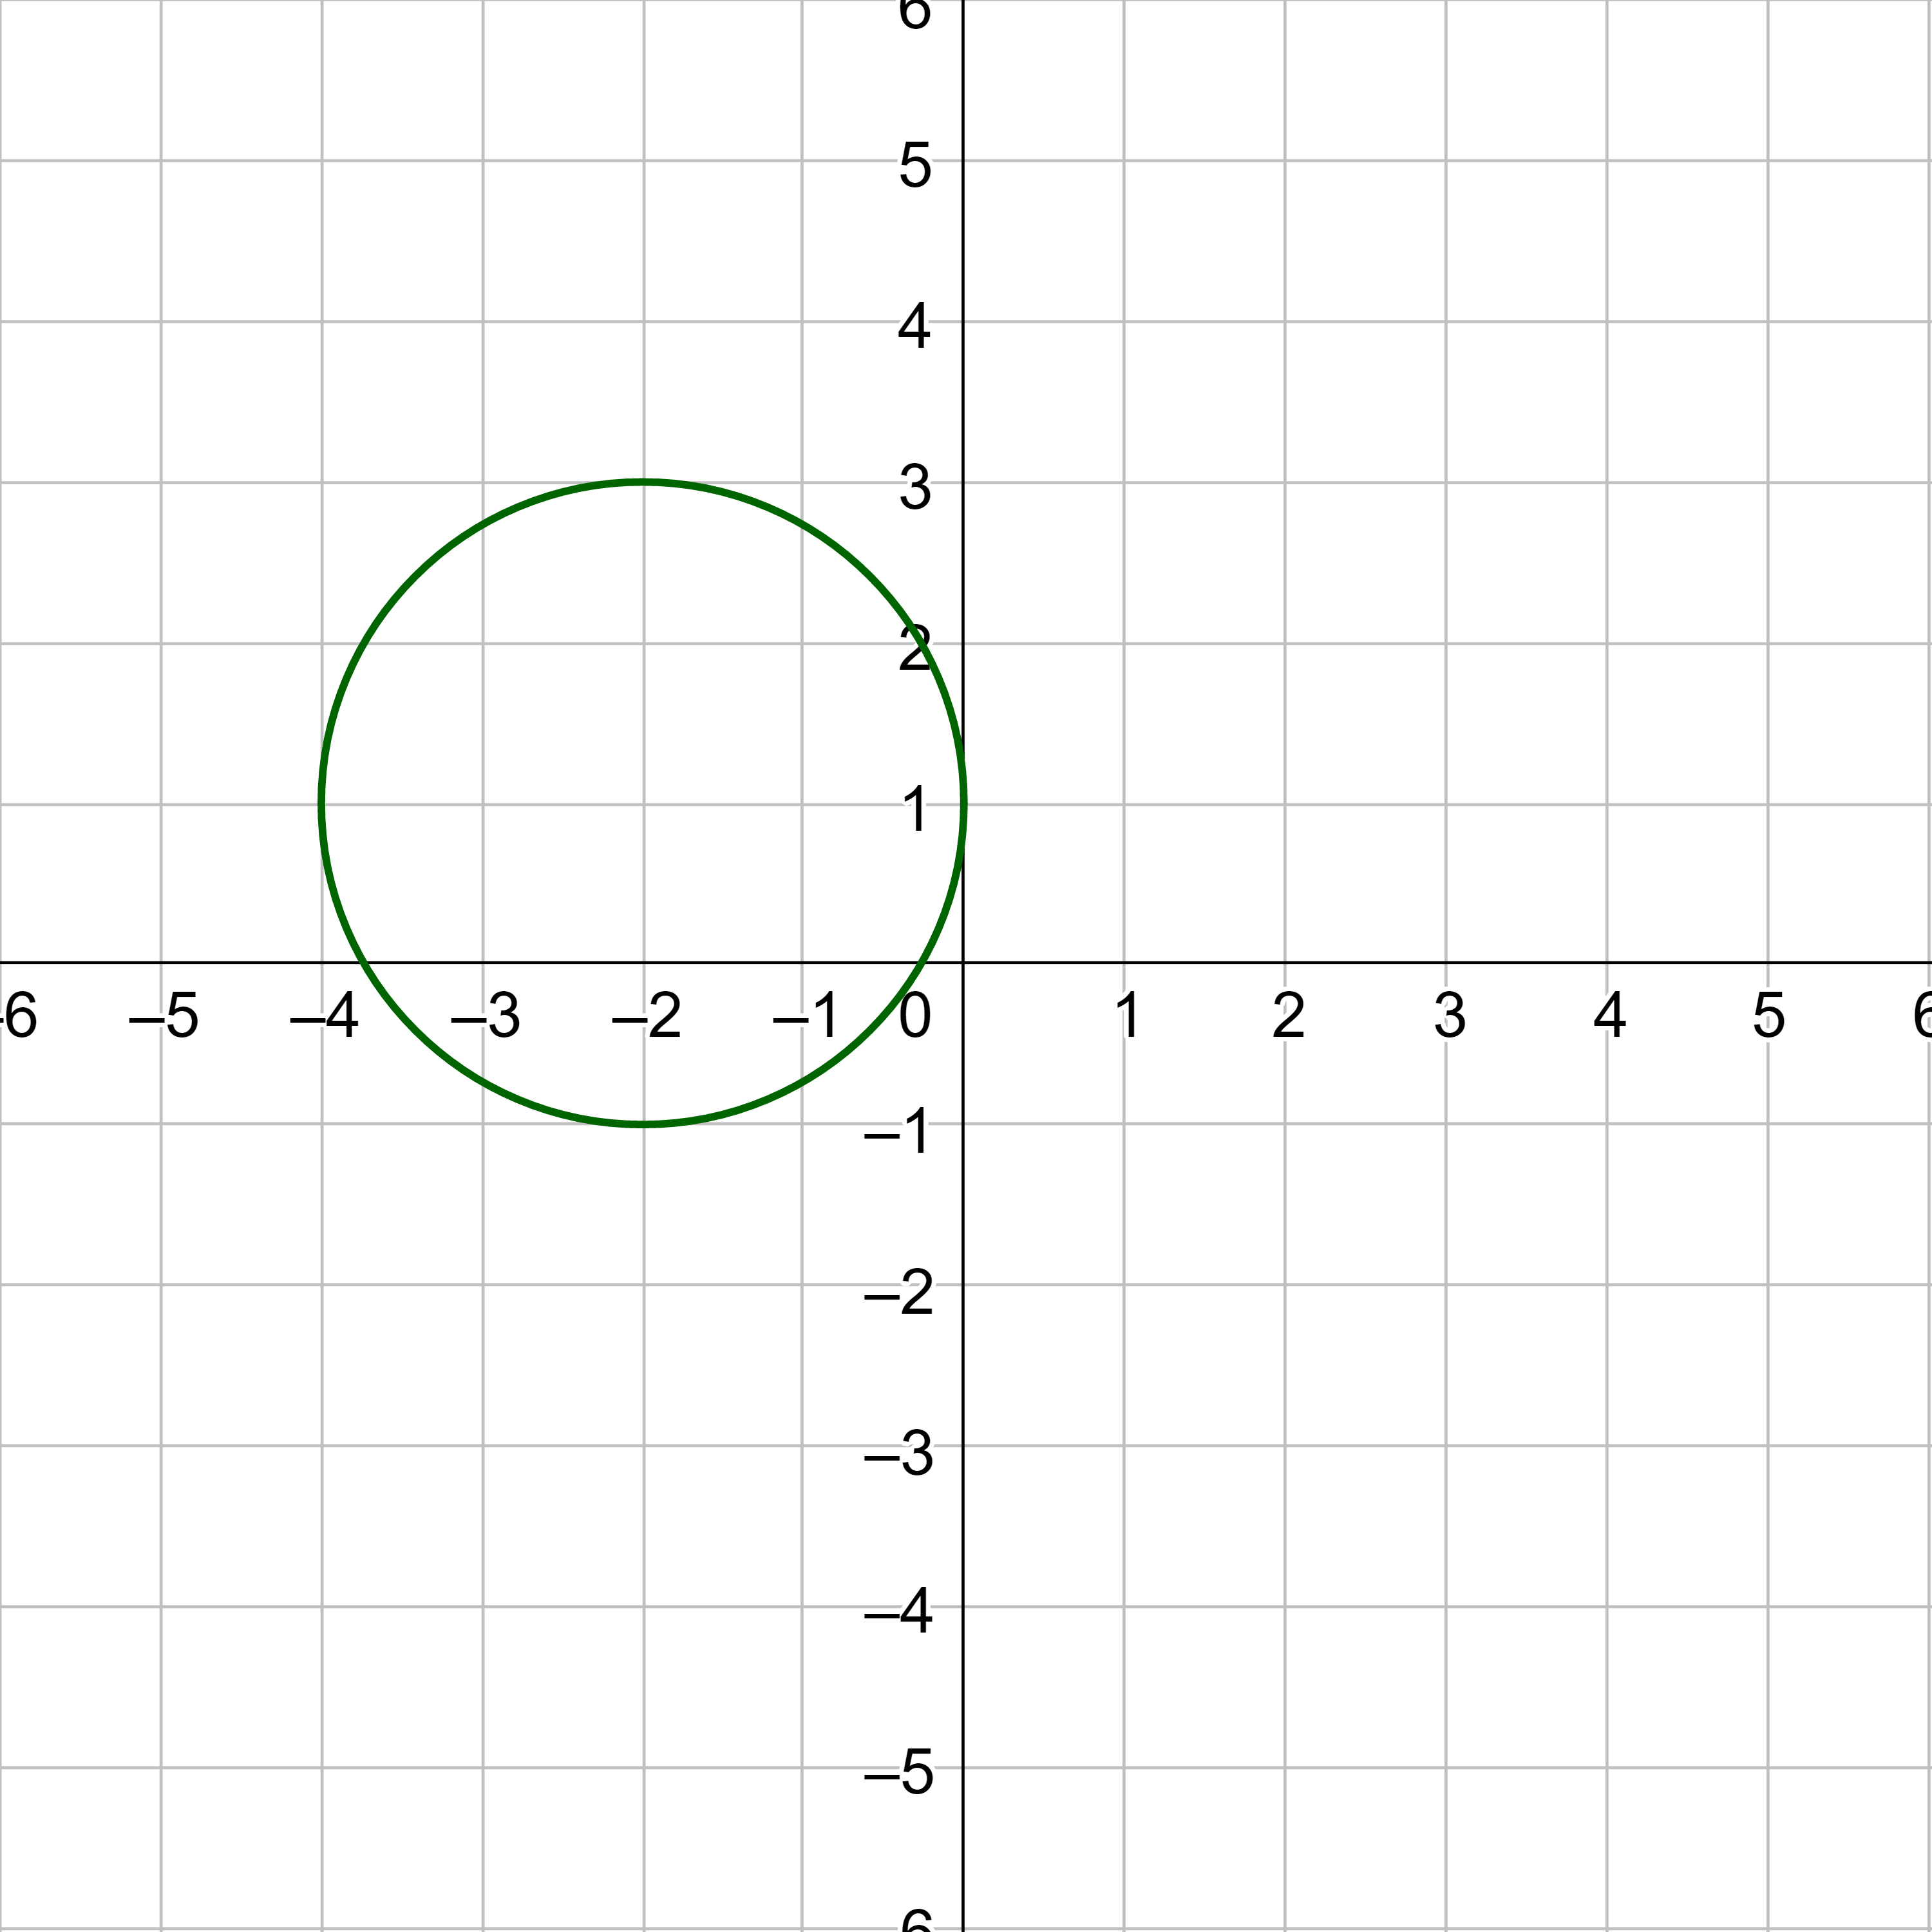
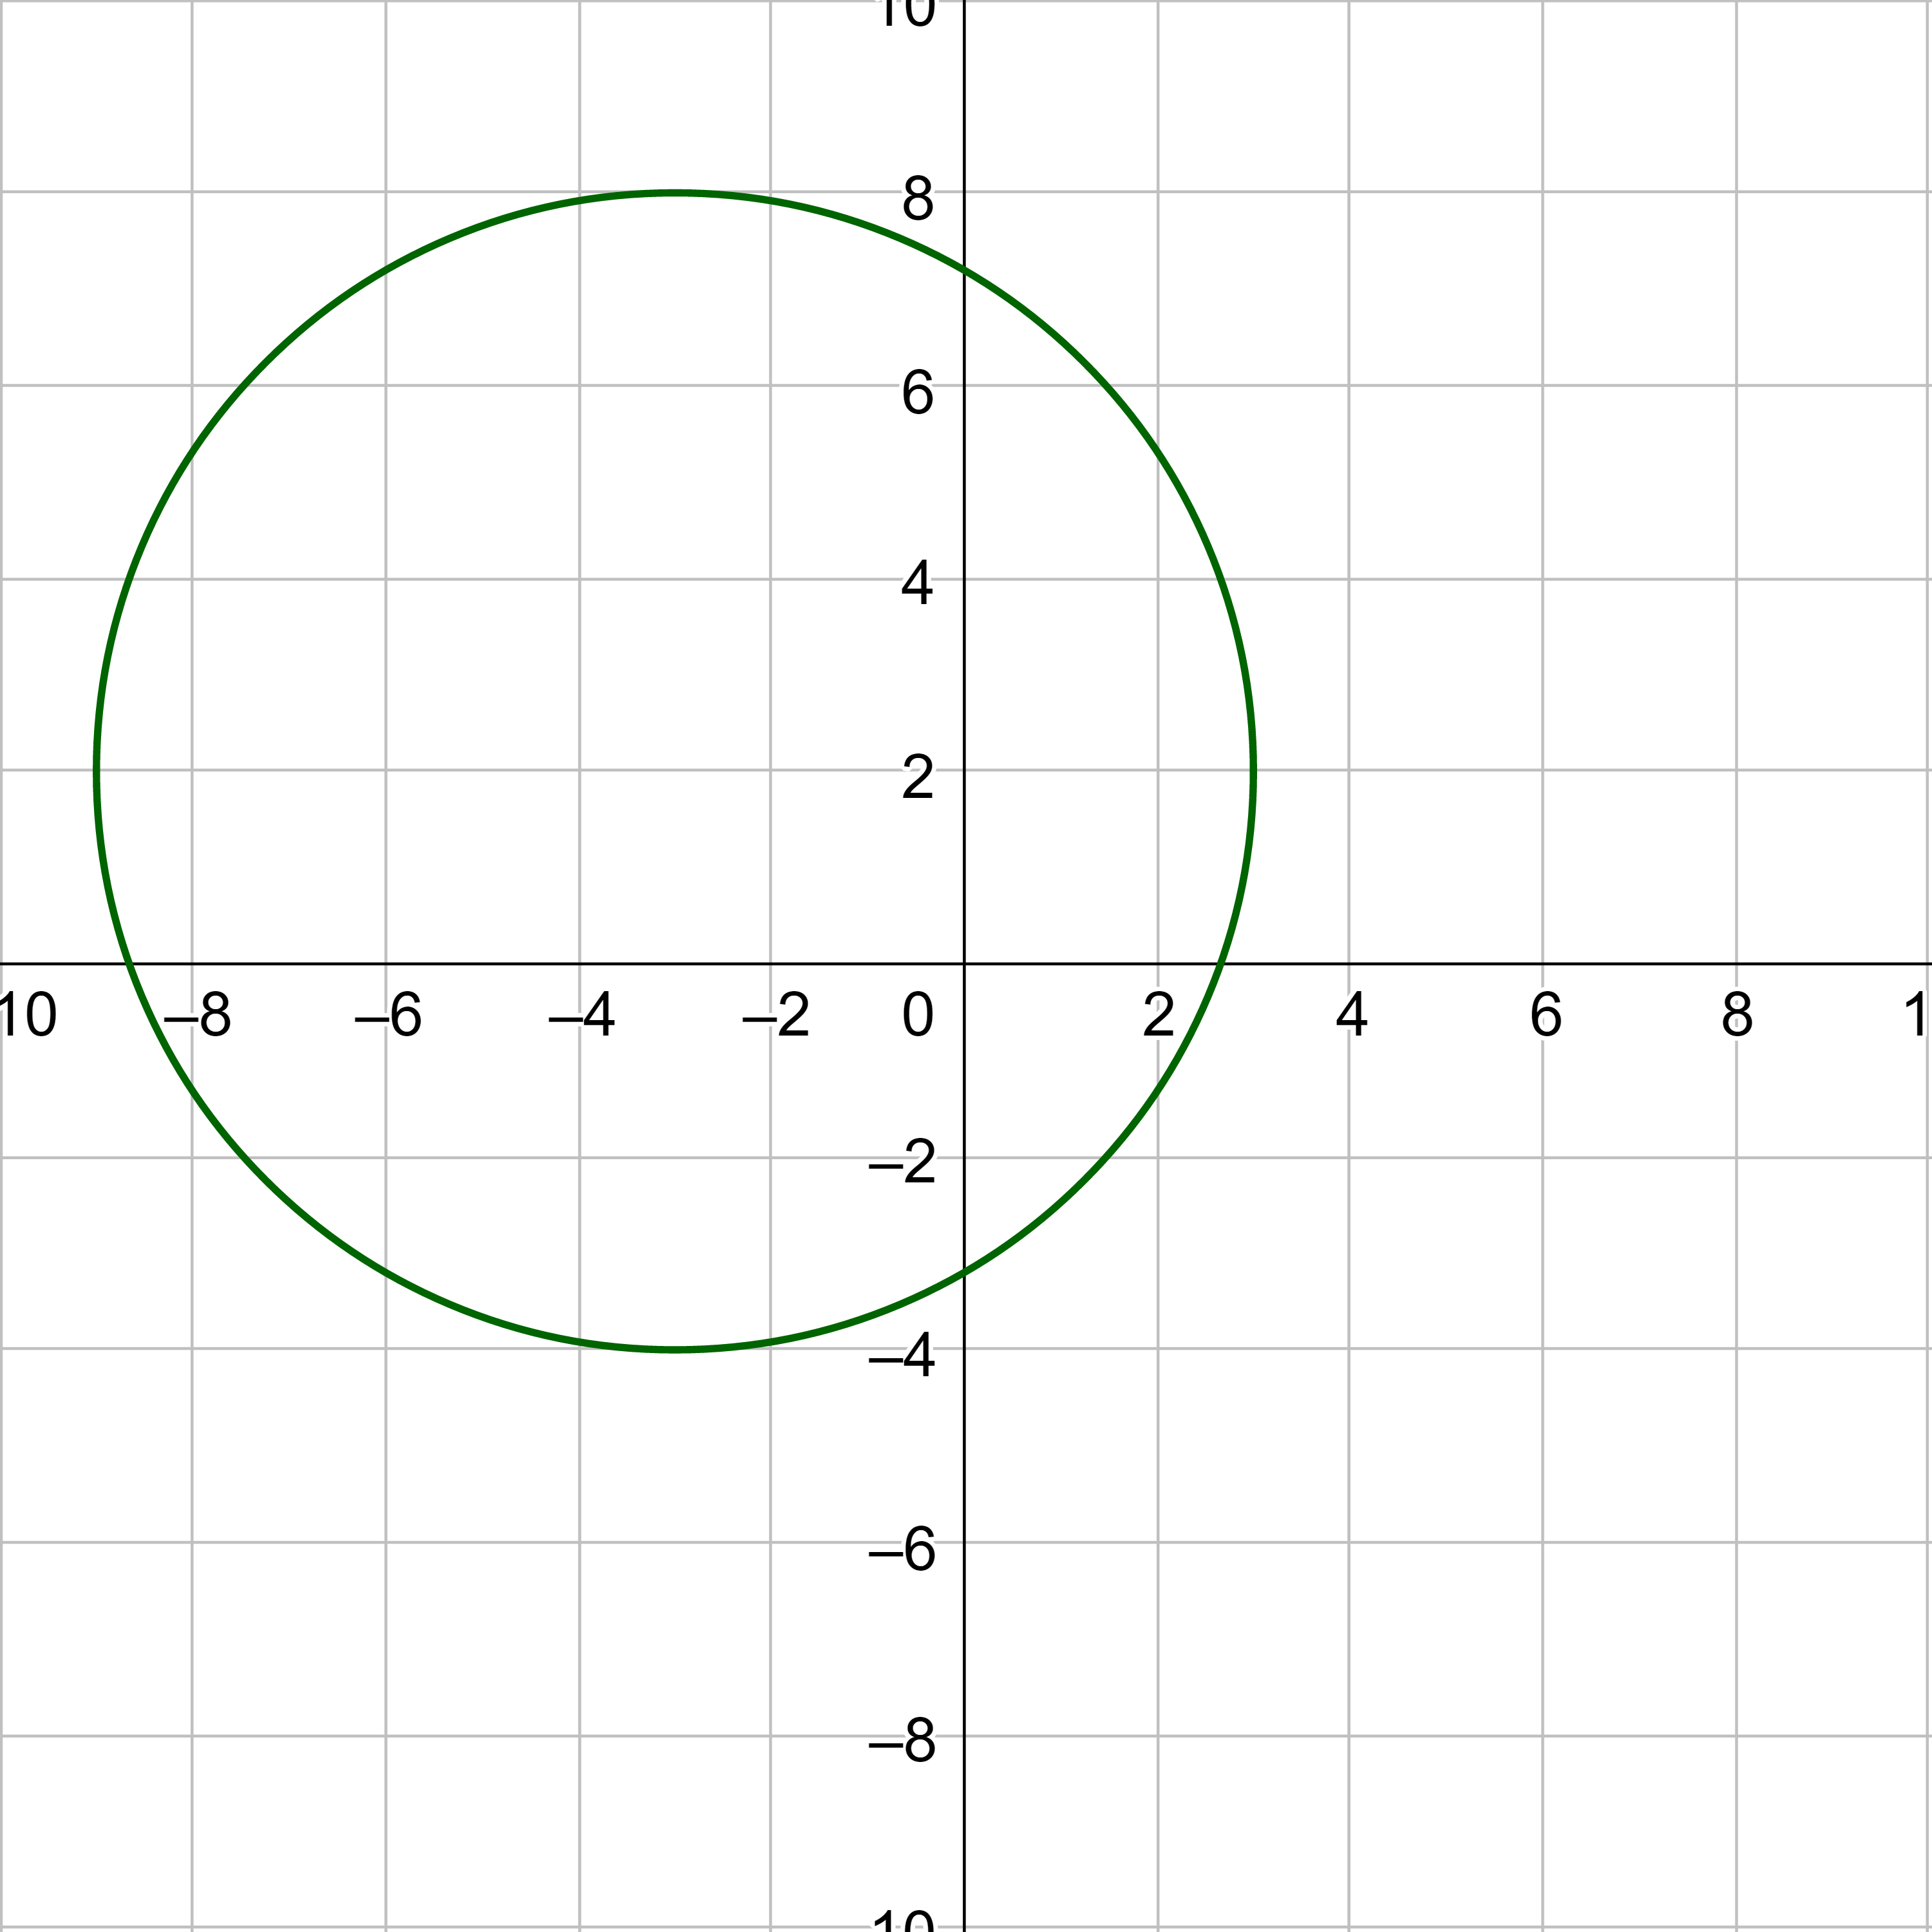
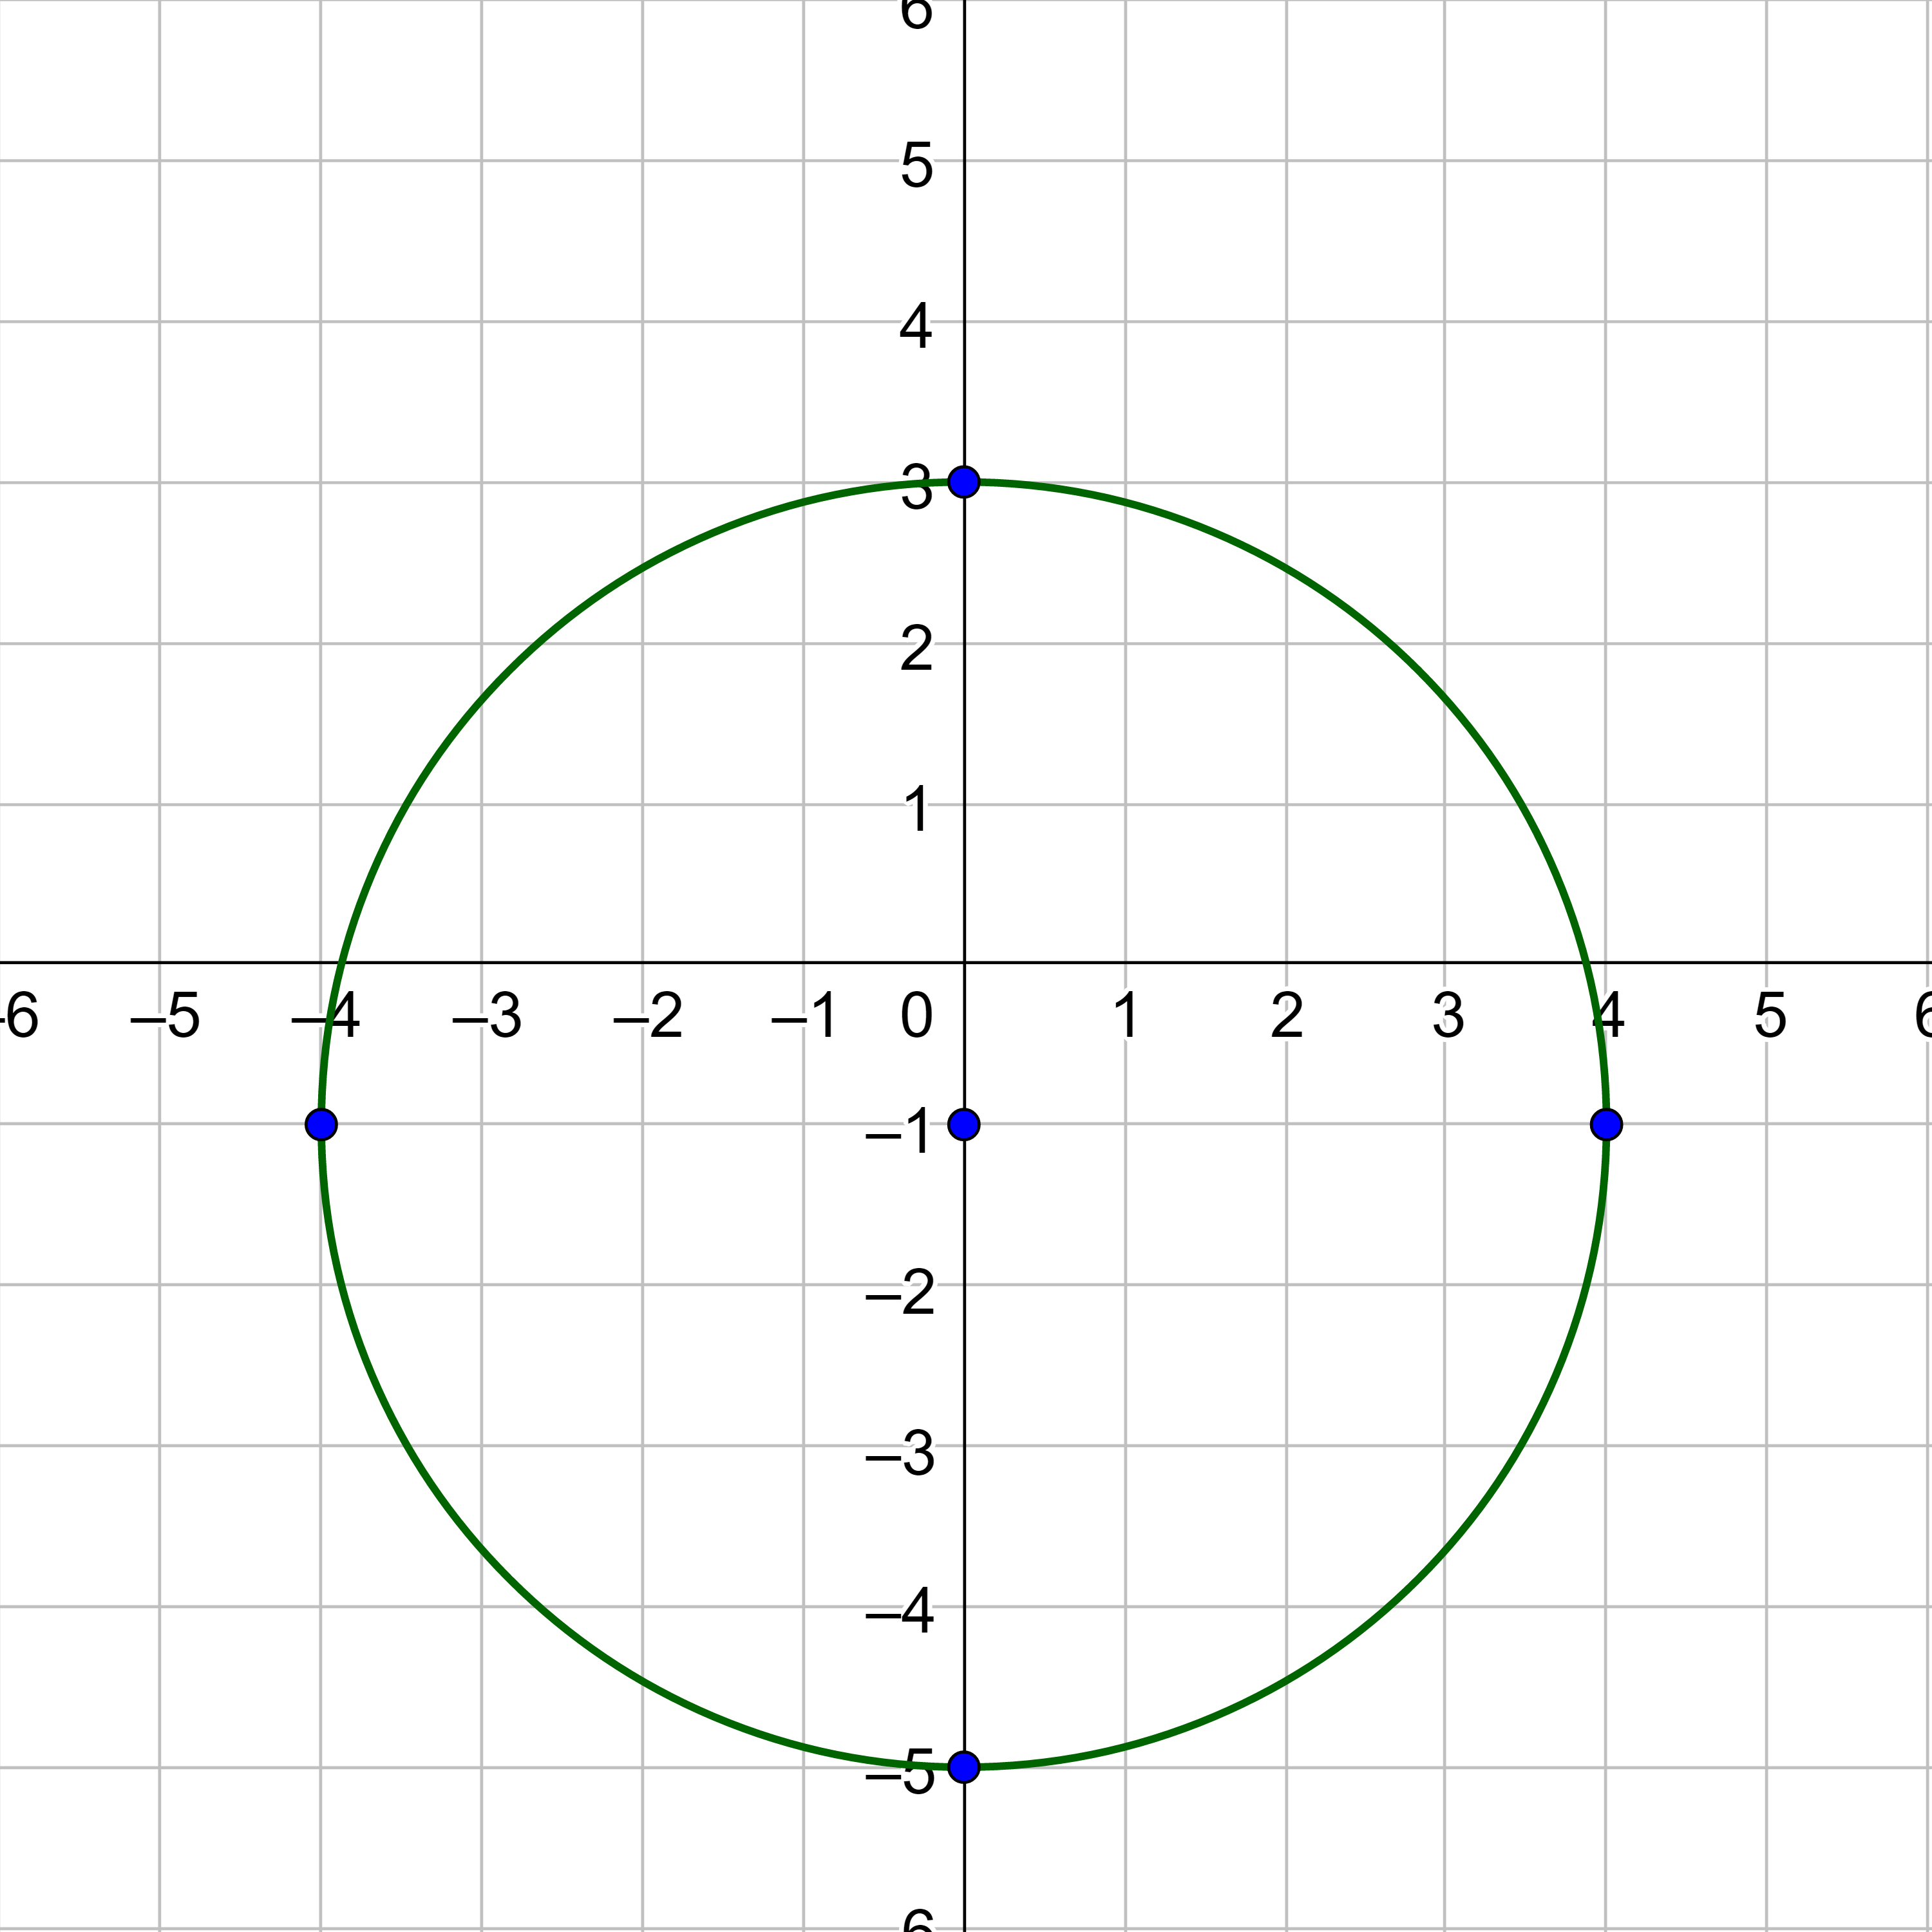
Graph x2 + (y + 1)2 = 16.
Answer
x-intercept:
y-intercept:
$$ (x - h)^2 + (y - k)^2 = r^2 $$
where (h, k) is the center and r is the radius.
Helpful videos about this lesson.