Precalculus by Richard Wright
Has this helped you?
This book is available
in print and ebook.

Precalculus by Richard Wright
Has this helped you?
This book is available
in print and ebook.
For if you forgive other people when they sin against you, your heavenly Father will also forgive you. Matthew 6:14 NIV
Summary: In this section, you will:
SDA NAD Content Standards (2018): PC.4.1

A flat mirror produces an image called a reflection where everything is inverted left to right. If the mirror is tilted, then the image can be shifted horizontally or vertically. If the mirror is bent like the Cloud Gate sculpture in Chicago, then the image can be stretched or shrunk. These are all transformations. Mathematics can cause the parent functions to transform in ways similar to mirrors. This lets the functions describe real world situations better.
Mathematicians can transform a parent function to model a problem scenario given as words, tables, graphs, or equations. This lesson looks at how to change a parent function into a similar function. These changes are transformations which change a graph's position, orientation, or size. This lesson looks at transformations that change a graph horizontally or vertically. Because the x is the horizontal axis, to transform a graph horizontally, change the x values by addition or multiplication. Likewise, vertical transformations result from changing the y values.
The first type of transformation is a translation. A translation moves a graph horizontally, vertically, or both. In general, if a function is written as
y = f(x)
then horizontal translations are in the form
y = f(x − h)
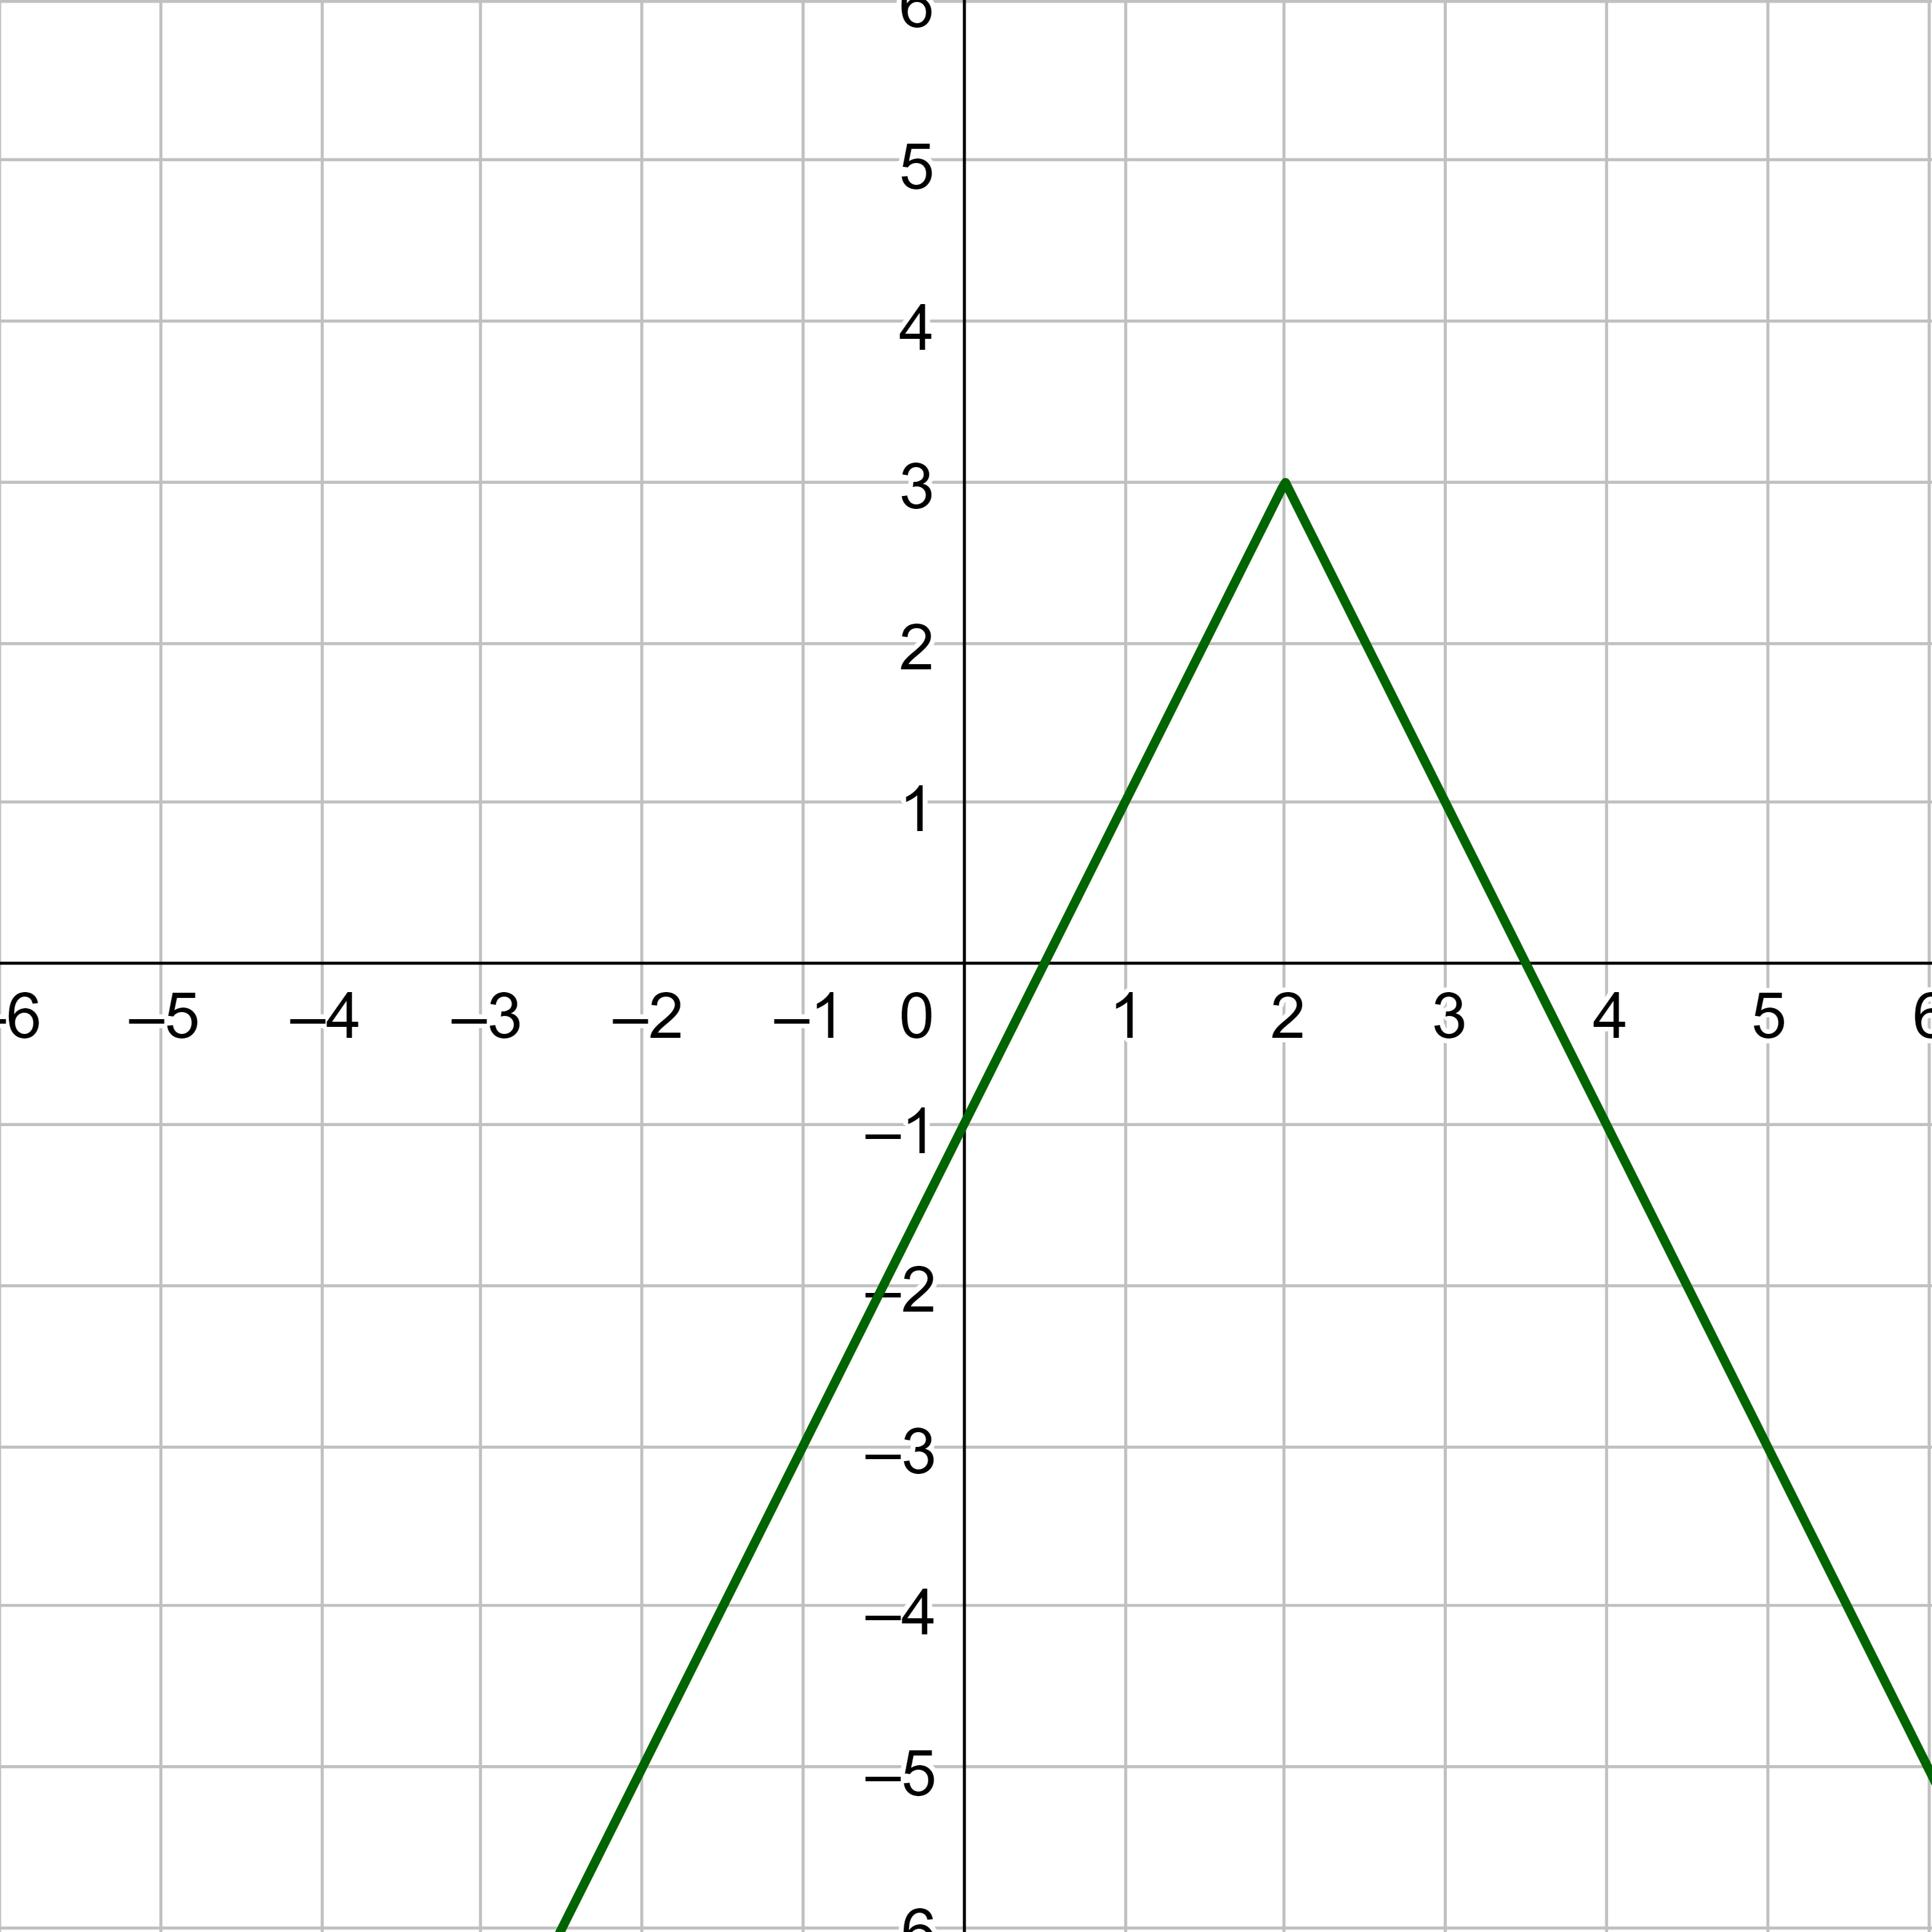
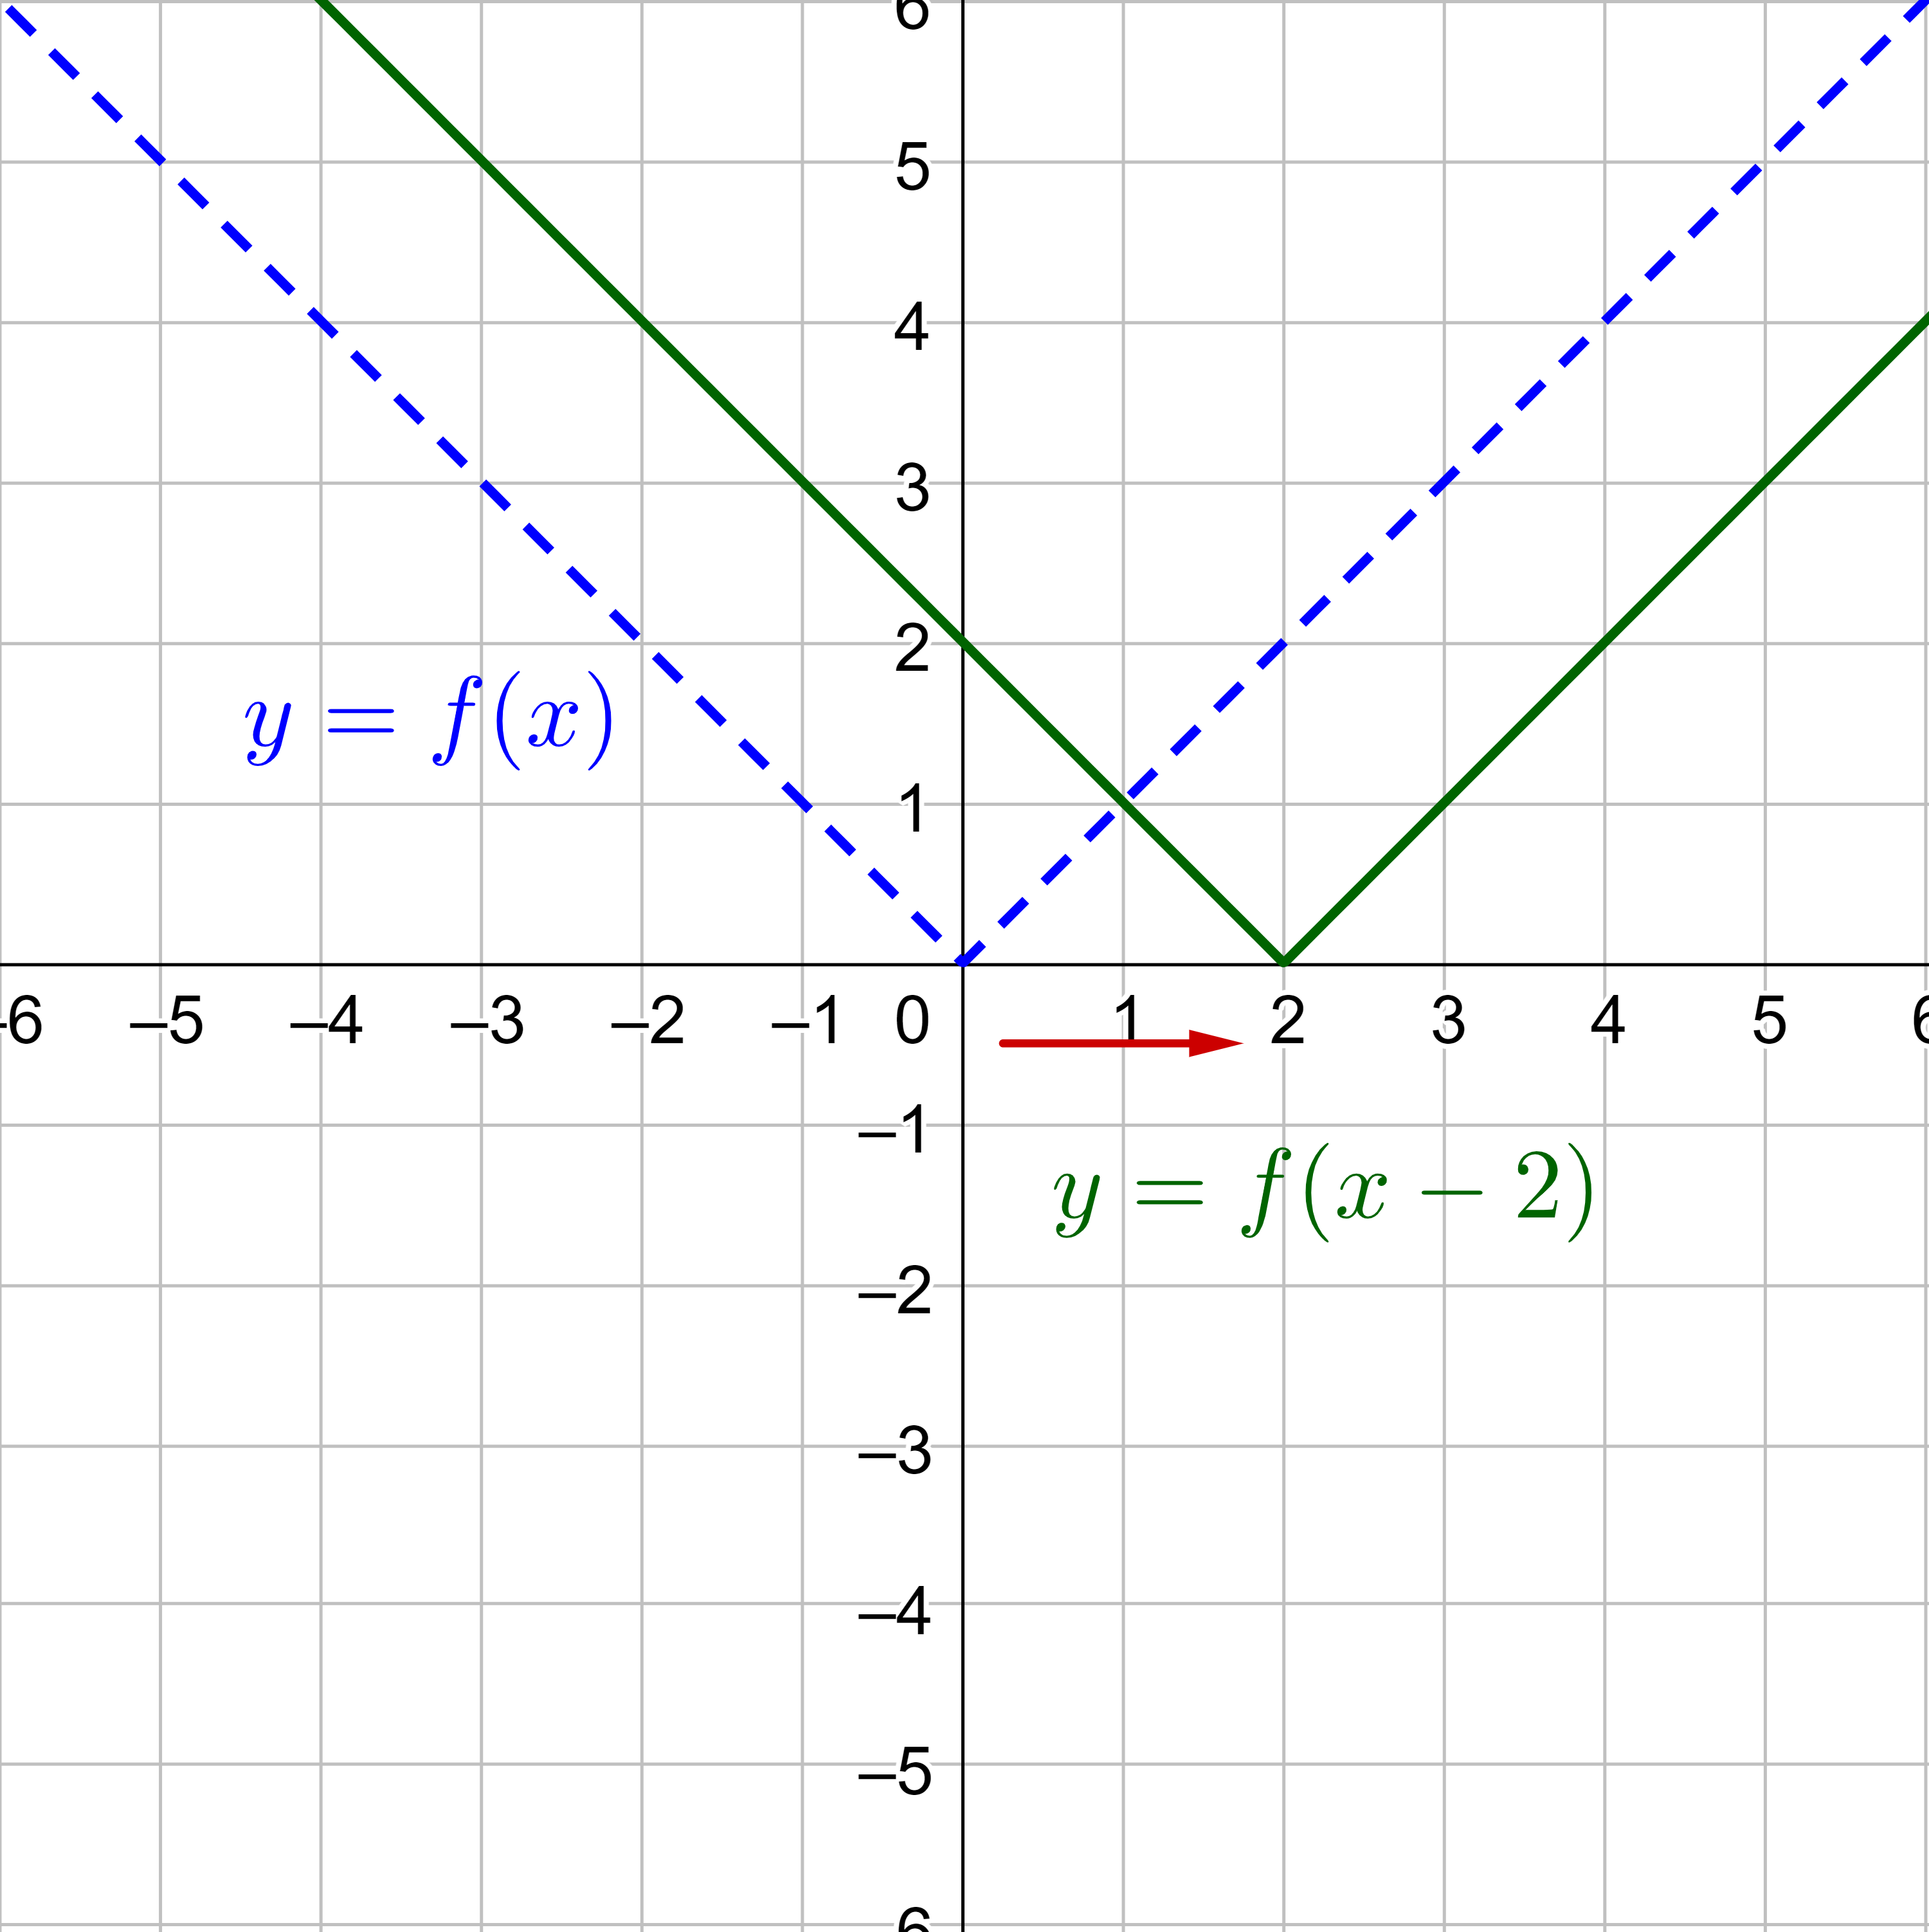
where h is the distance the graph is translated to the right. In figure 2, the function y = |x| is translated right 2 units. The new function would be y = |x − 2|.
Vertical translations are in the form
y = f(x) + k
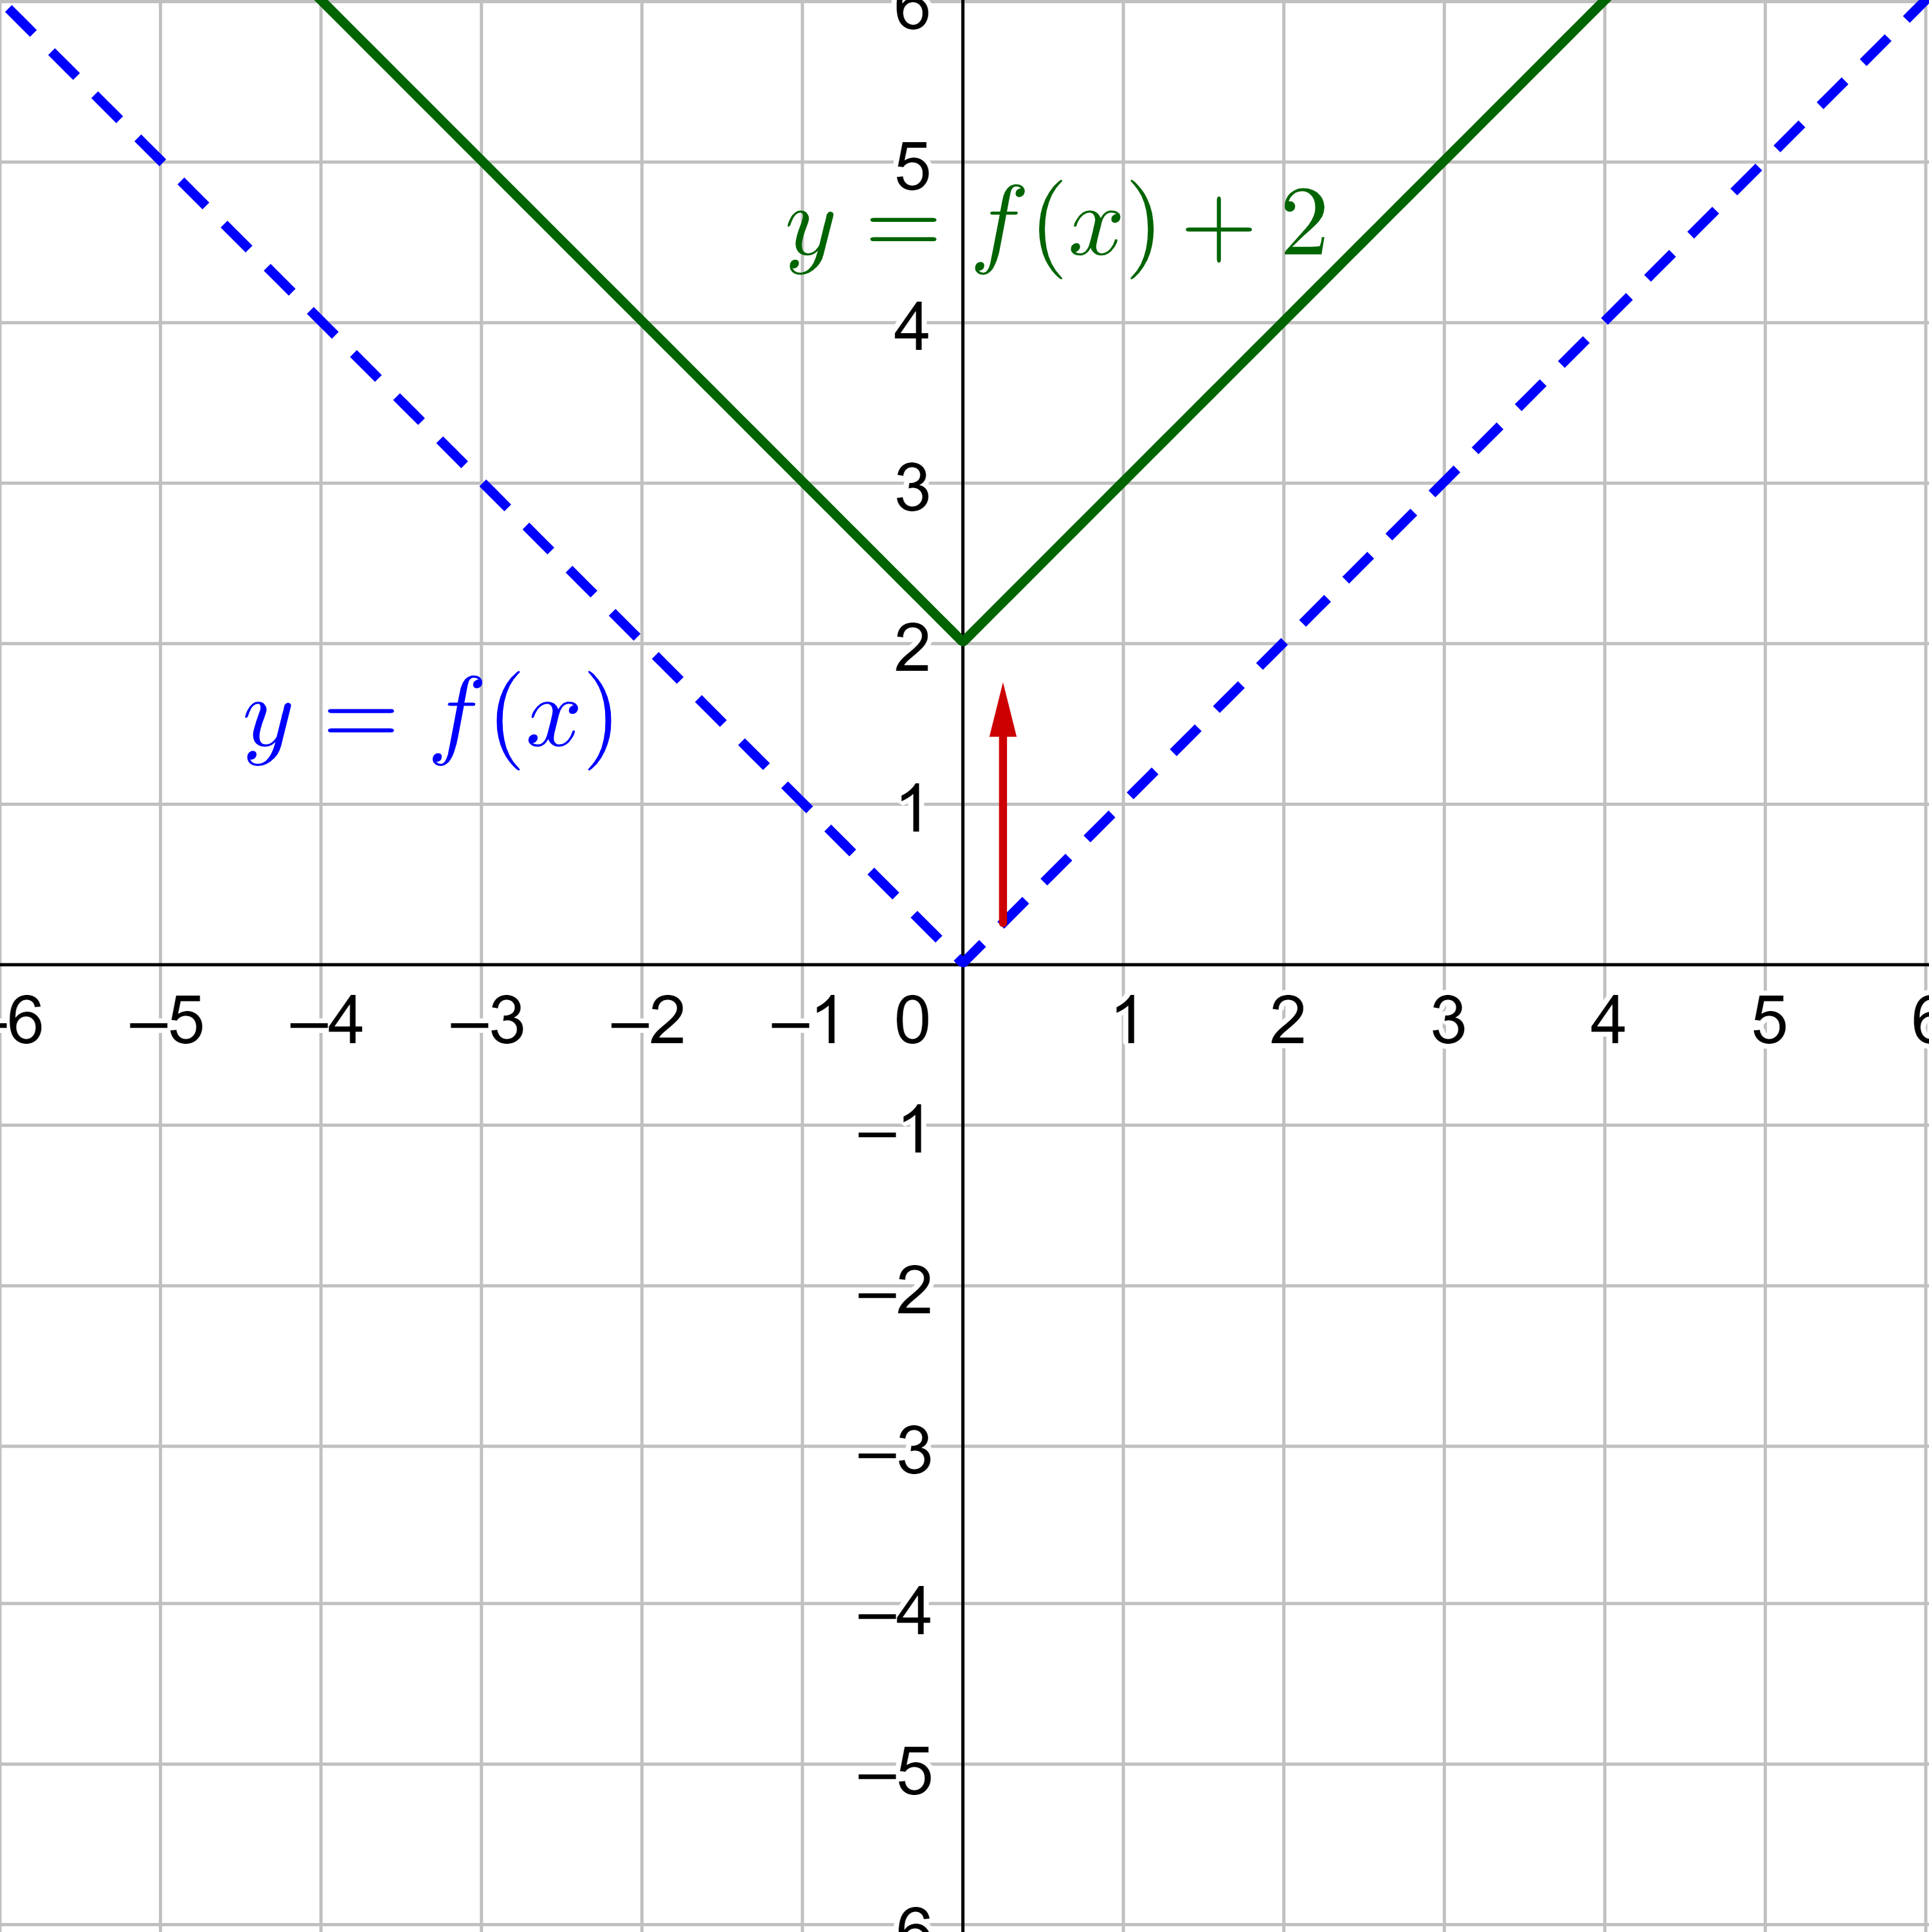
where k is the distance the graph is translated up. In figure 3, the function y = |x| is translated up 2 units. The new function would be y = |x| + 2.
If h is negative, then it translates left, and if k is negative, then it translated down.
Notice that the number h is put inside the function with the x for a horizontal translation so that the x-value changes. The number k is added outside to the entire function for a vertical shift because the function is y (y = f(x)) to change the y-value. If both h and k are present, then the graph translates both horizontally and vertically.
If the function is y = f(x), then translations are in the form
y = f(x − h) + k
where the graph is translated h units right and k units up.
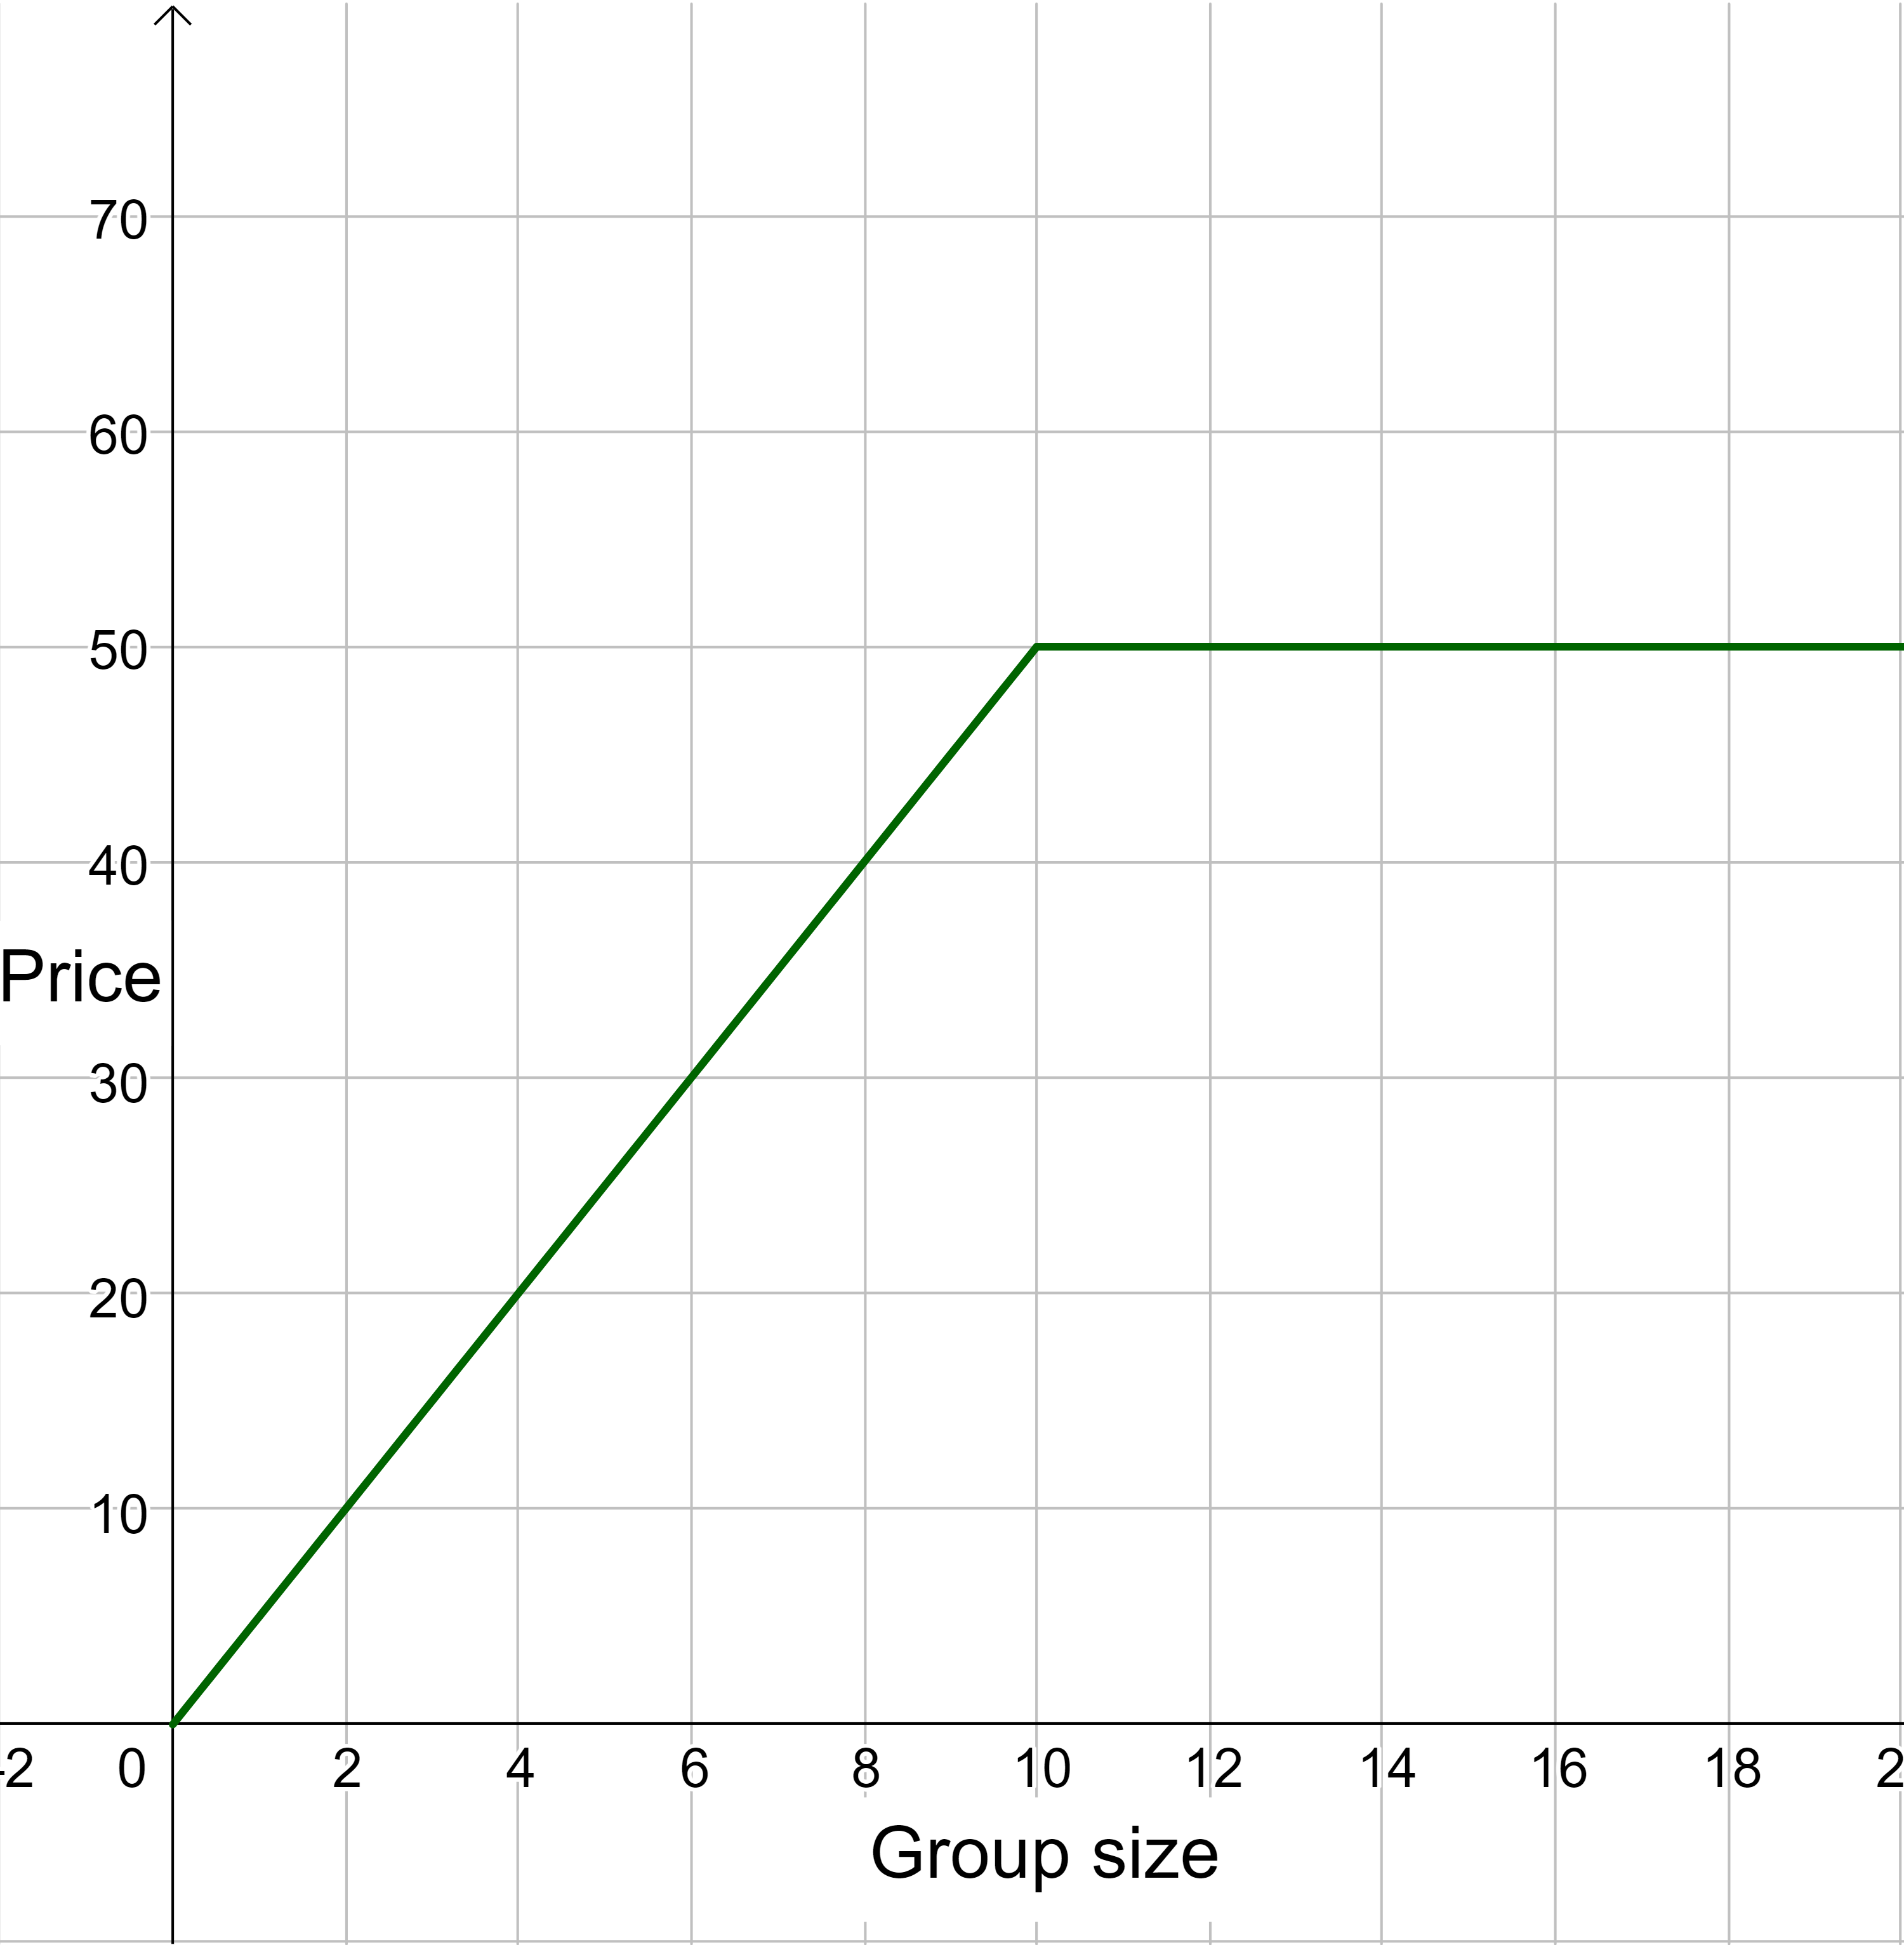
A small swimming pool lets groups rent the pool for $5 a person, but they only charge for the first 10 people. Figure 4 is the graph of the total price for groups. The manager would like to charge more to rent the pool, but people really like the policy of only charging for the first 10 people. So, the manager starts charging a $20 cleaning fee in addition to the rent. Sketch a graph of the new price.
Solution
The graph can be sketched by adding 20 to each of the y-values of the original function. This will cause the graph to translate up 20 units.
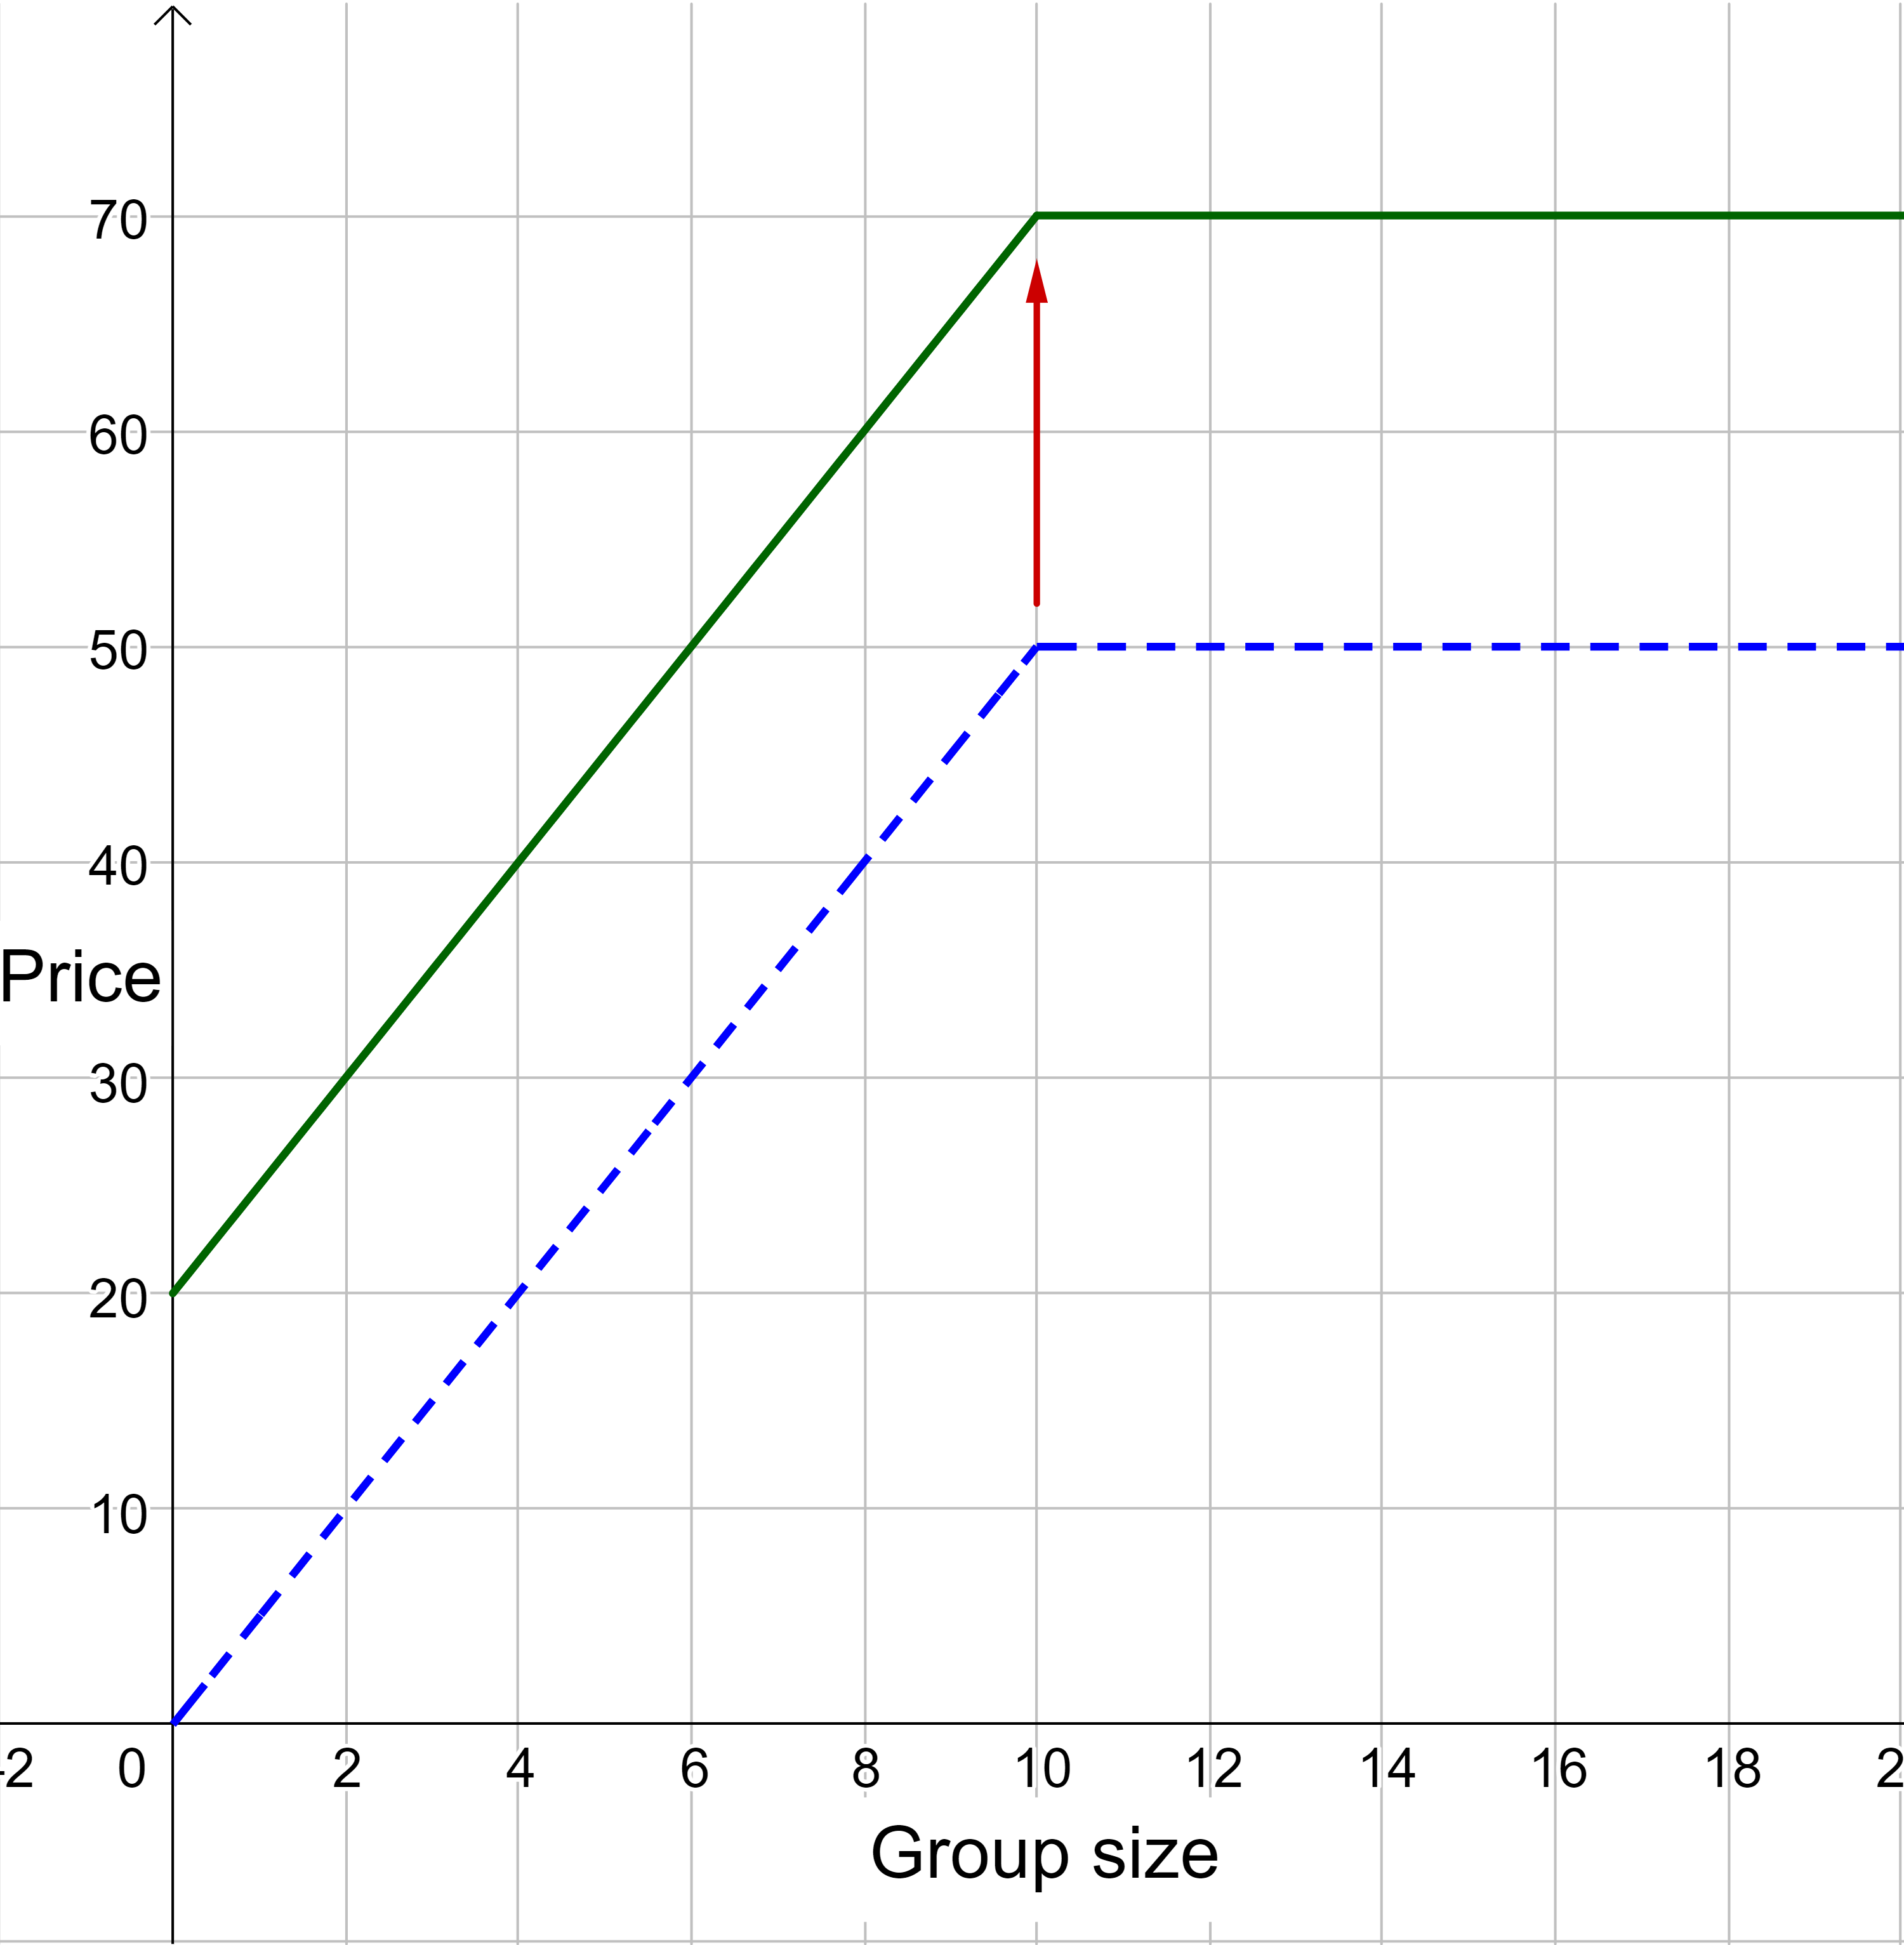
Notice in figure 5, for each input x-value, the output y-value increased by 20. If the old function was y = f(x), then the new function would be y = f(x) + 20. Since the entire function = y, then adding 20 to the function increases the y-values by 20. This is a vertical translation up 20.
| t | 0 | 2 | 4 | 6 | 8 | 10 | 12 | 14 | 16 |
|---|---|---|---|---|---|---|---|---|---|
| f(x) | 0 | 10 | 20 | 30 | 40 | 50 | 50 | 50 | 50 |
| f(x) + 20 | 20 | 30 | 40 | 50 | 60 | 70 | 70 | 70 | 70 |
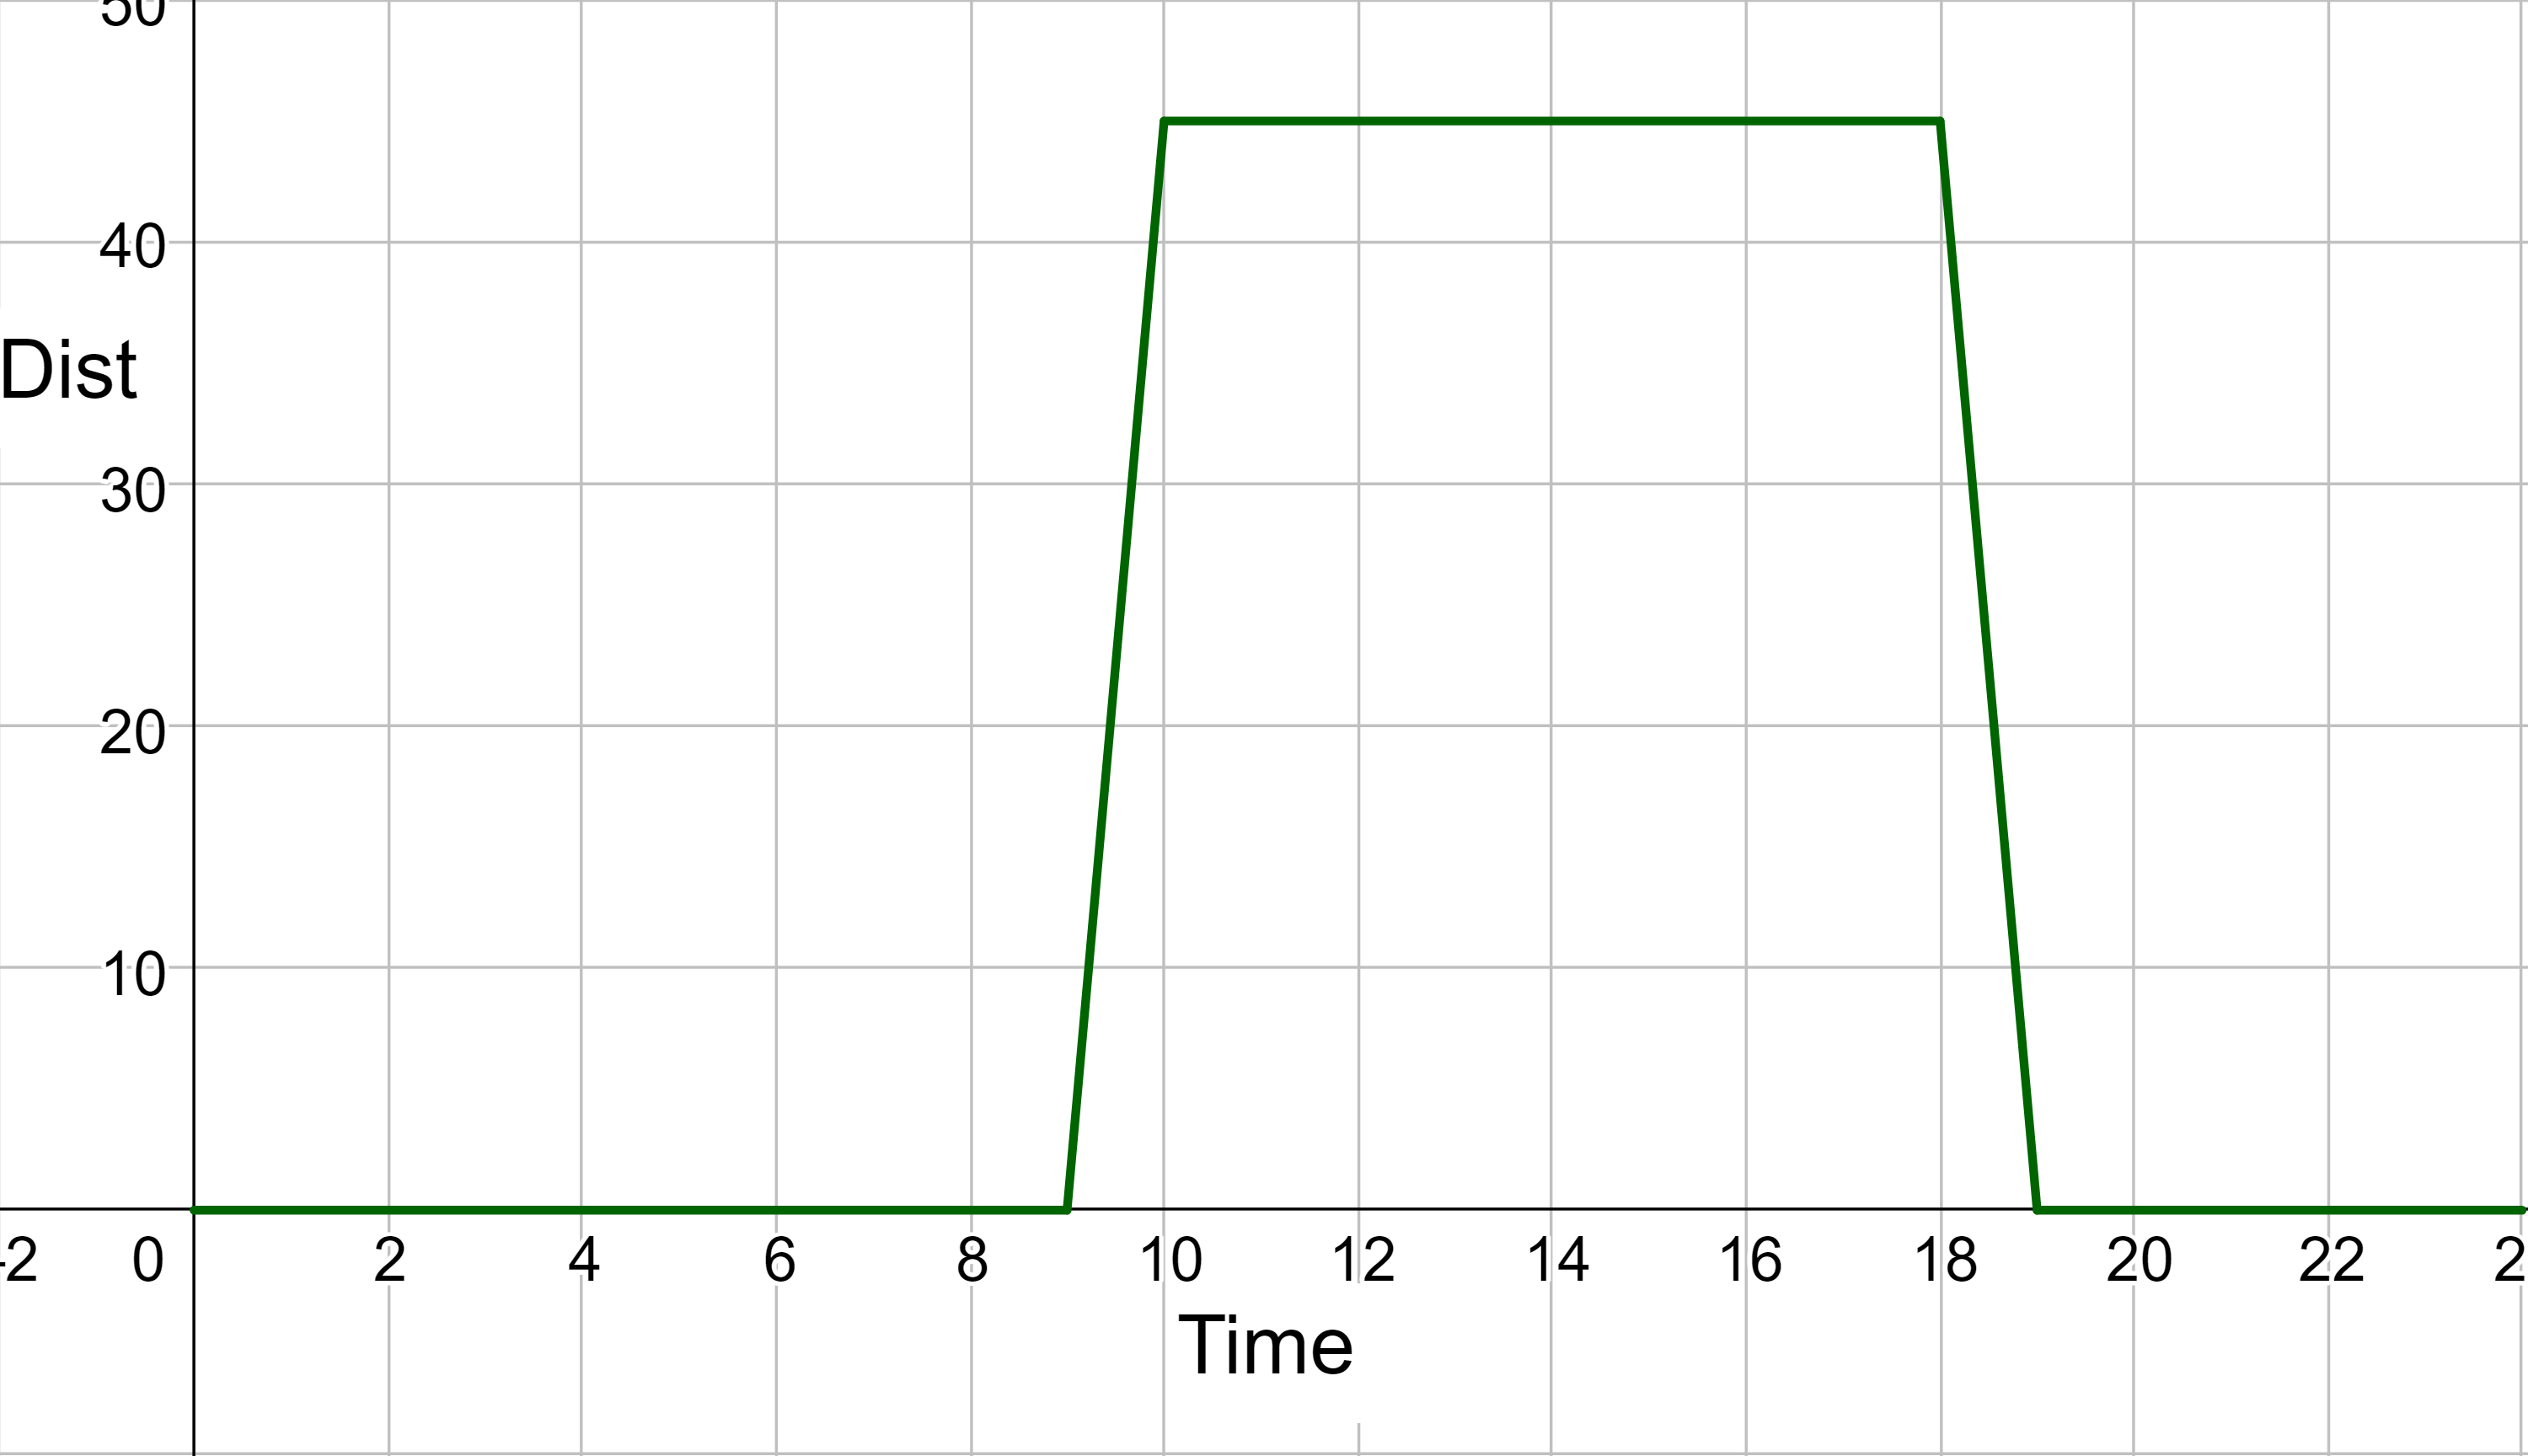
Every day, Jim drives to work and then straight back home. He decided to draw a graph of his distance from home throughout the day. The graph is in figure 6. Next week, his schedule will change, and he will have to arrive at work 2 hours earlier, but he will also get to go home 2 hours earlier at the end of the day. Sketch a graph of the function representing Jim's distance from home during the new schedule.
Solution
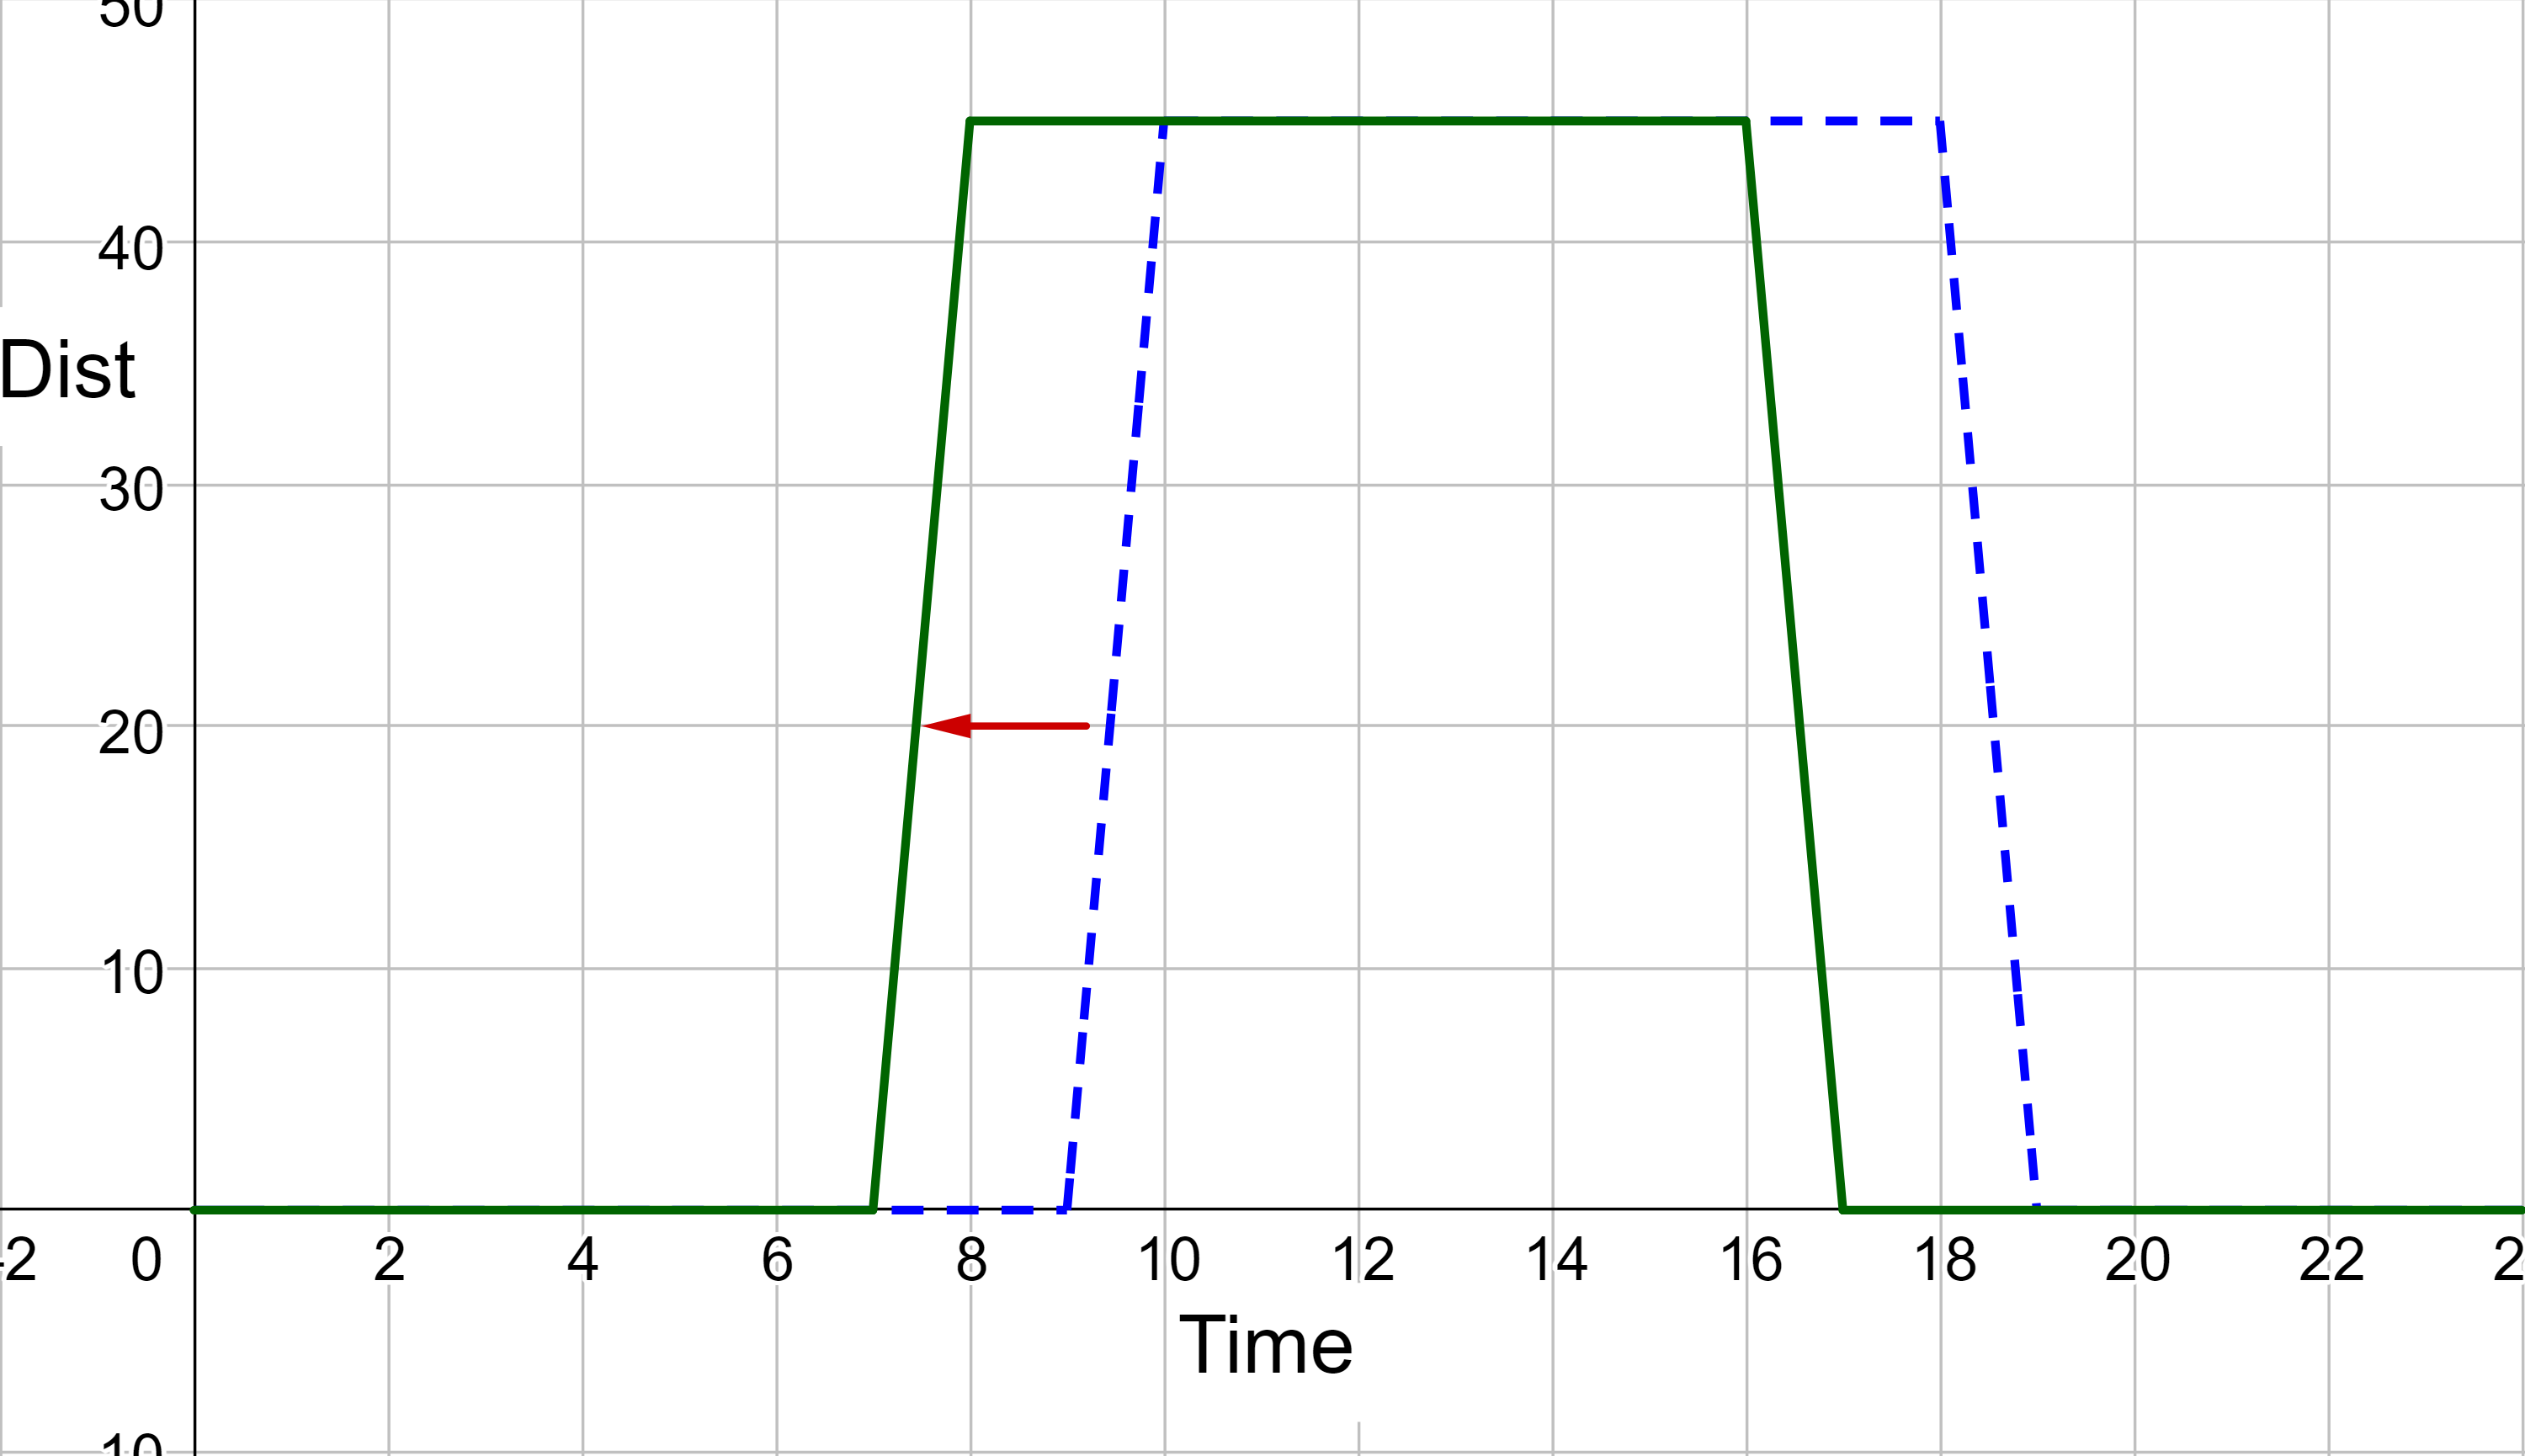
Because he will travel 2 hours earlier, the graph will translate two places to the left. Call the original schedule function old(x) and the new schedule new(x). The input will need to be increased by 2. He was leaving at 9 AM, now he is leaving at 7 AM. So the leaving distance is 0 = old(9) originally. Now the leaving distance is 0 = new(7). Since these are both the same leaving distance, then they are equal. old(9) = new(7), thus we have to add 2 to the input of new to make it equal old. If the old function was y = f(x), then the new function will be y = f(x + 2).
Analysis
Note that f(x + 2) has the effect of shifting the graph to the left.
Horizontal changes or “inside changes” affect the domain of a function (the input) instead of the range and often seem counterintuitive. The new function new(x) uses the same outputs as old(t) but matches those outputs to inputs 2 hours earlier than those of old(x). Said another way, we must add 2 hours to the input of old to find the corresponding output for new: new(x) = old(x + 2).
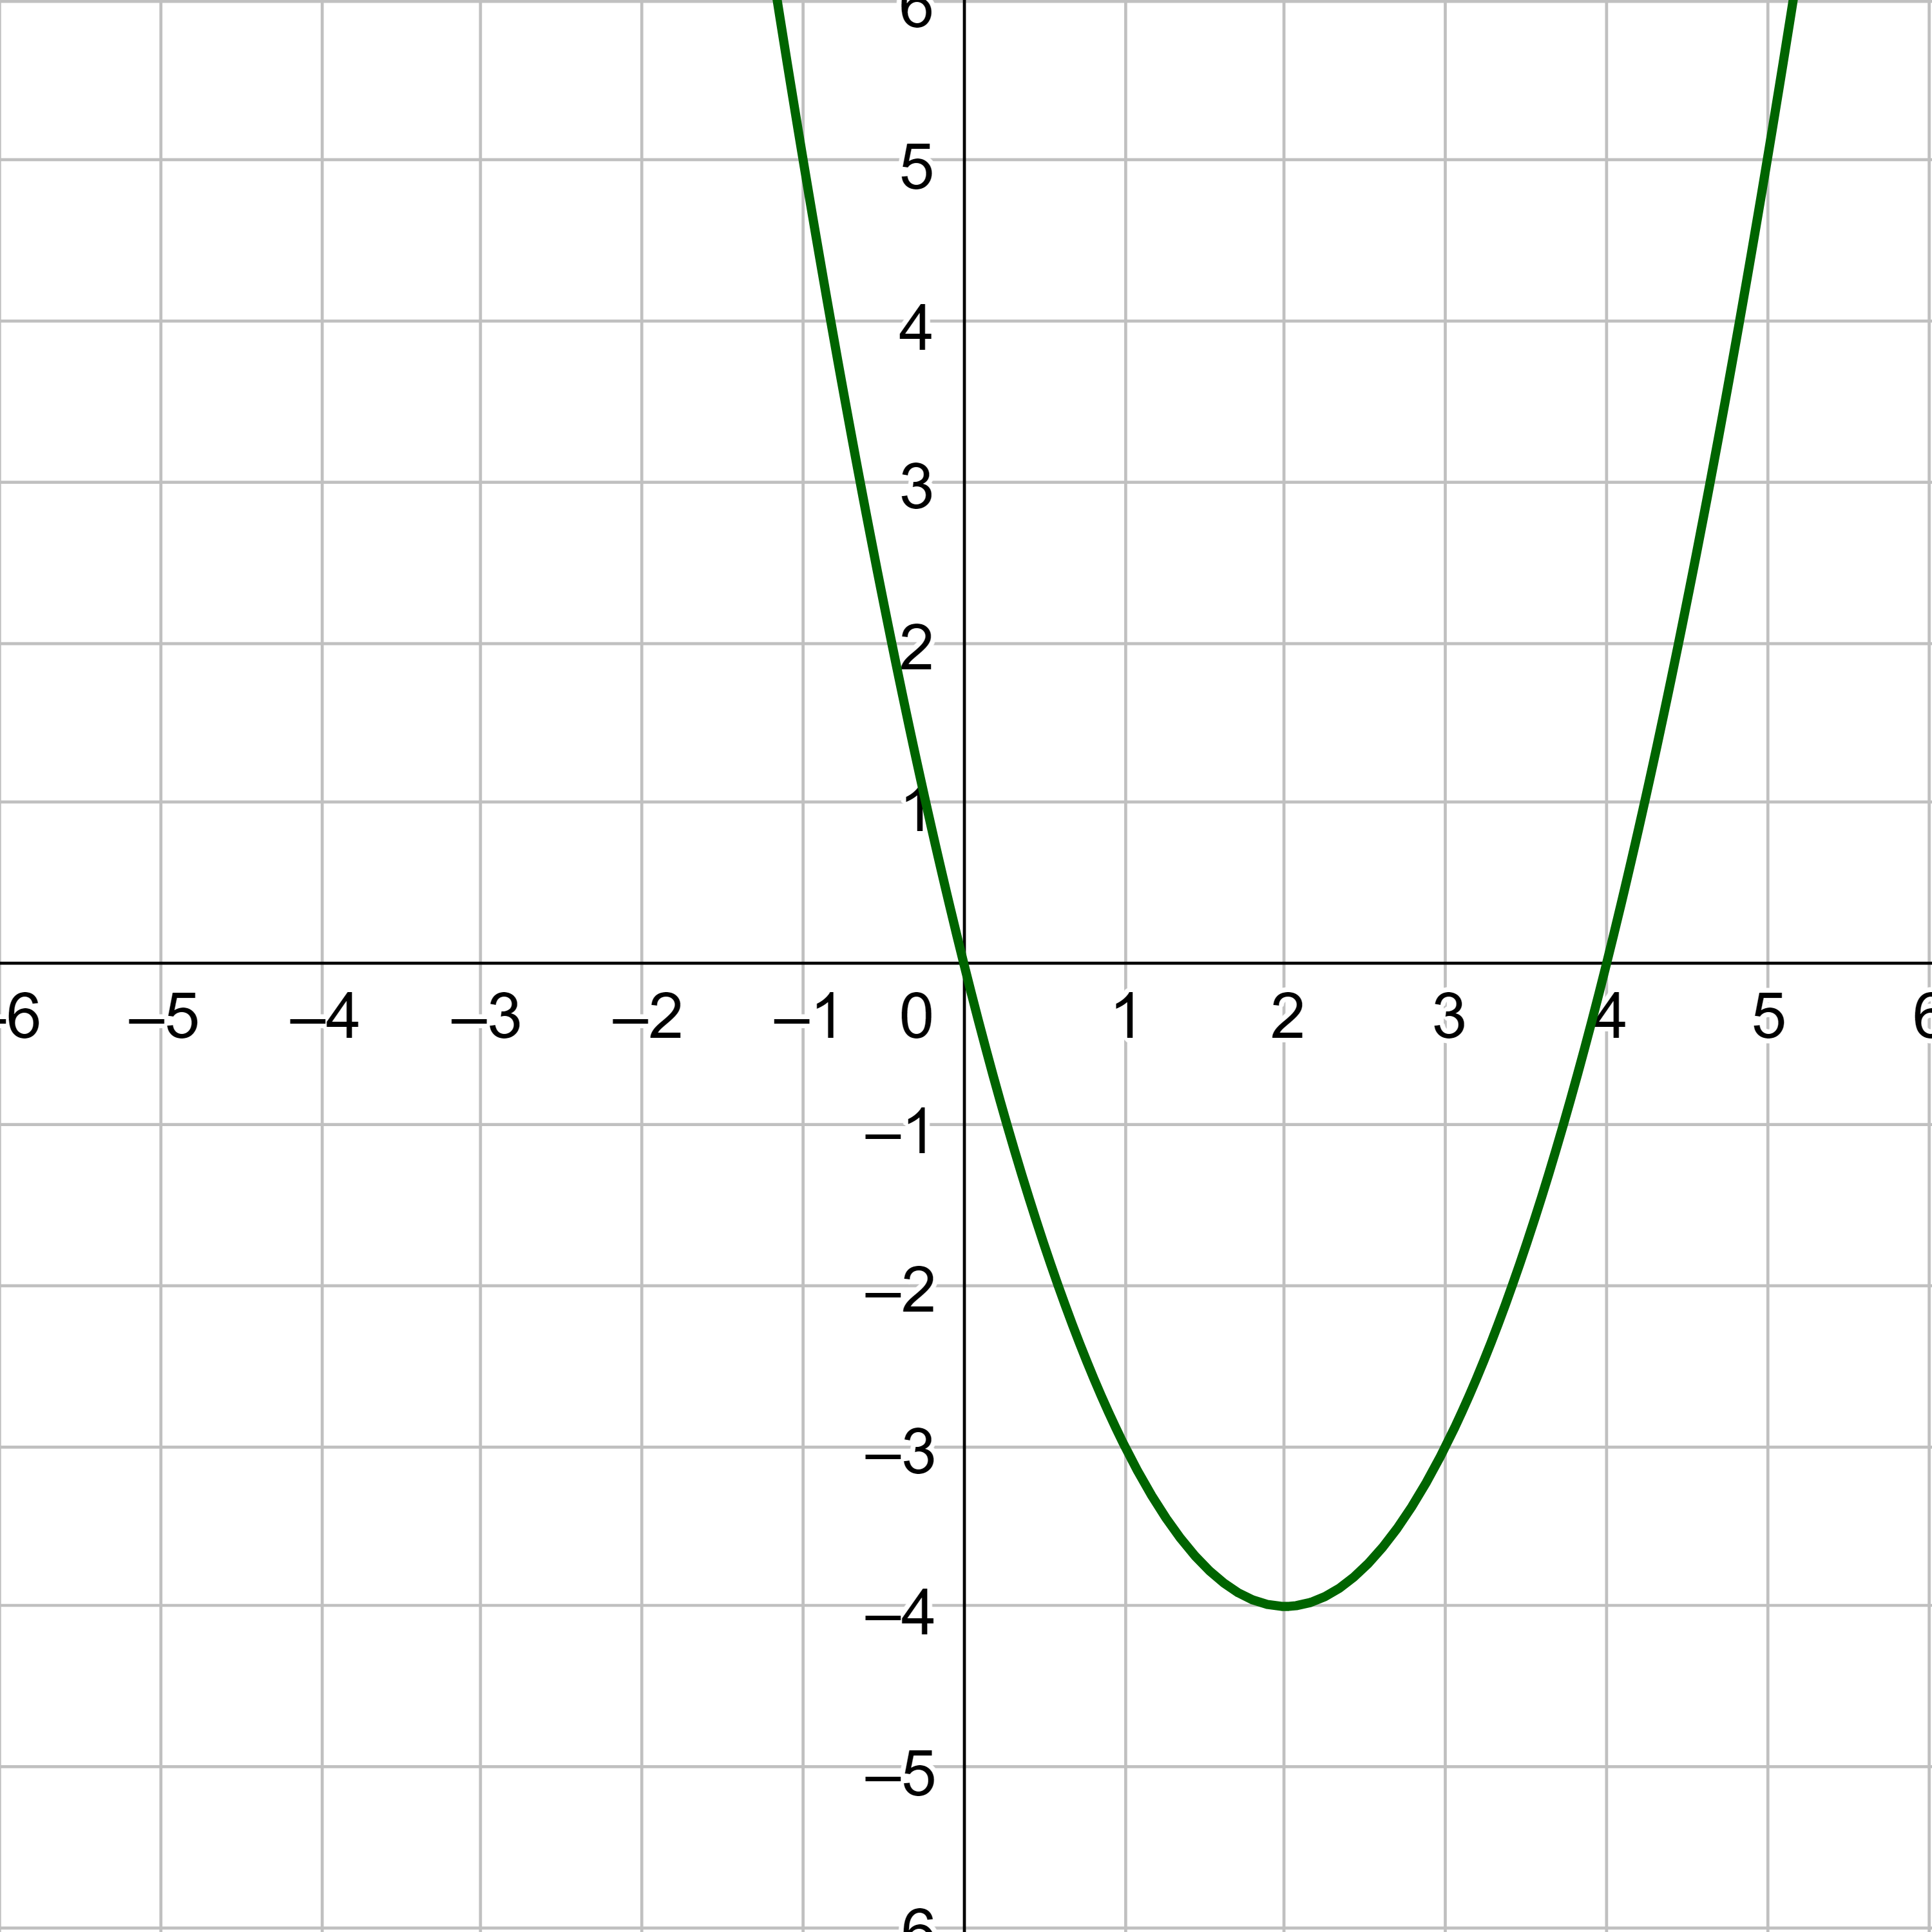
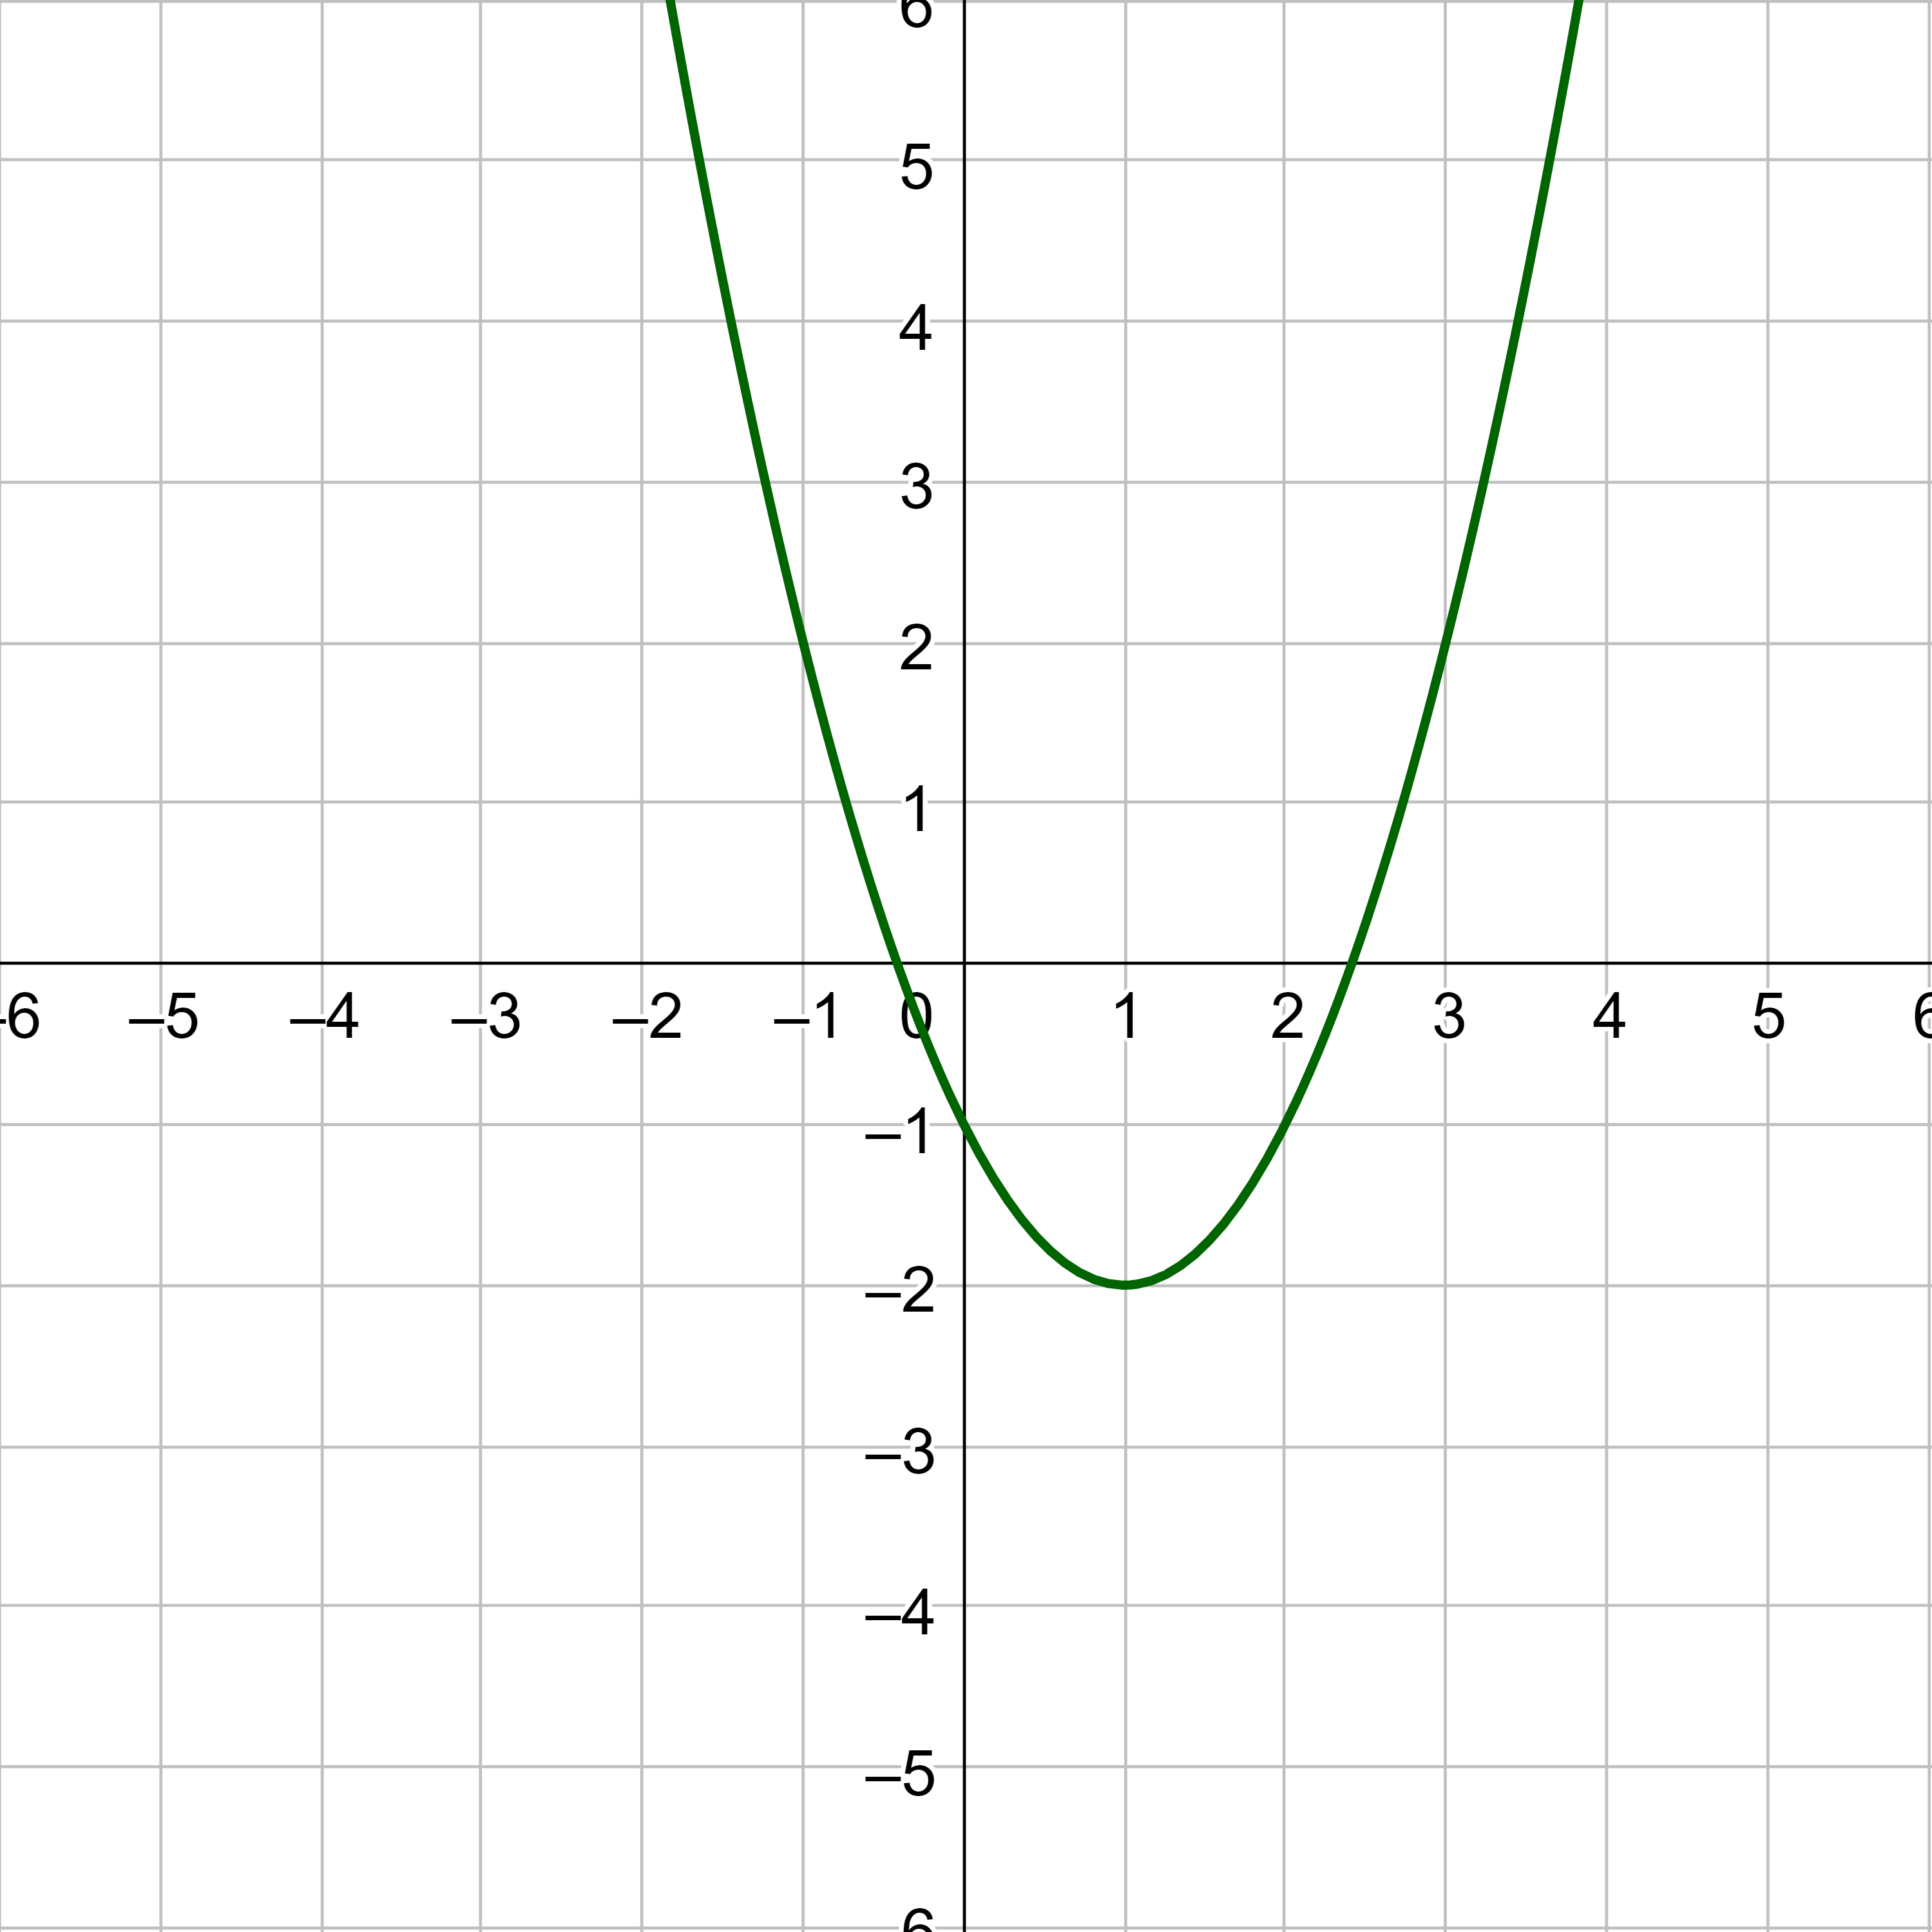
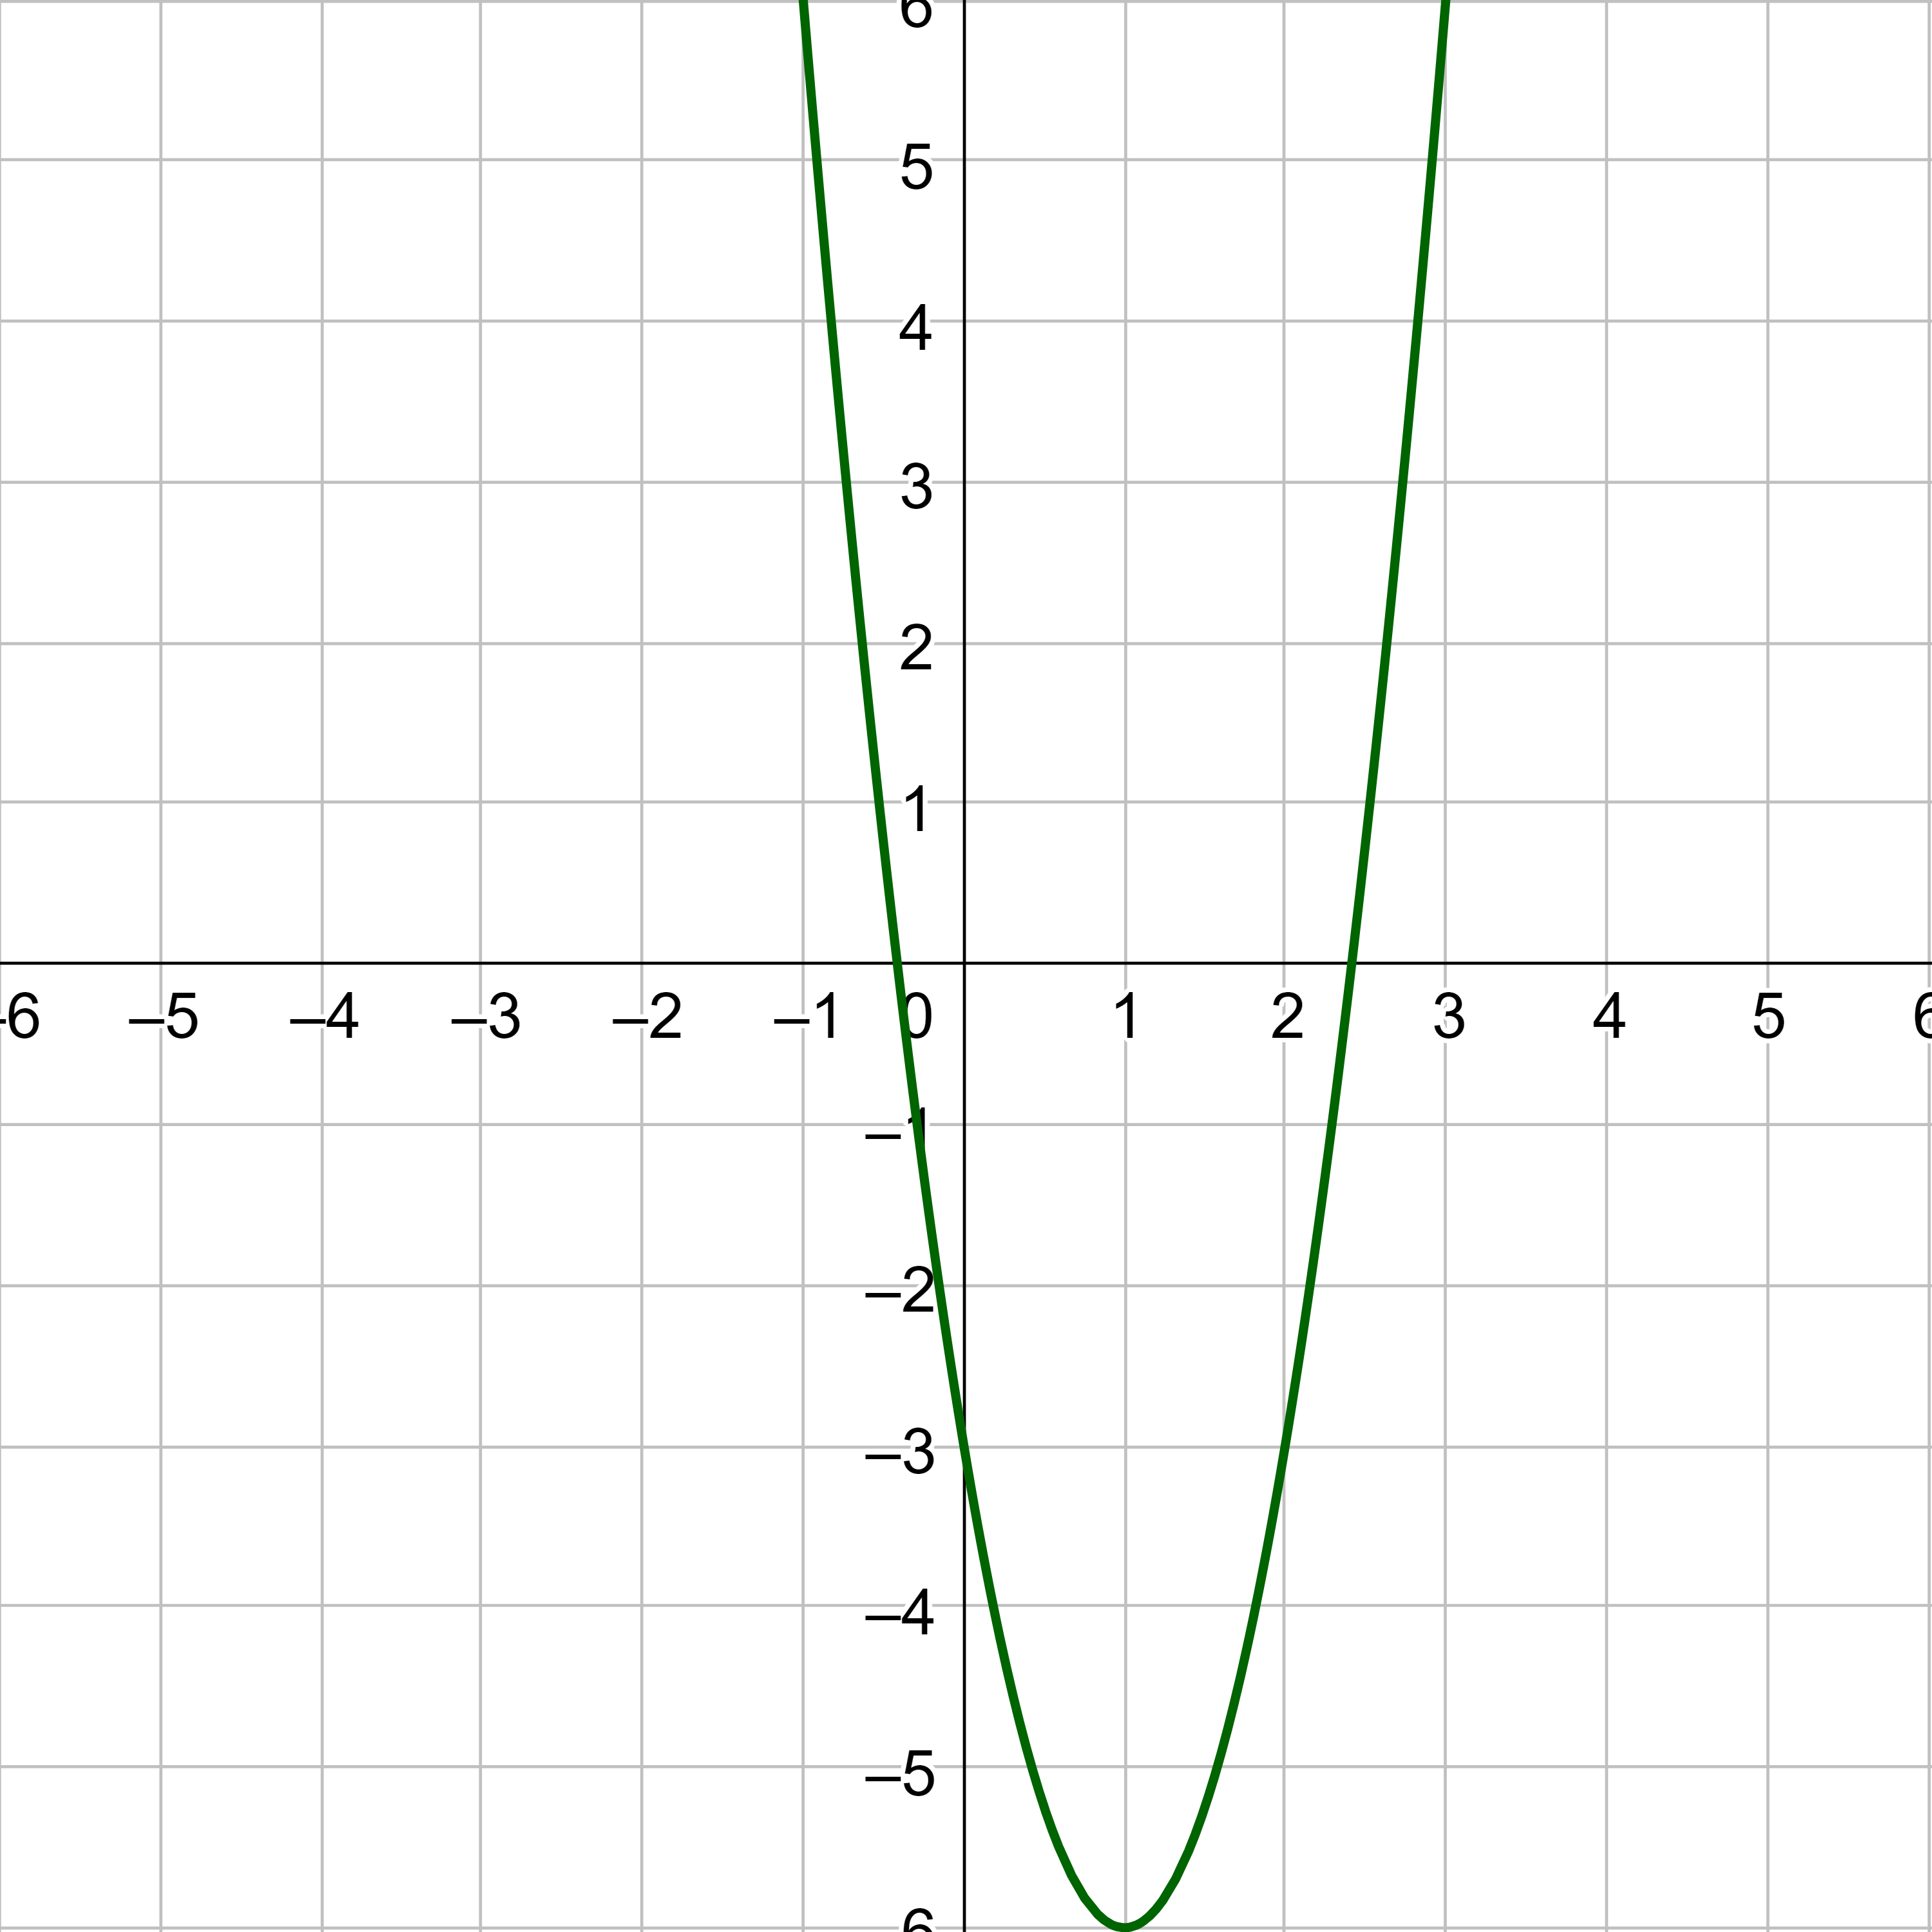
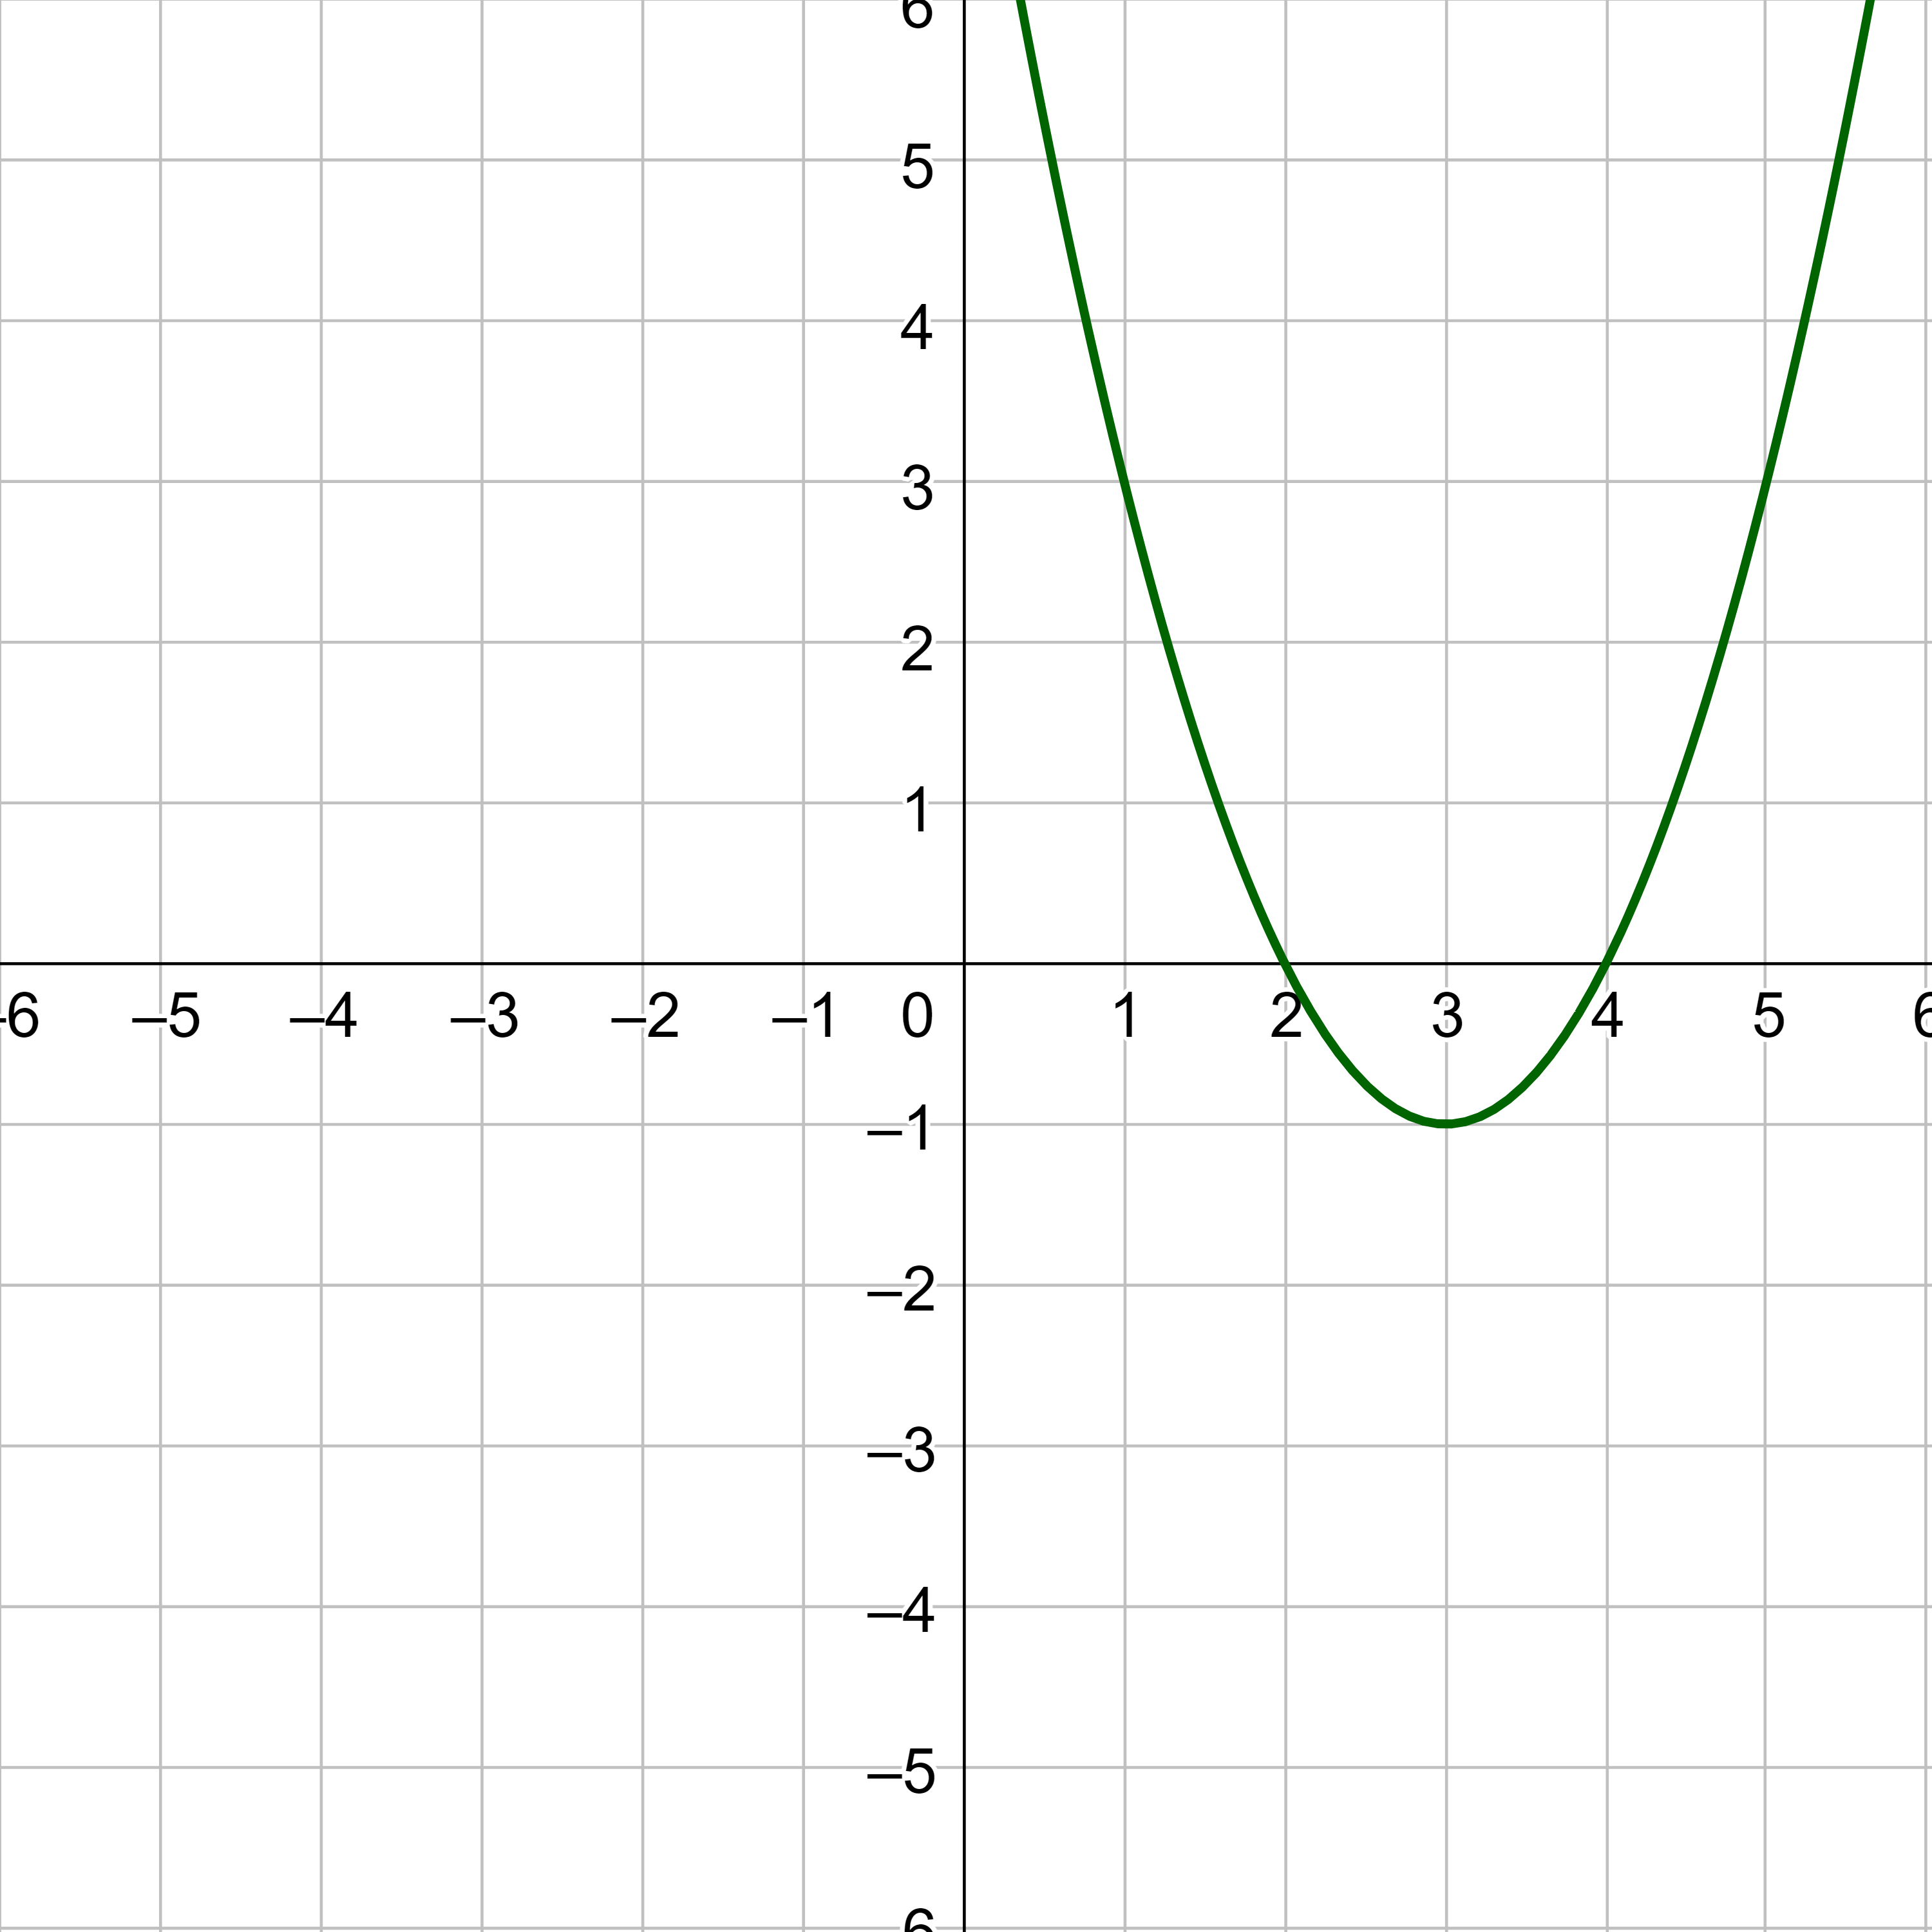
Figure 8 represents a transformation of the parent function f(x) = x2. Relate this new function g(x) to f(x), and then find a formula for g(x).
Solution
Notice that the graph is identical in shape to the f(x) = x2 function, but it is translated 3 to the right and 1 down. The vertex used to be at (0, 0), but now the vertex is at (3, −1). The graph is the basic quadratic function translated 3 units to the right and 1 down, so g(x) = f(x − 3) − 1. This would become g(x) = (x − 3)2 − 1.
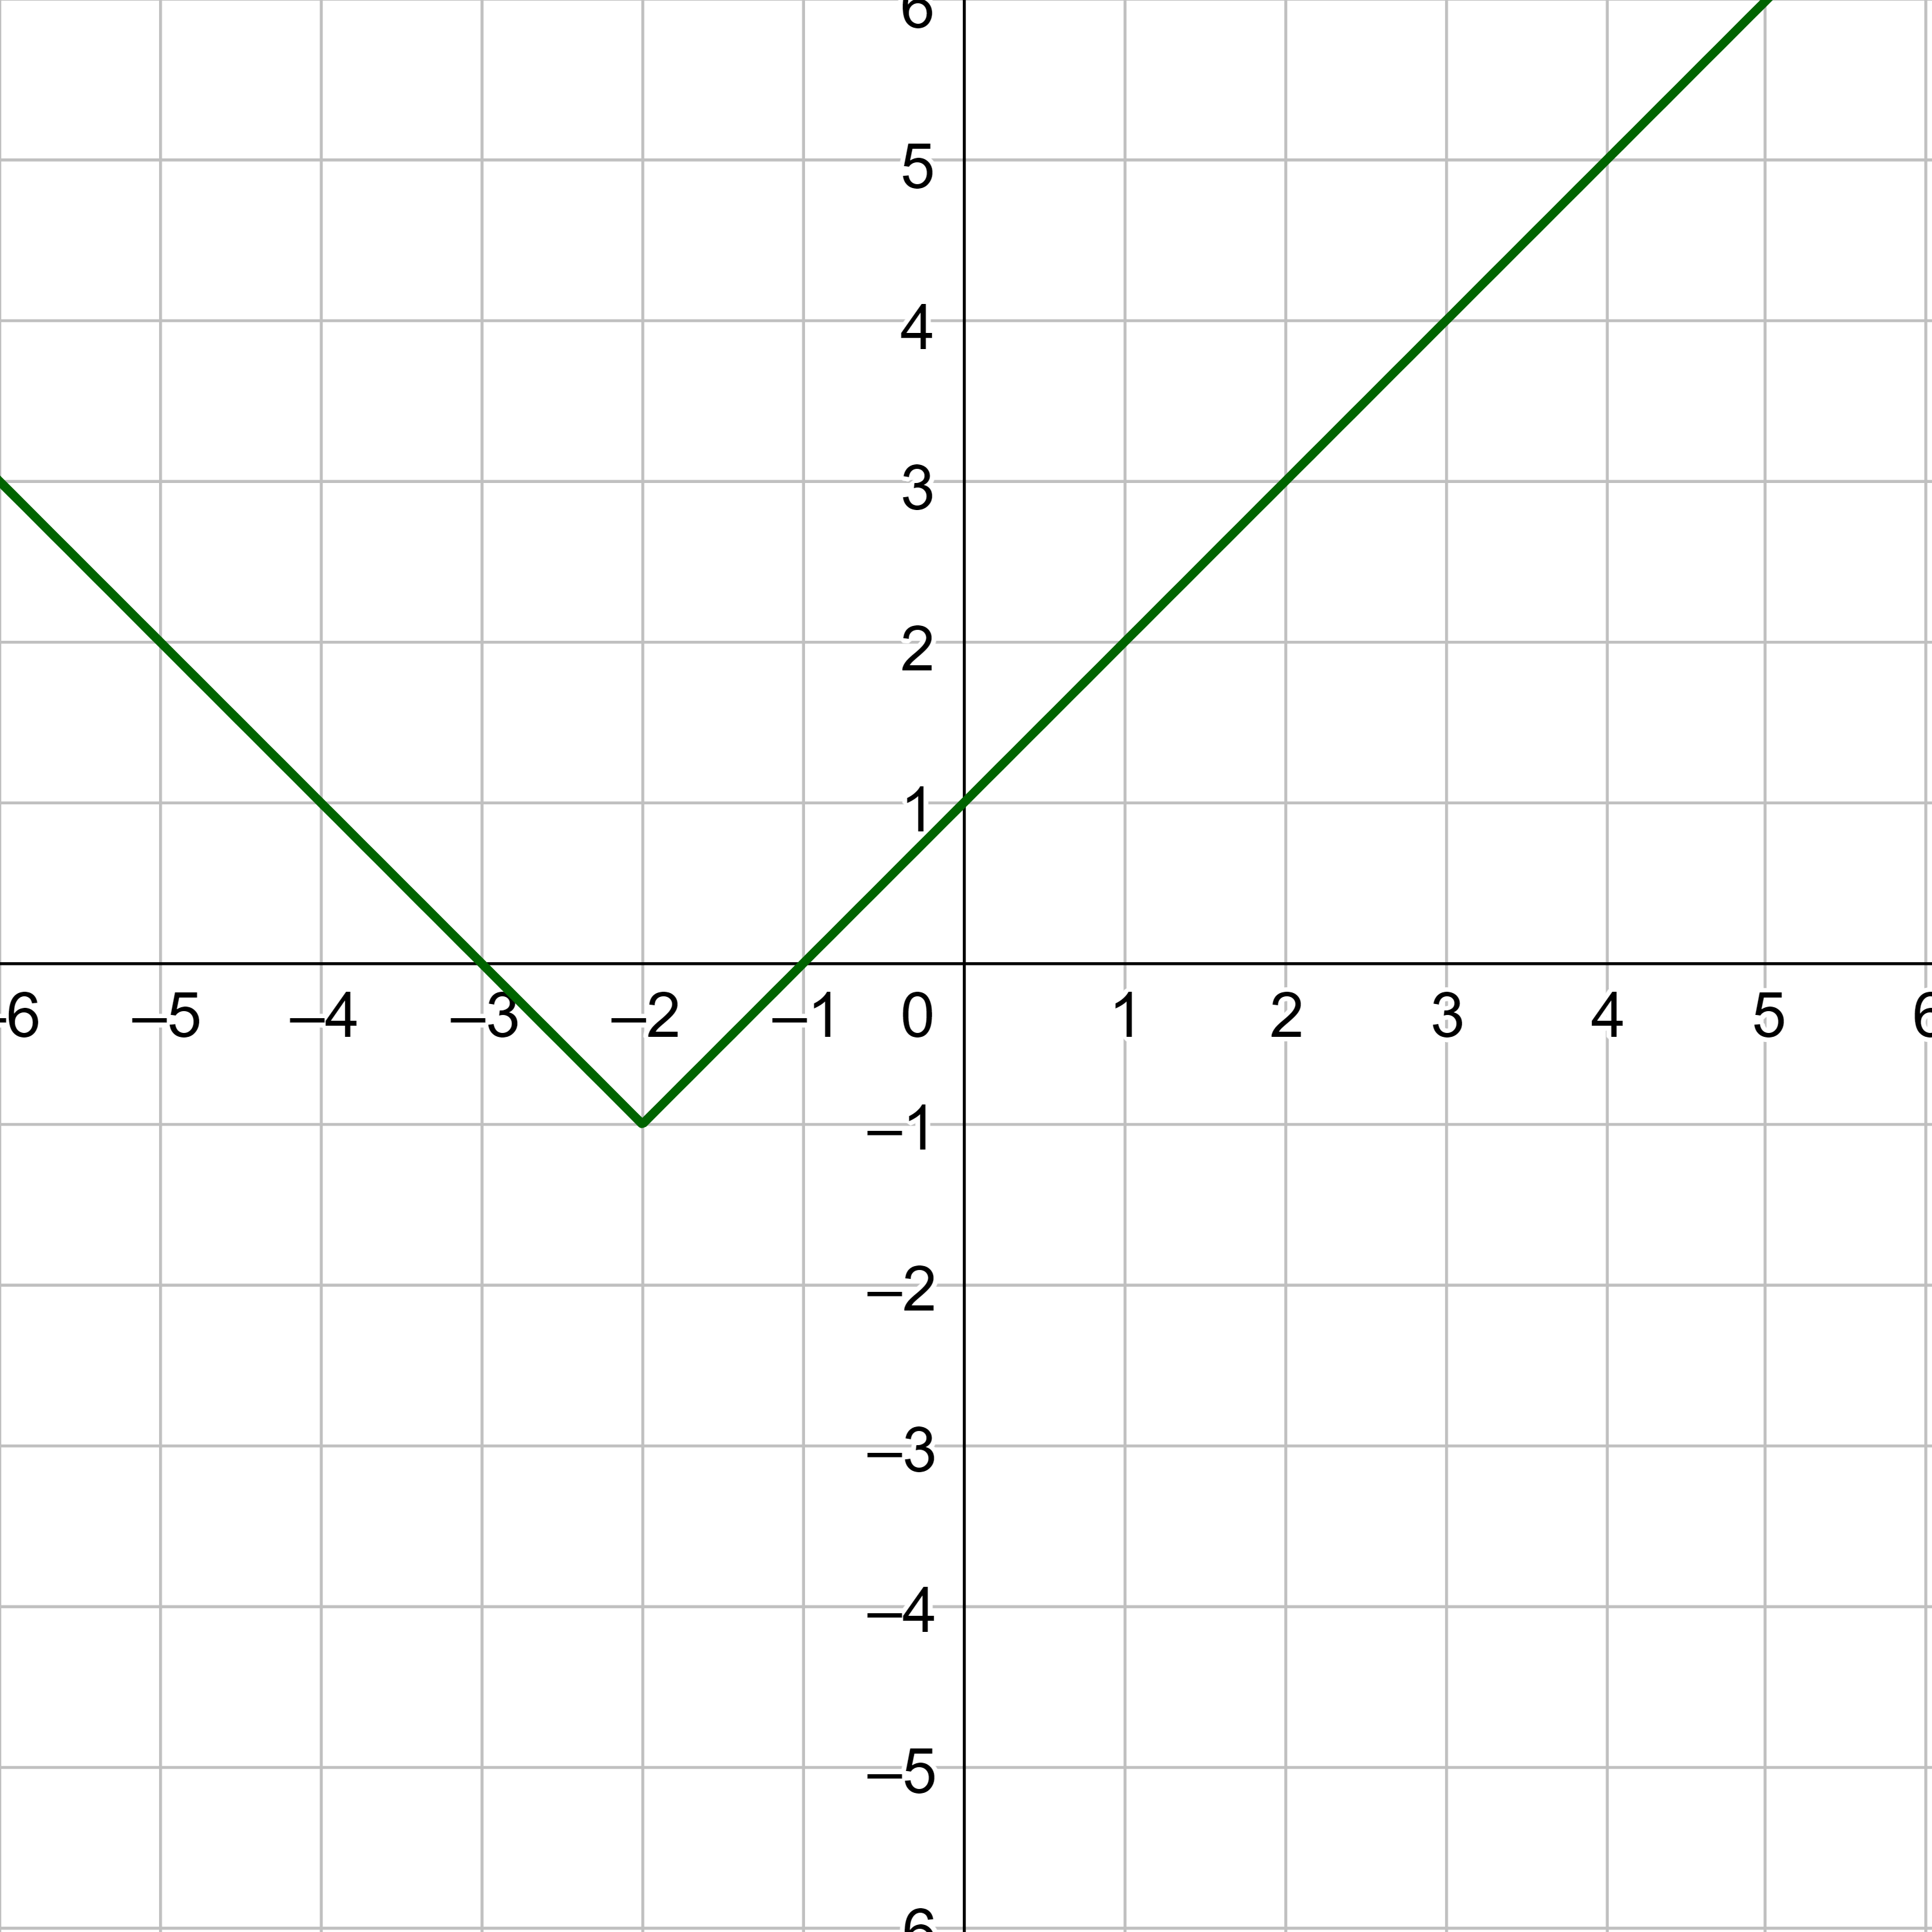
Given f(x) = |x|, sketch a graph of h(x) = f(x + 2) − 1.
Answer
Write an equation for a transformation of the parent reciprocal function \(f(x) = \frac{1}{x}\) that translates the function's graph one unit to the right and one unit up.
Answer
\(f(x) = \frac{1}{x - 1} + 1\)
The function G(m) gives the number of gallons of gas required to drive m miles. Interpret G(m) + 10 and G(m + 10).
Solution
G(m) + 10 is adding 10 to the output, gallons. This is the gas required to drive m miles, plus another 10 gallons of gas. The graph would indicate a vertical shift.
G(m + 10) is adding 10 to the input, miles. So, this is the number of gallons of gas required to drive 10 miles more than m miles. The graph would indicate a horizontal shift.
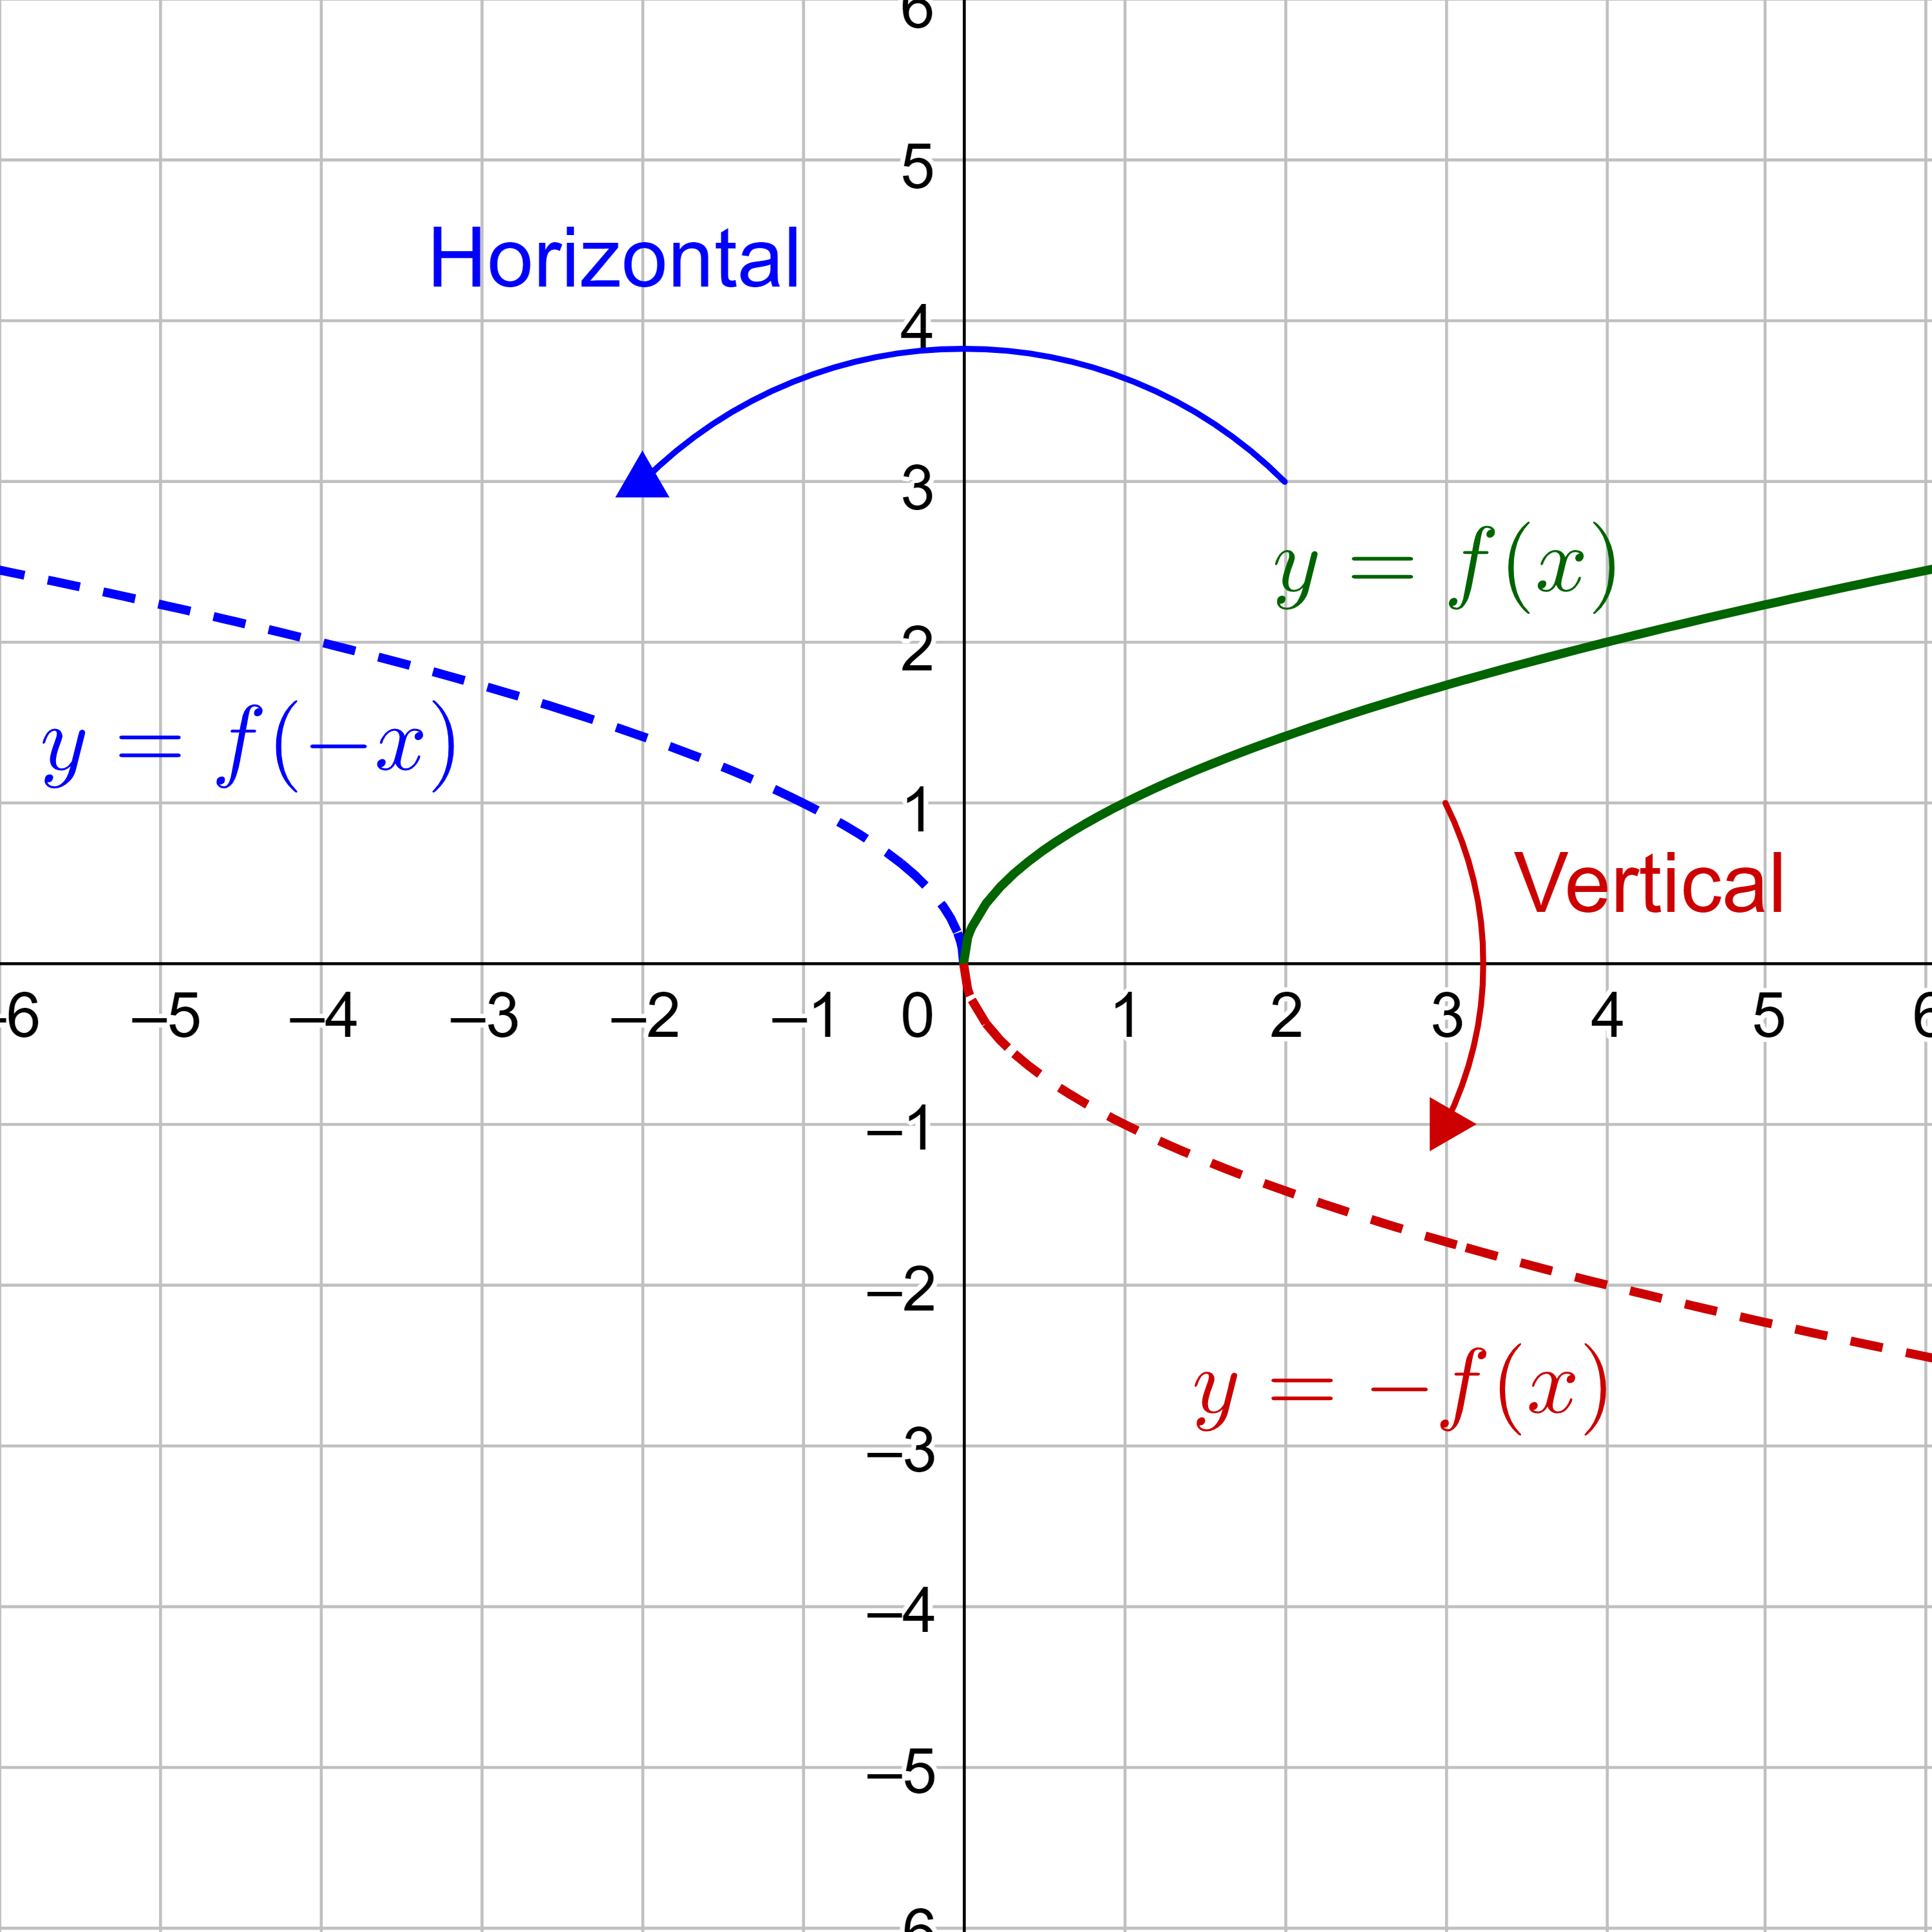
Another transformation is a reflection. A horizontal reflection reflects the graph over the y-axis, and a vertical reflection reflects the graph over the x-axis. This is accomplished by moving all points the same distance as the point is from the axis to the opposite side of the axis. A horizontal reflection will have the same y-values, but the x-values will have the opposite sign, so y = f(−x). A vertical reflection will have the same x-values, but the y-values will have the opposite sign, so y = −f(x).
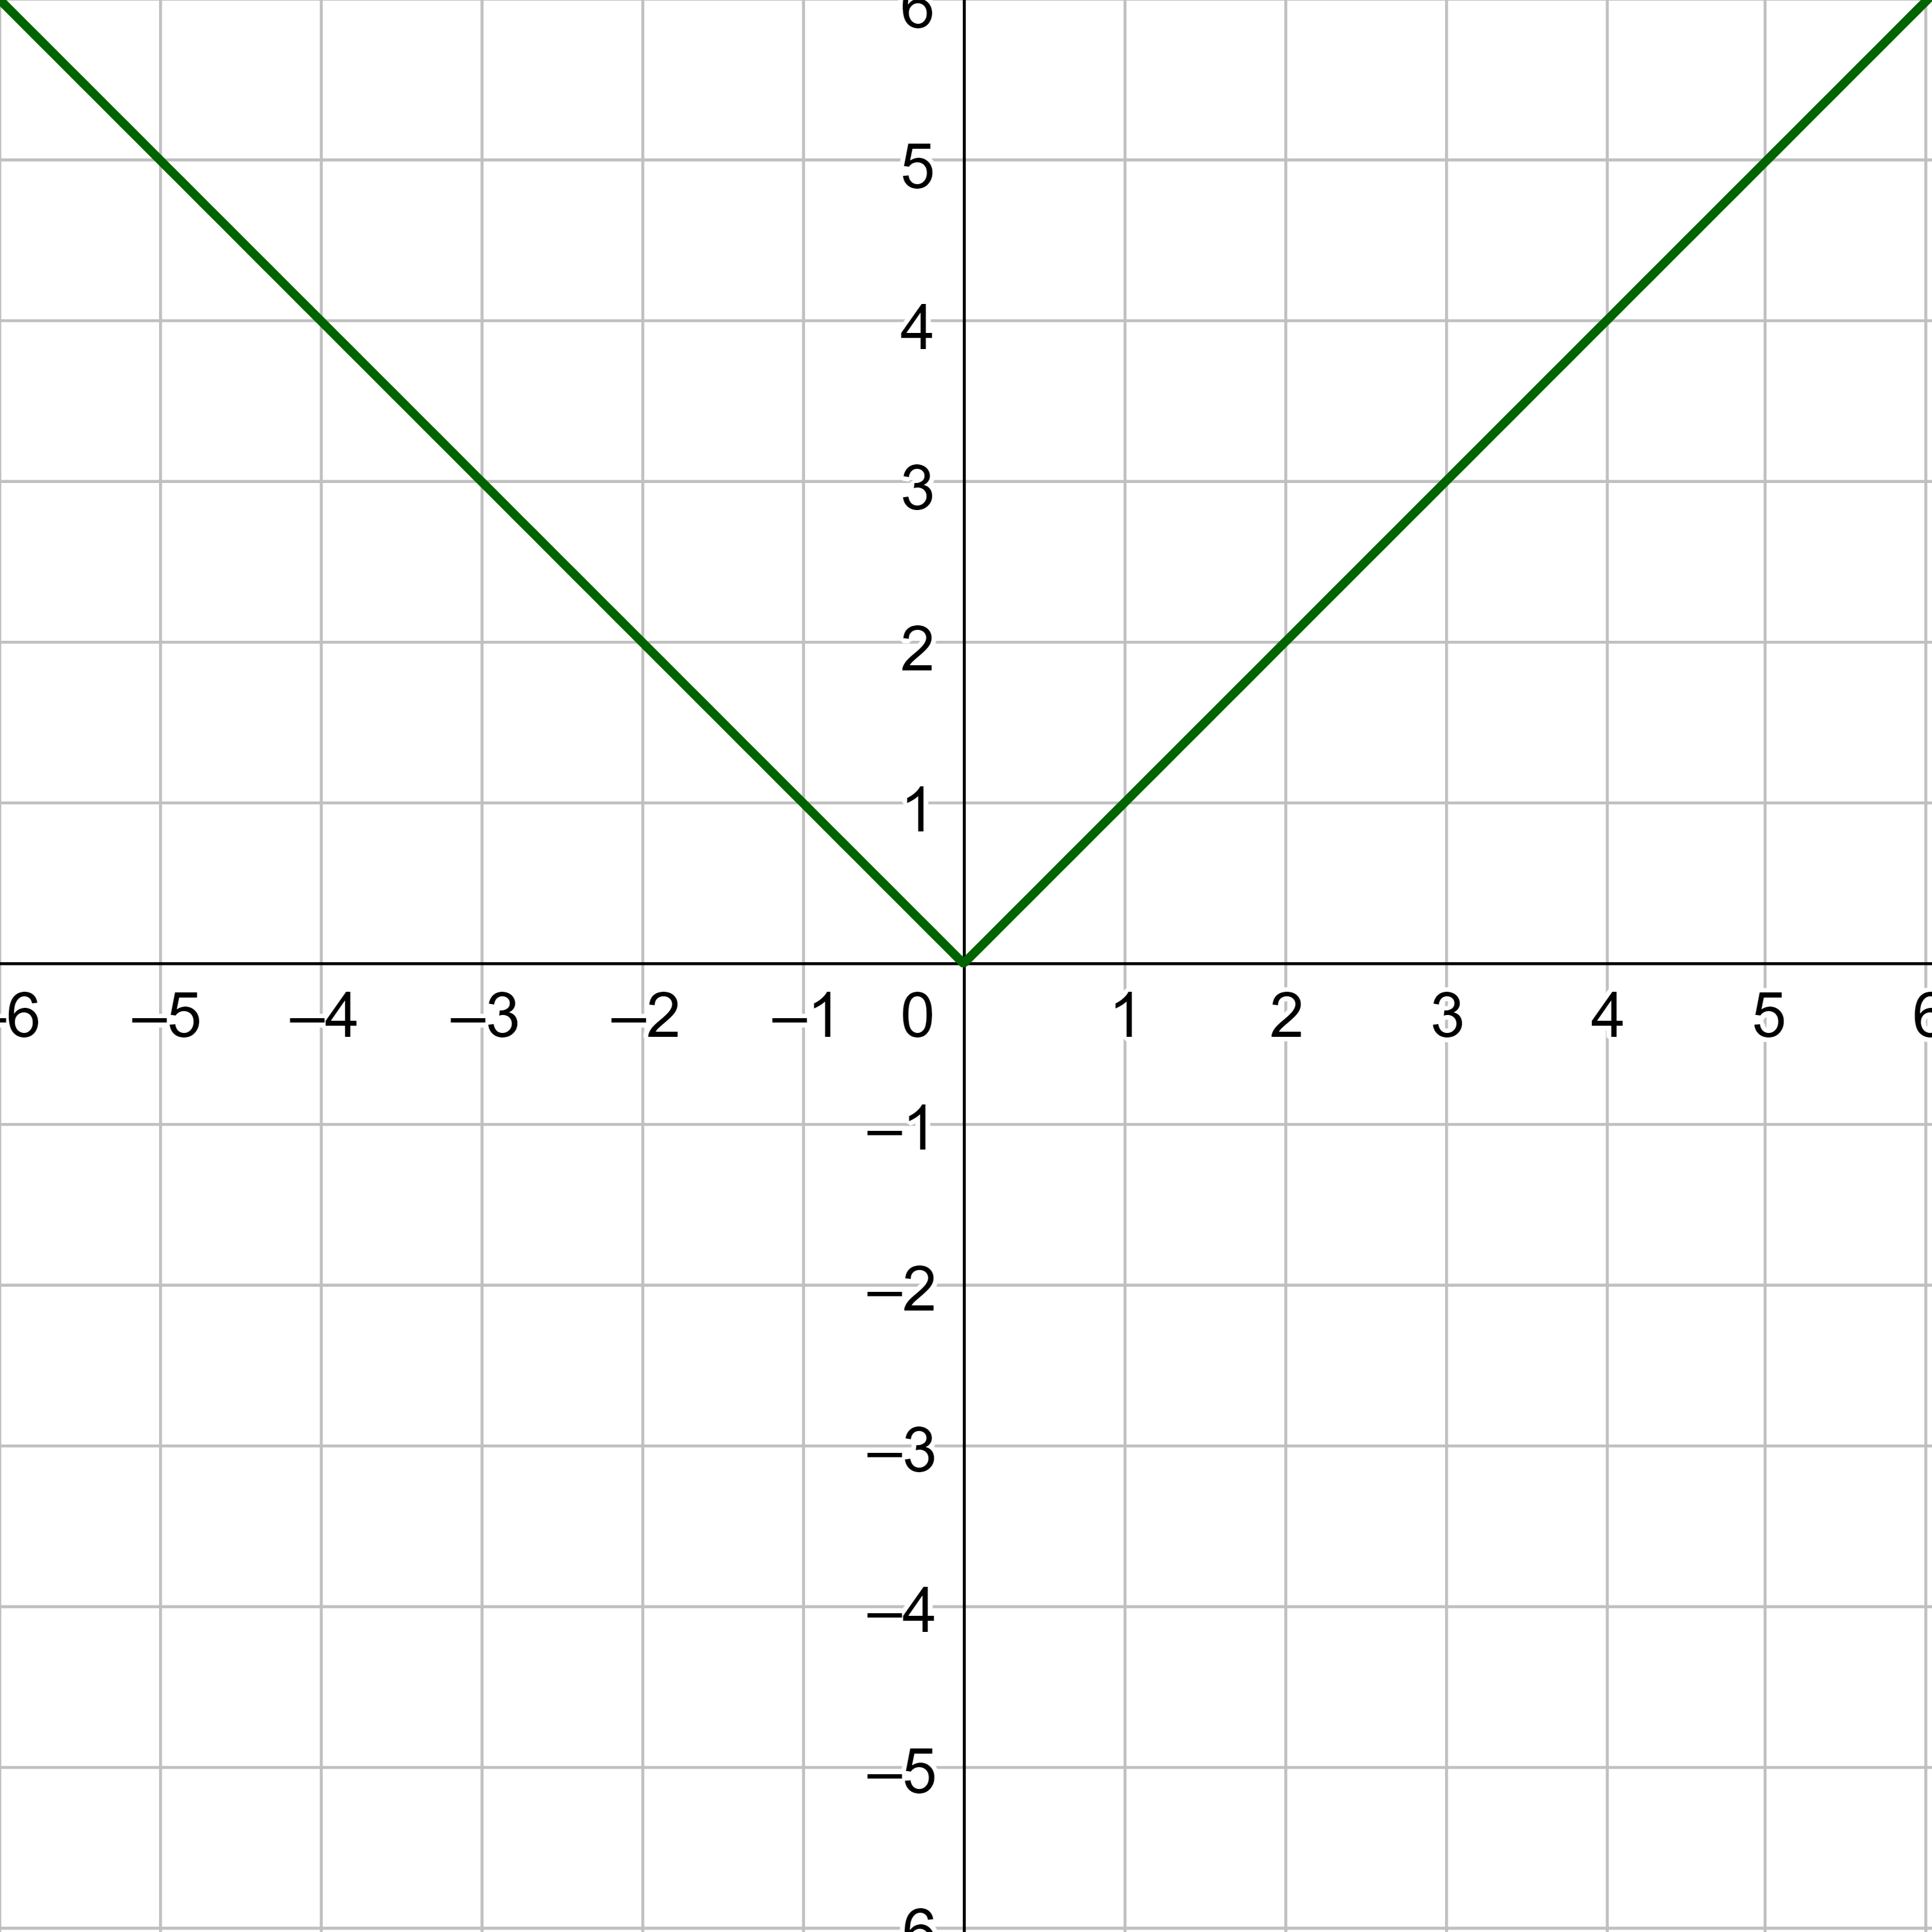
Reflect the graph of f(x) = |x| (a) vertically and (b) horizontally.
Solution
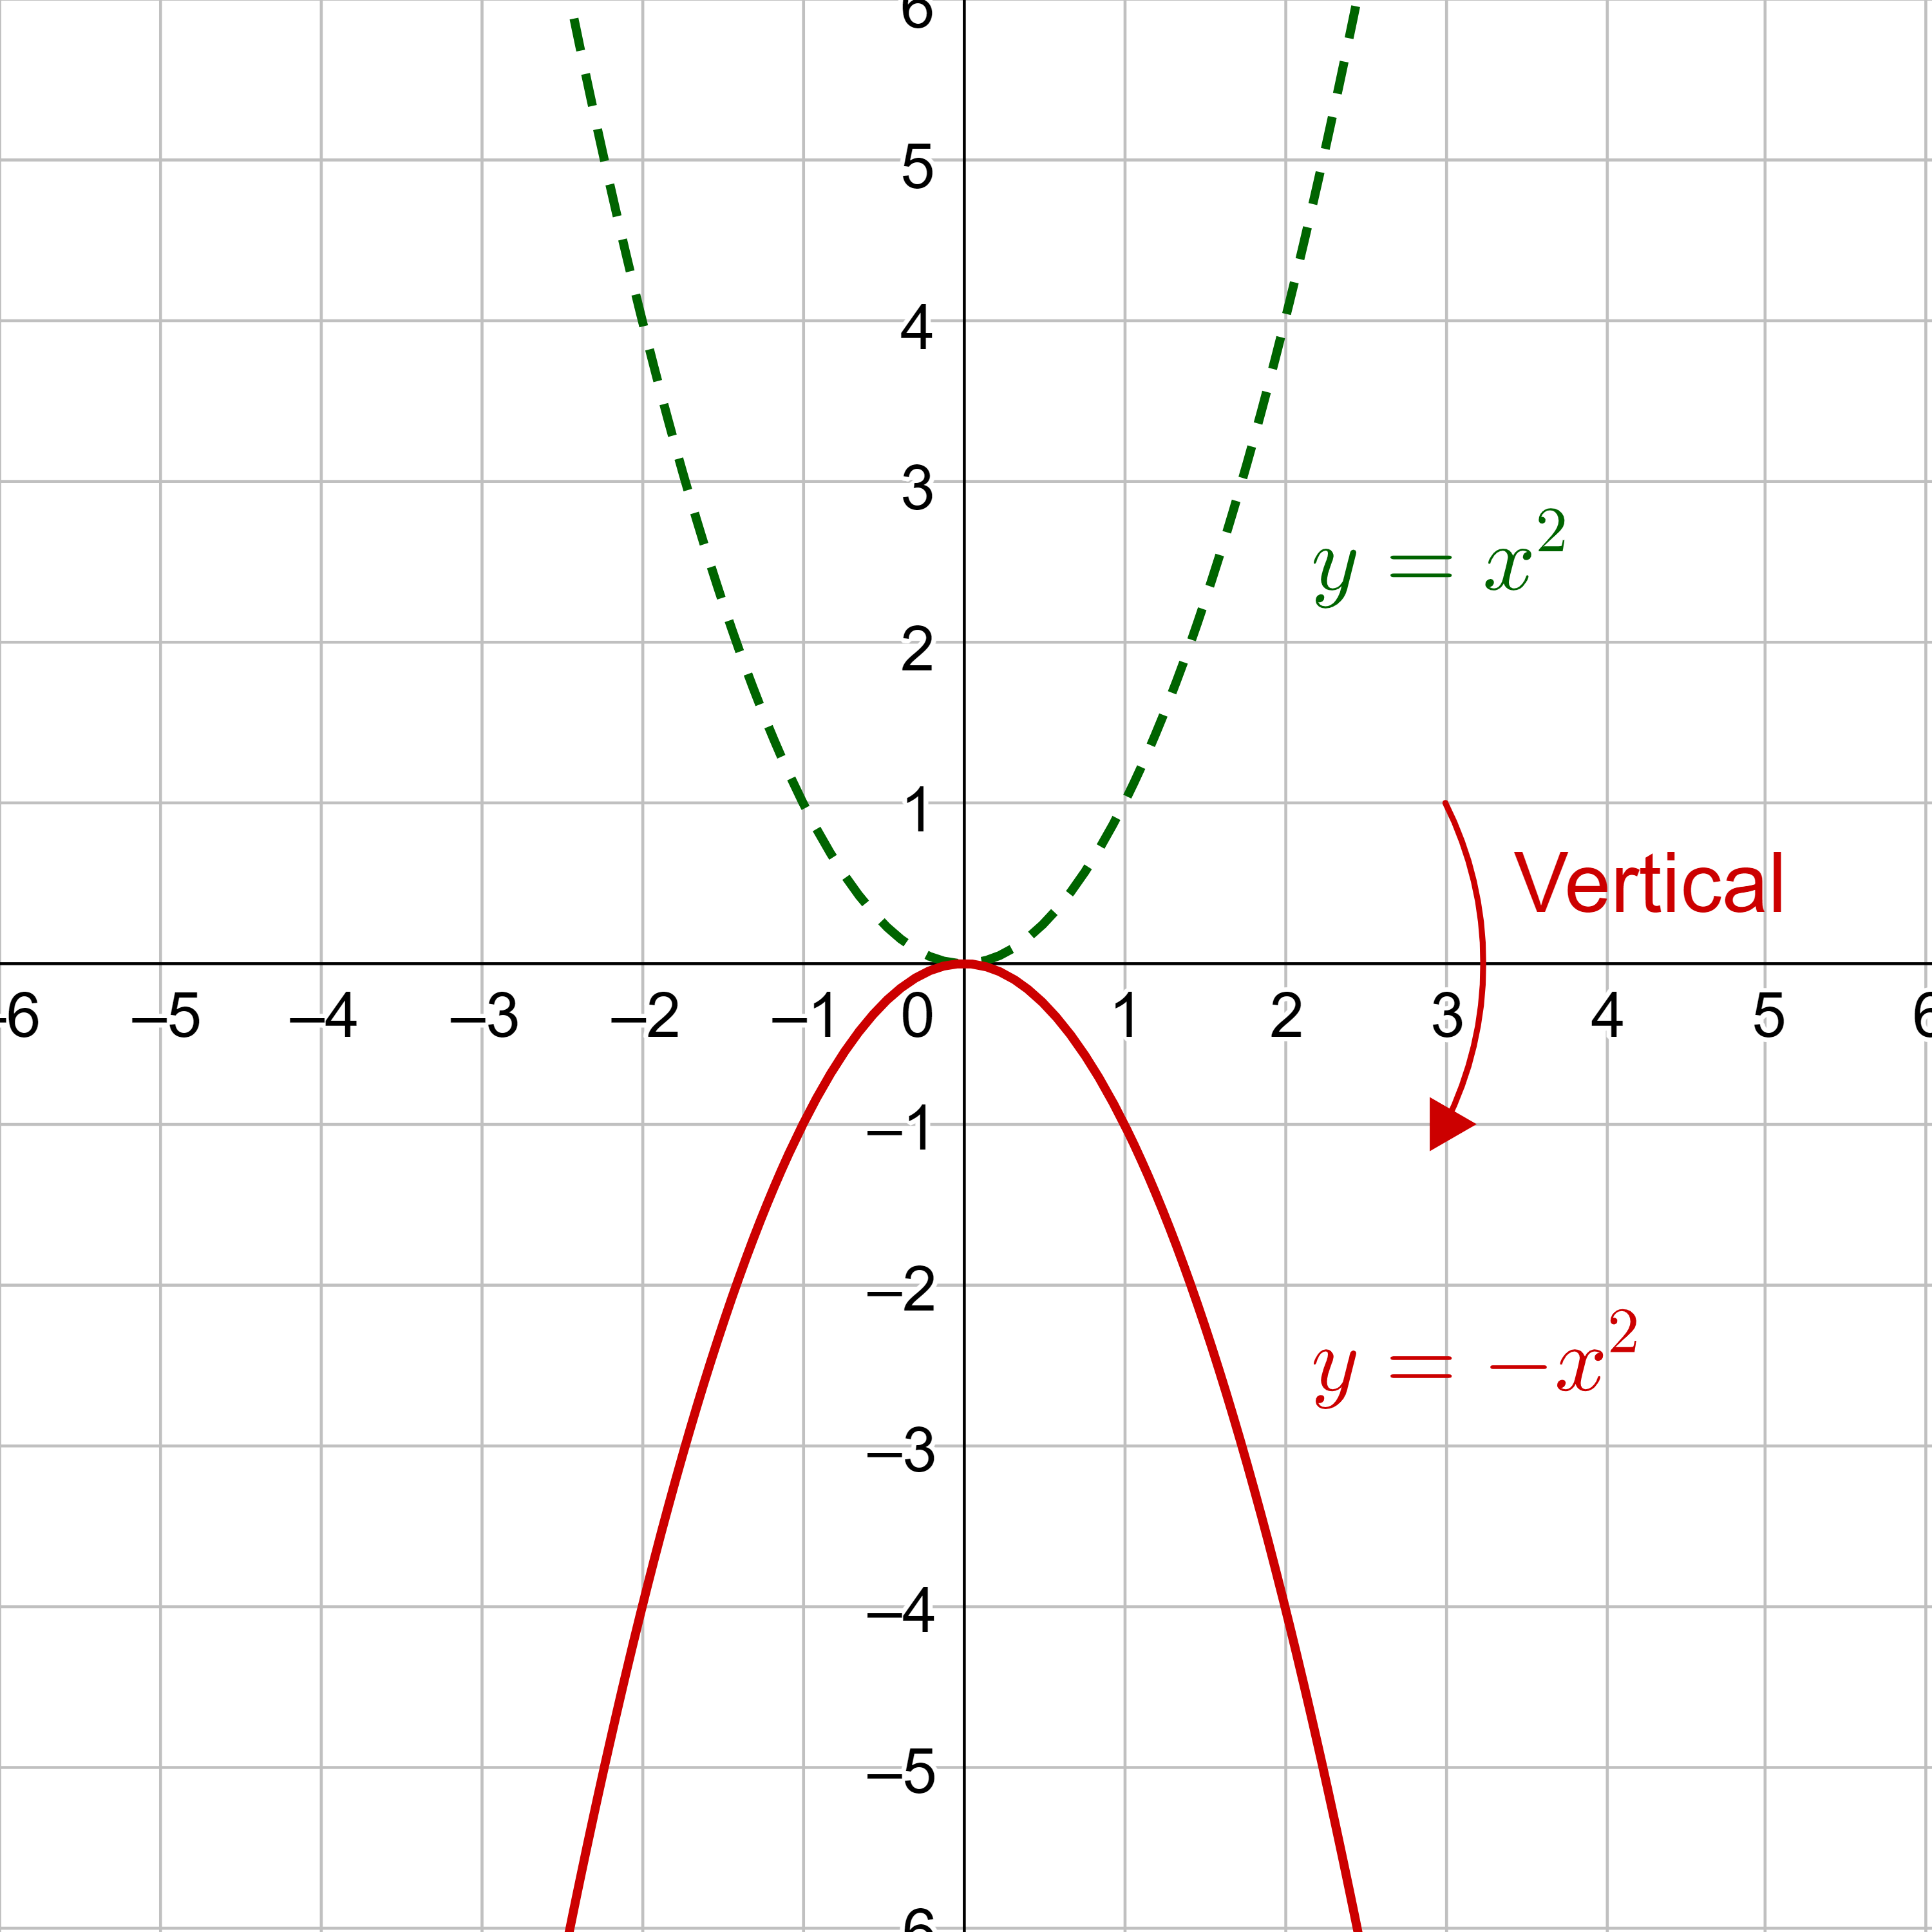
Reflecting the graph vertically means that each output y-value will be reflected over the horizontal x-axis as shown in figure 10.
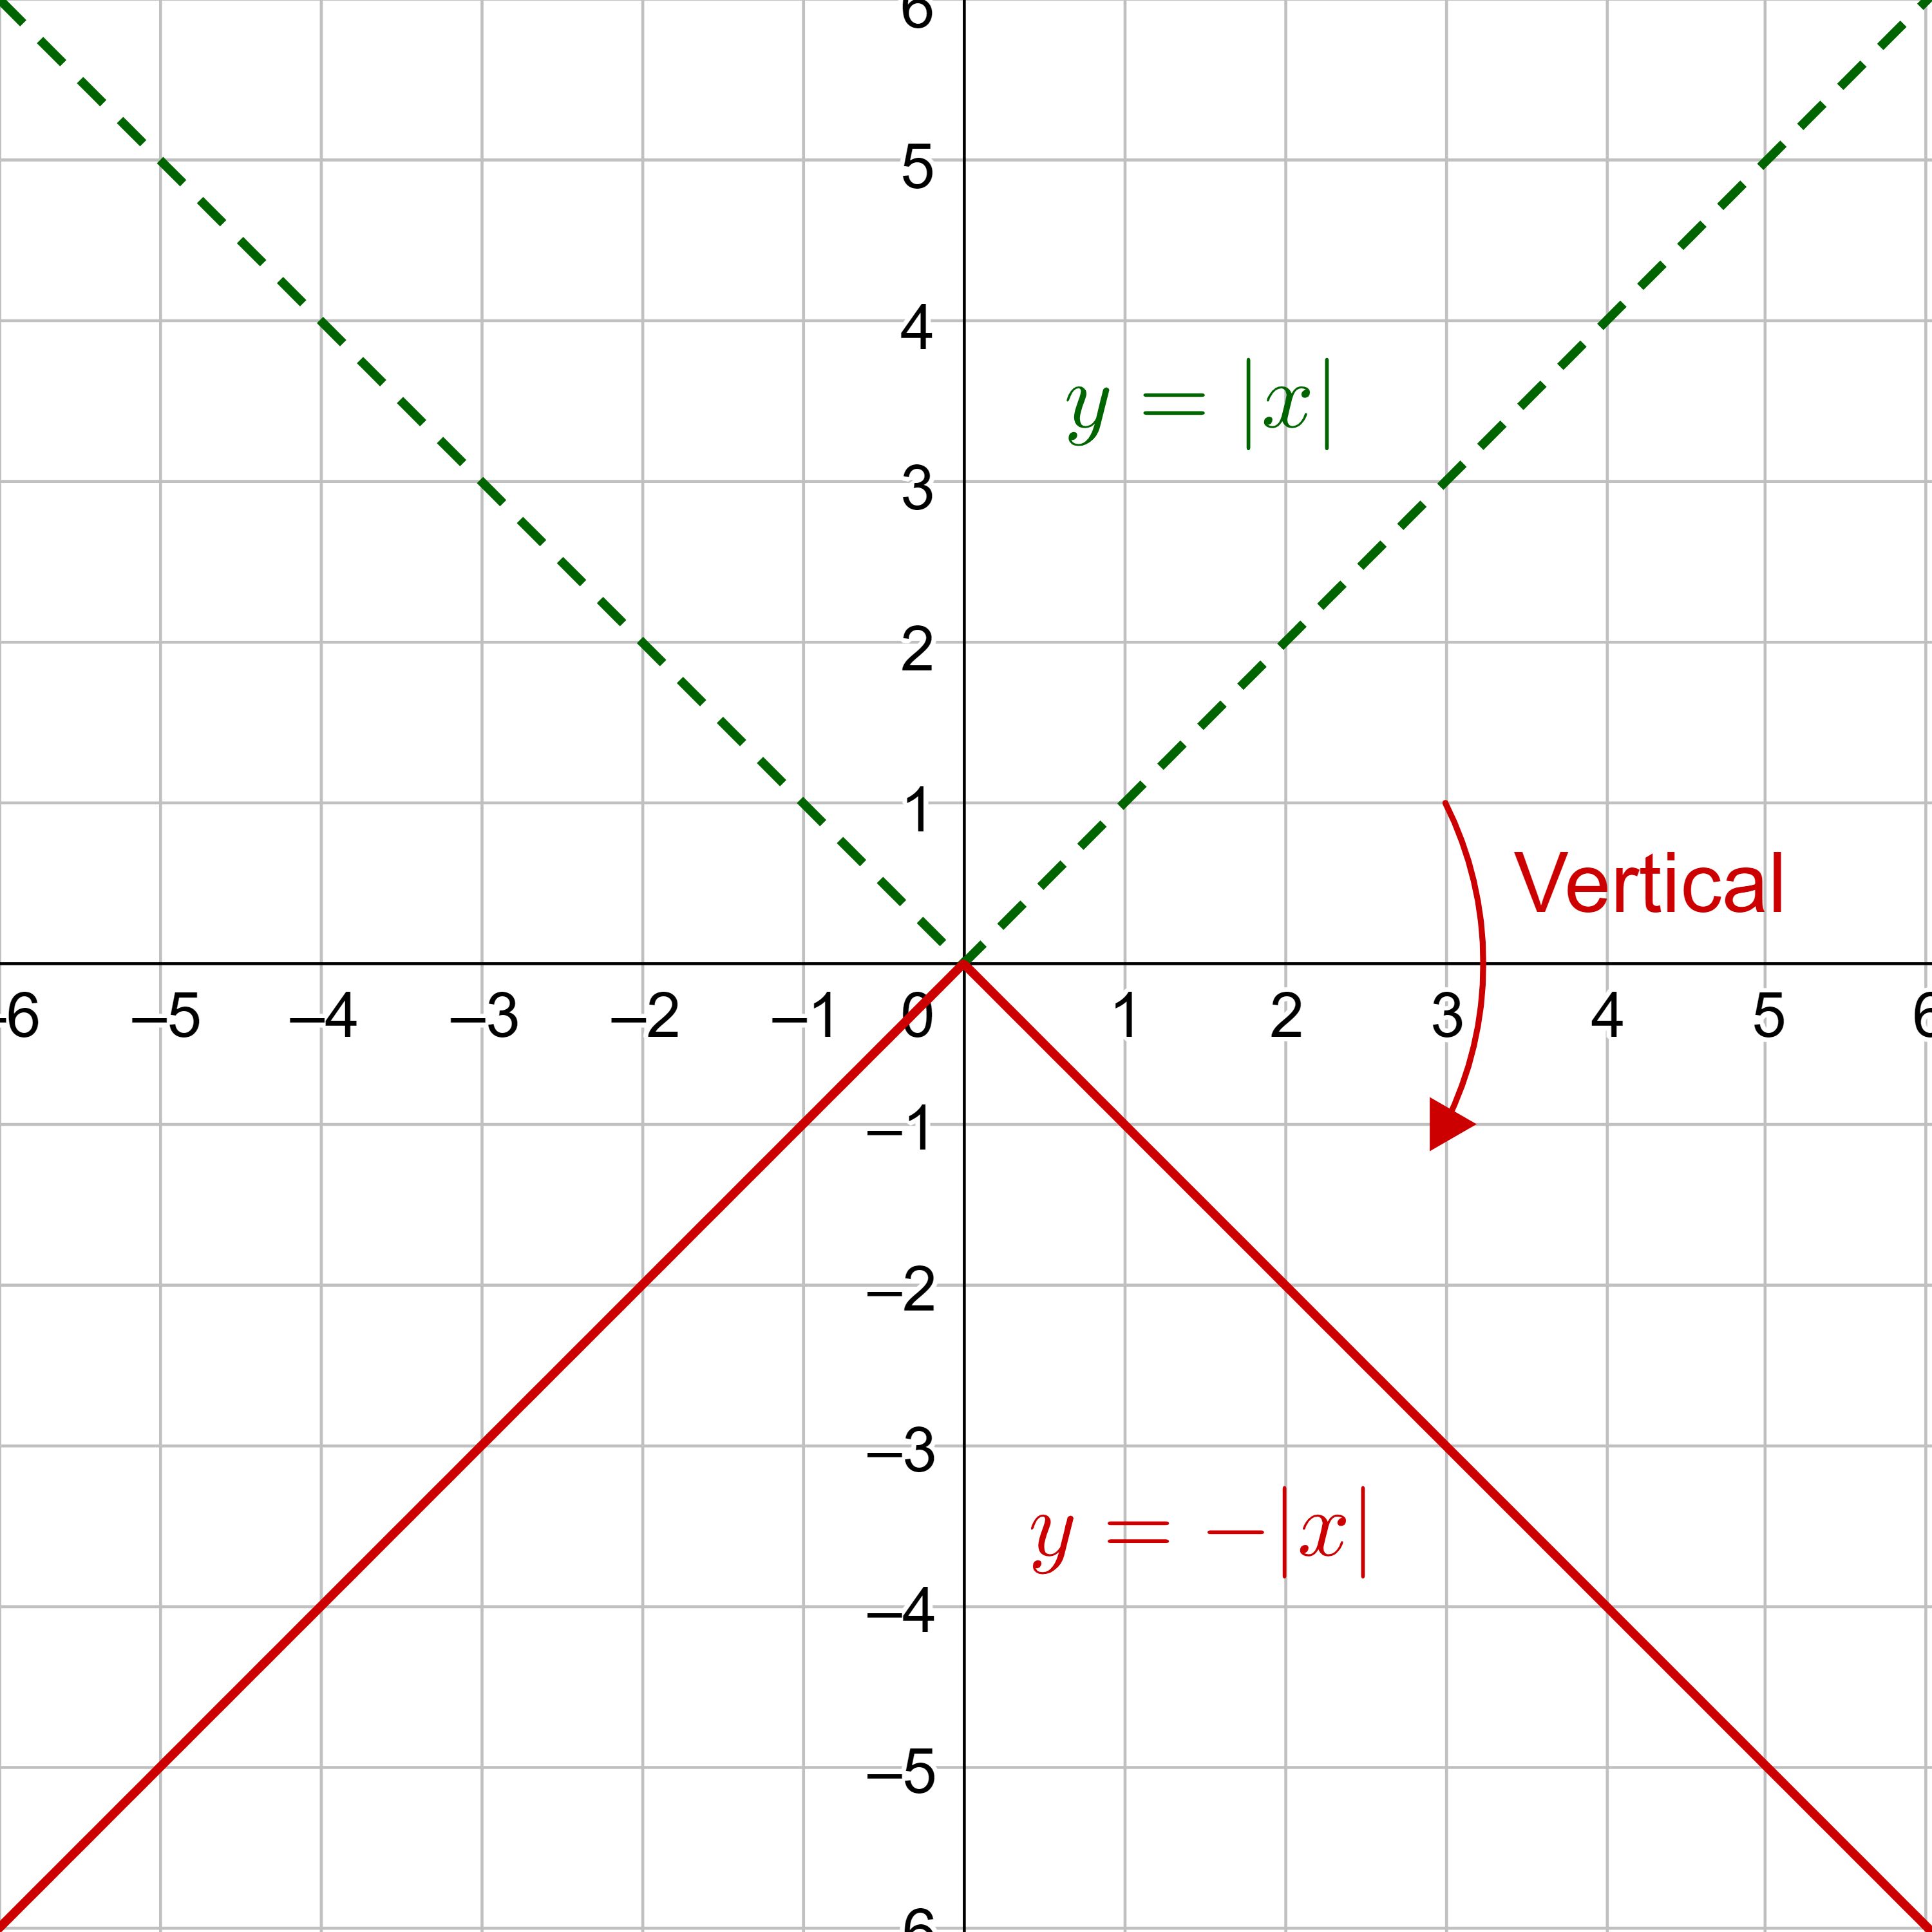
Because each y-value is the opposite of the original y-value, the new function is v(x) = −f(x). (v was chosen for vertical).
v(x) = −|x|
Notice that this is an outside change, or vertical, that affects the output f(x) values, so the negative sign belongs outside of the function.
Reflecting the graph horizontally means that each input x-value will be reflected over the vertical y-axis as shown in figure 11.
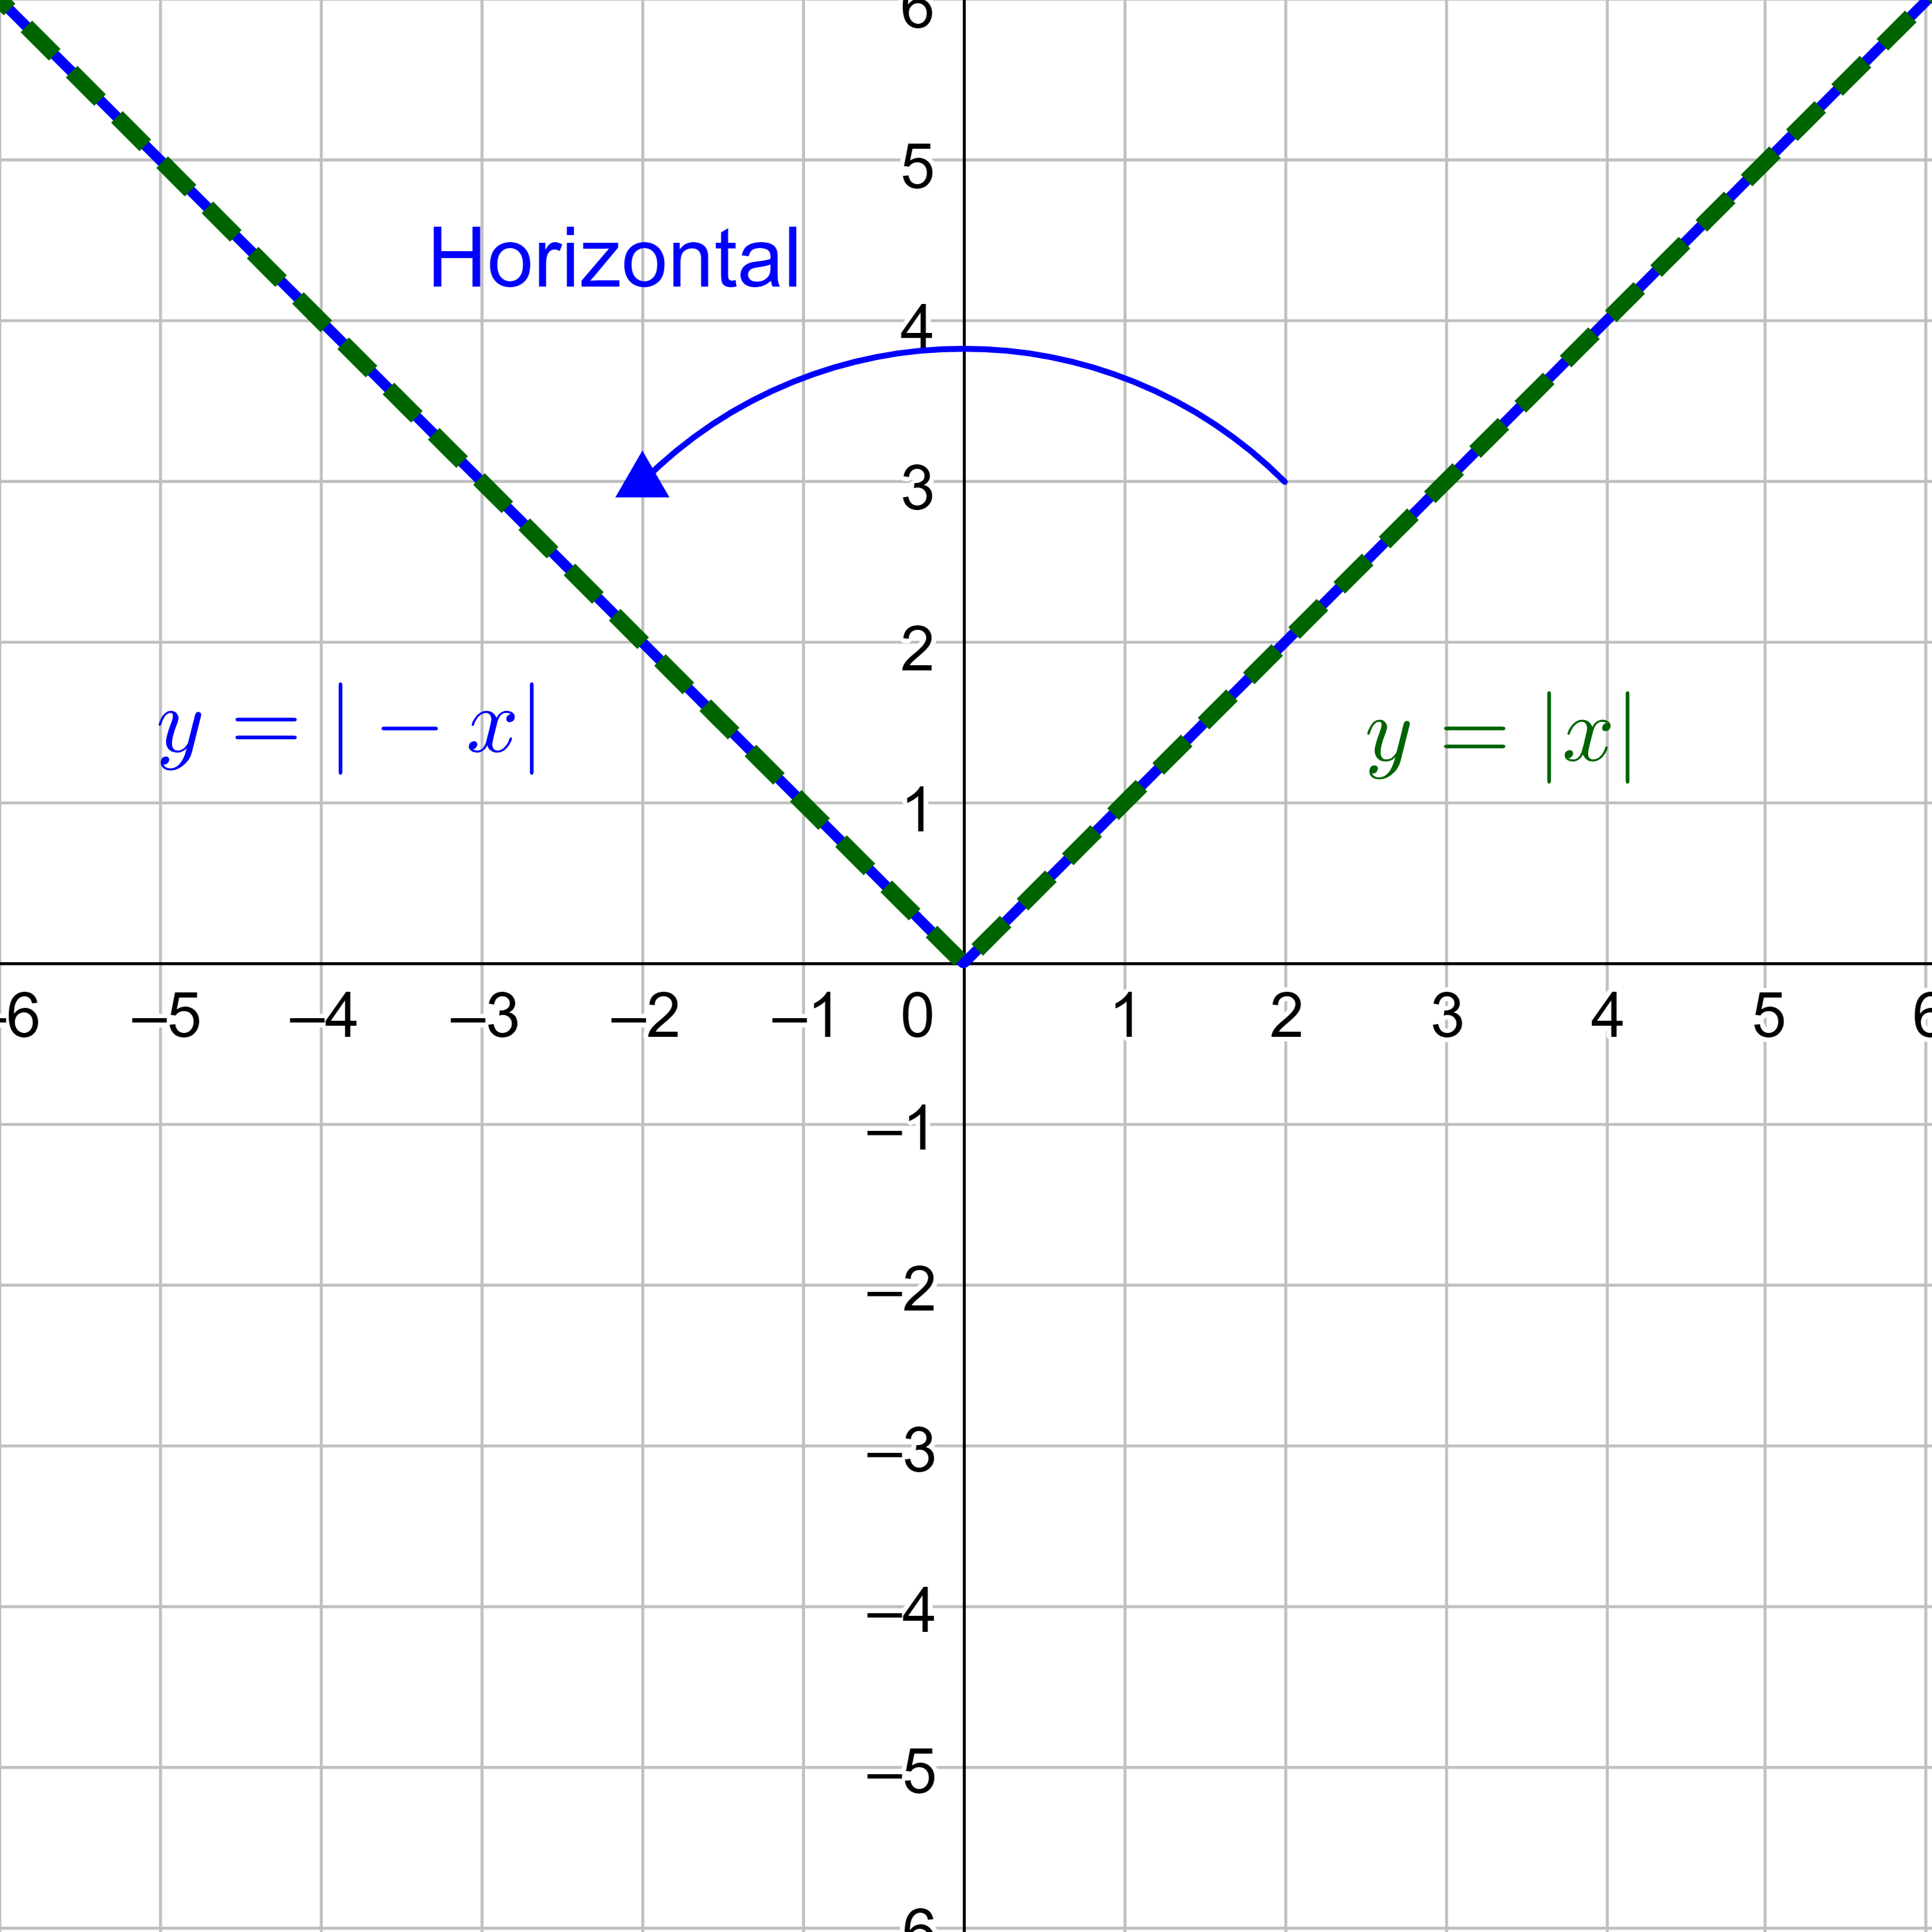
Because each x-value is the opposite of the original x-value, the new function is h(x) = f(−x). (h was chosen for horizontal).
h(x) = |−x|
Notice that this is an inside change, or horizontal, that affects the input values, so the negative sign is on the inside of the function.
Given the parent function f(x) = x2, graph g(x) = −f(x) and h(x) = f(−x).
Answer
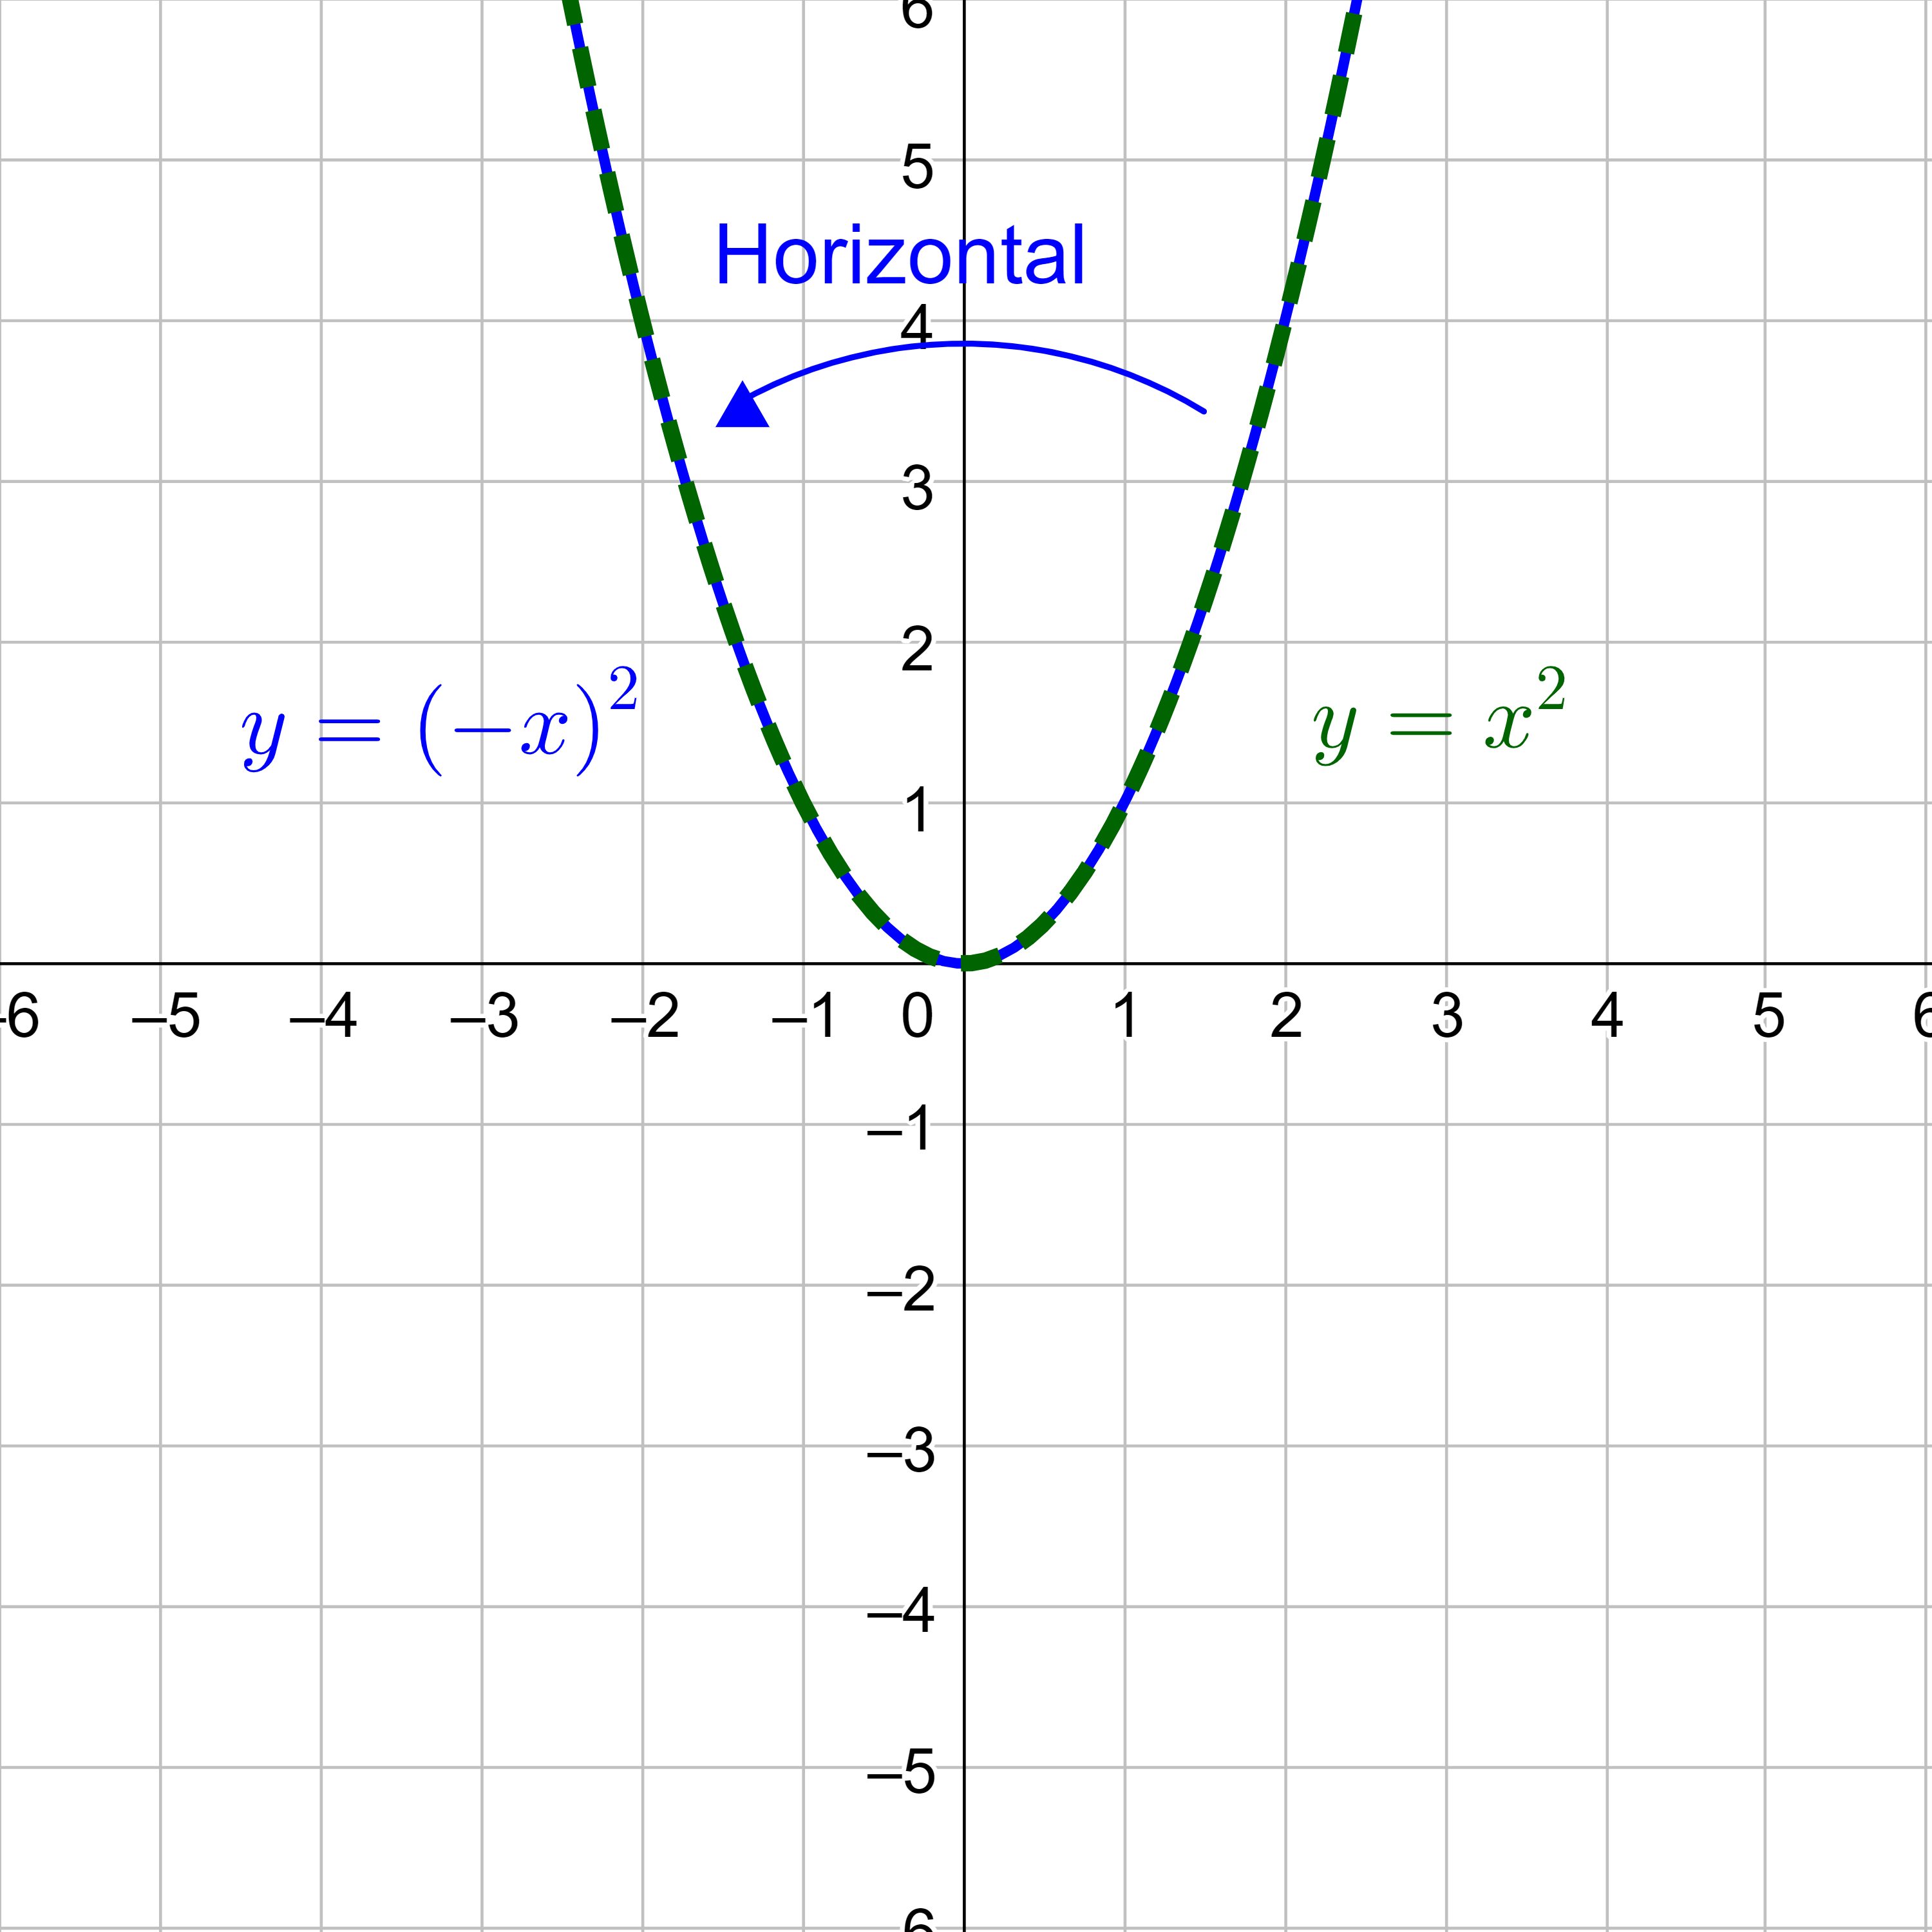
Some functions have symmetry where reflections are the same as the original graph. For example, the horizontal reflection over the y-axis of the absolute value function in figure 11 results in a graph that is the same as the original graph. Graphs that are symmetric when reflecting over the y-axis are called even functions.
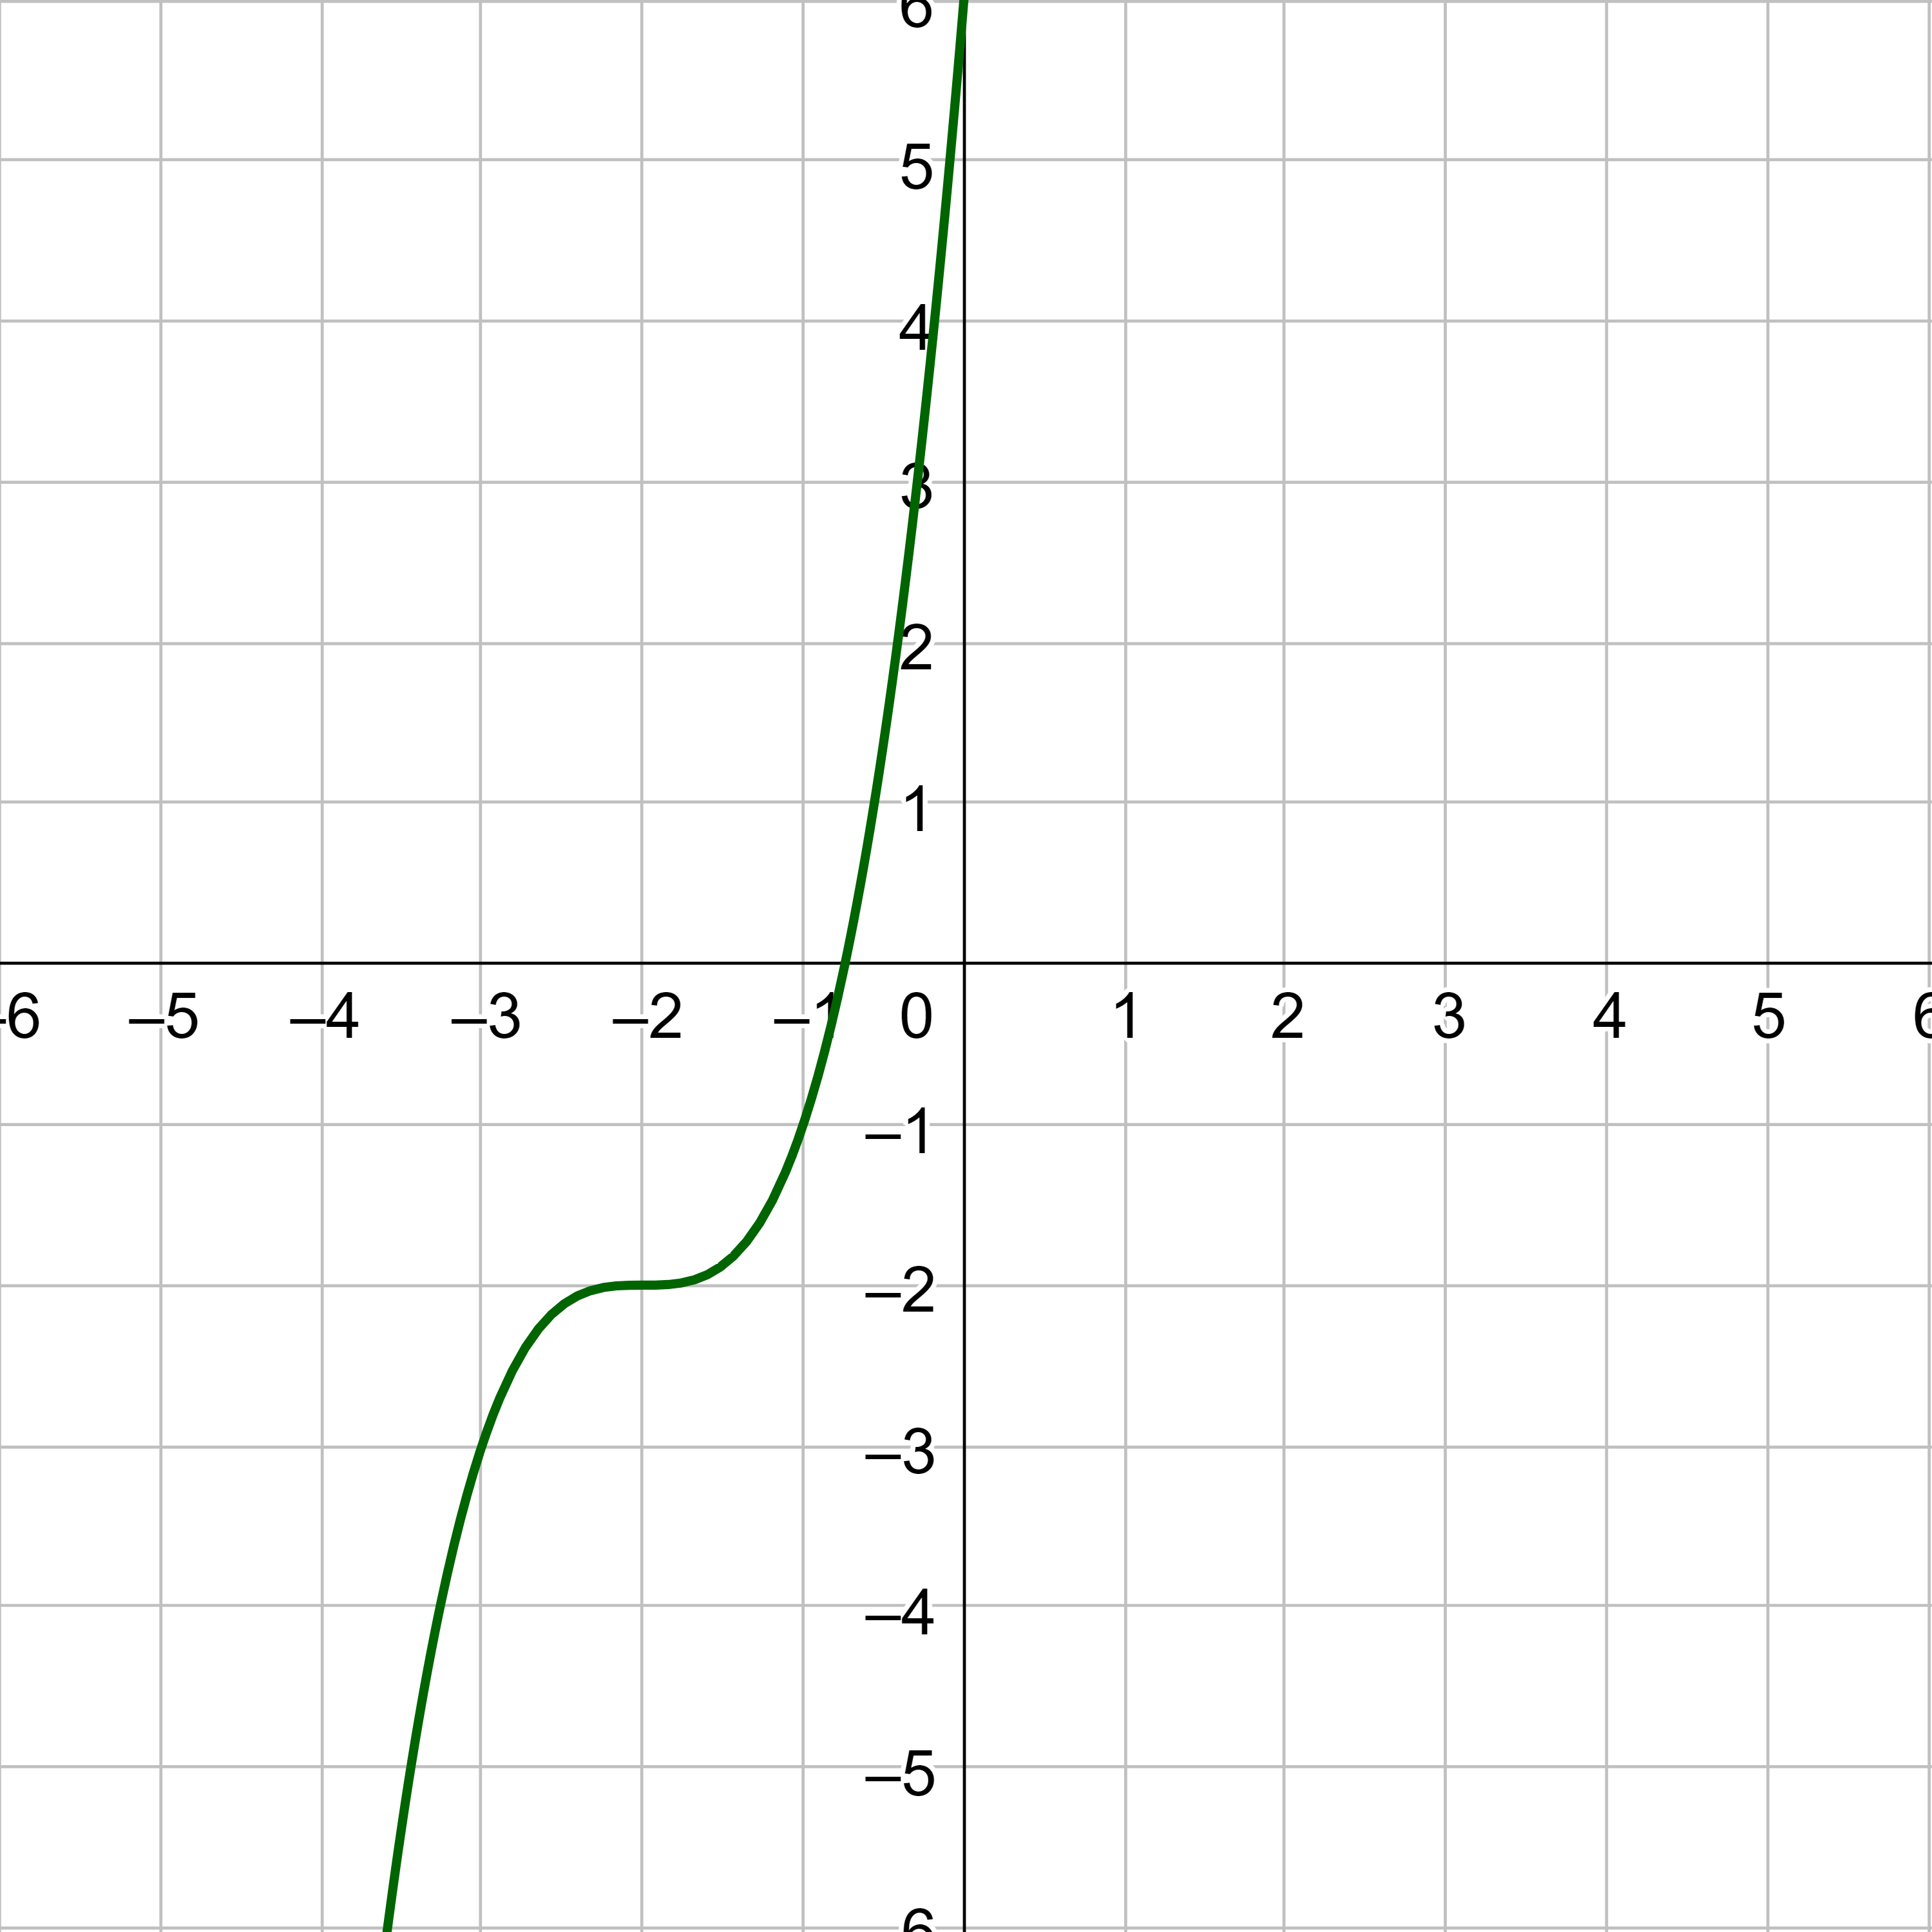
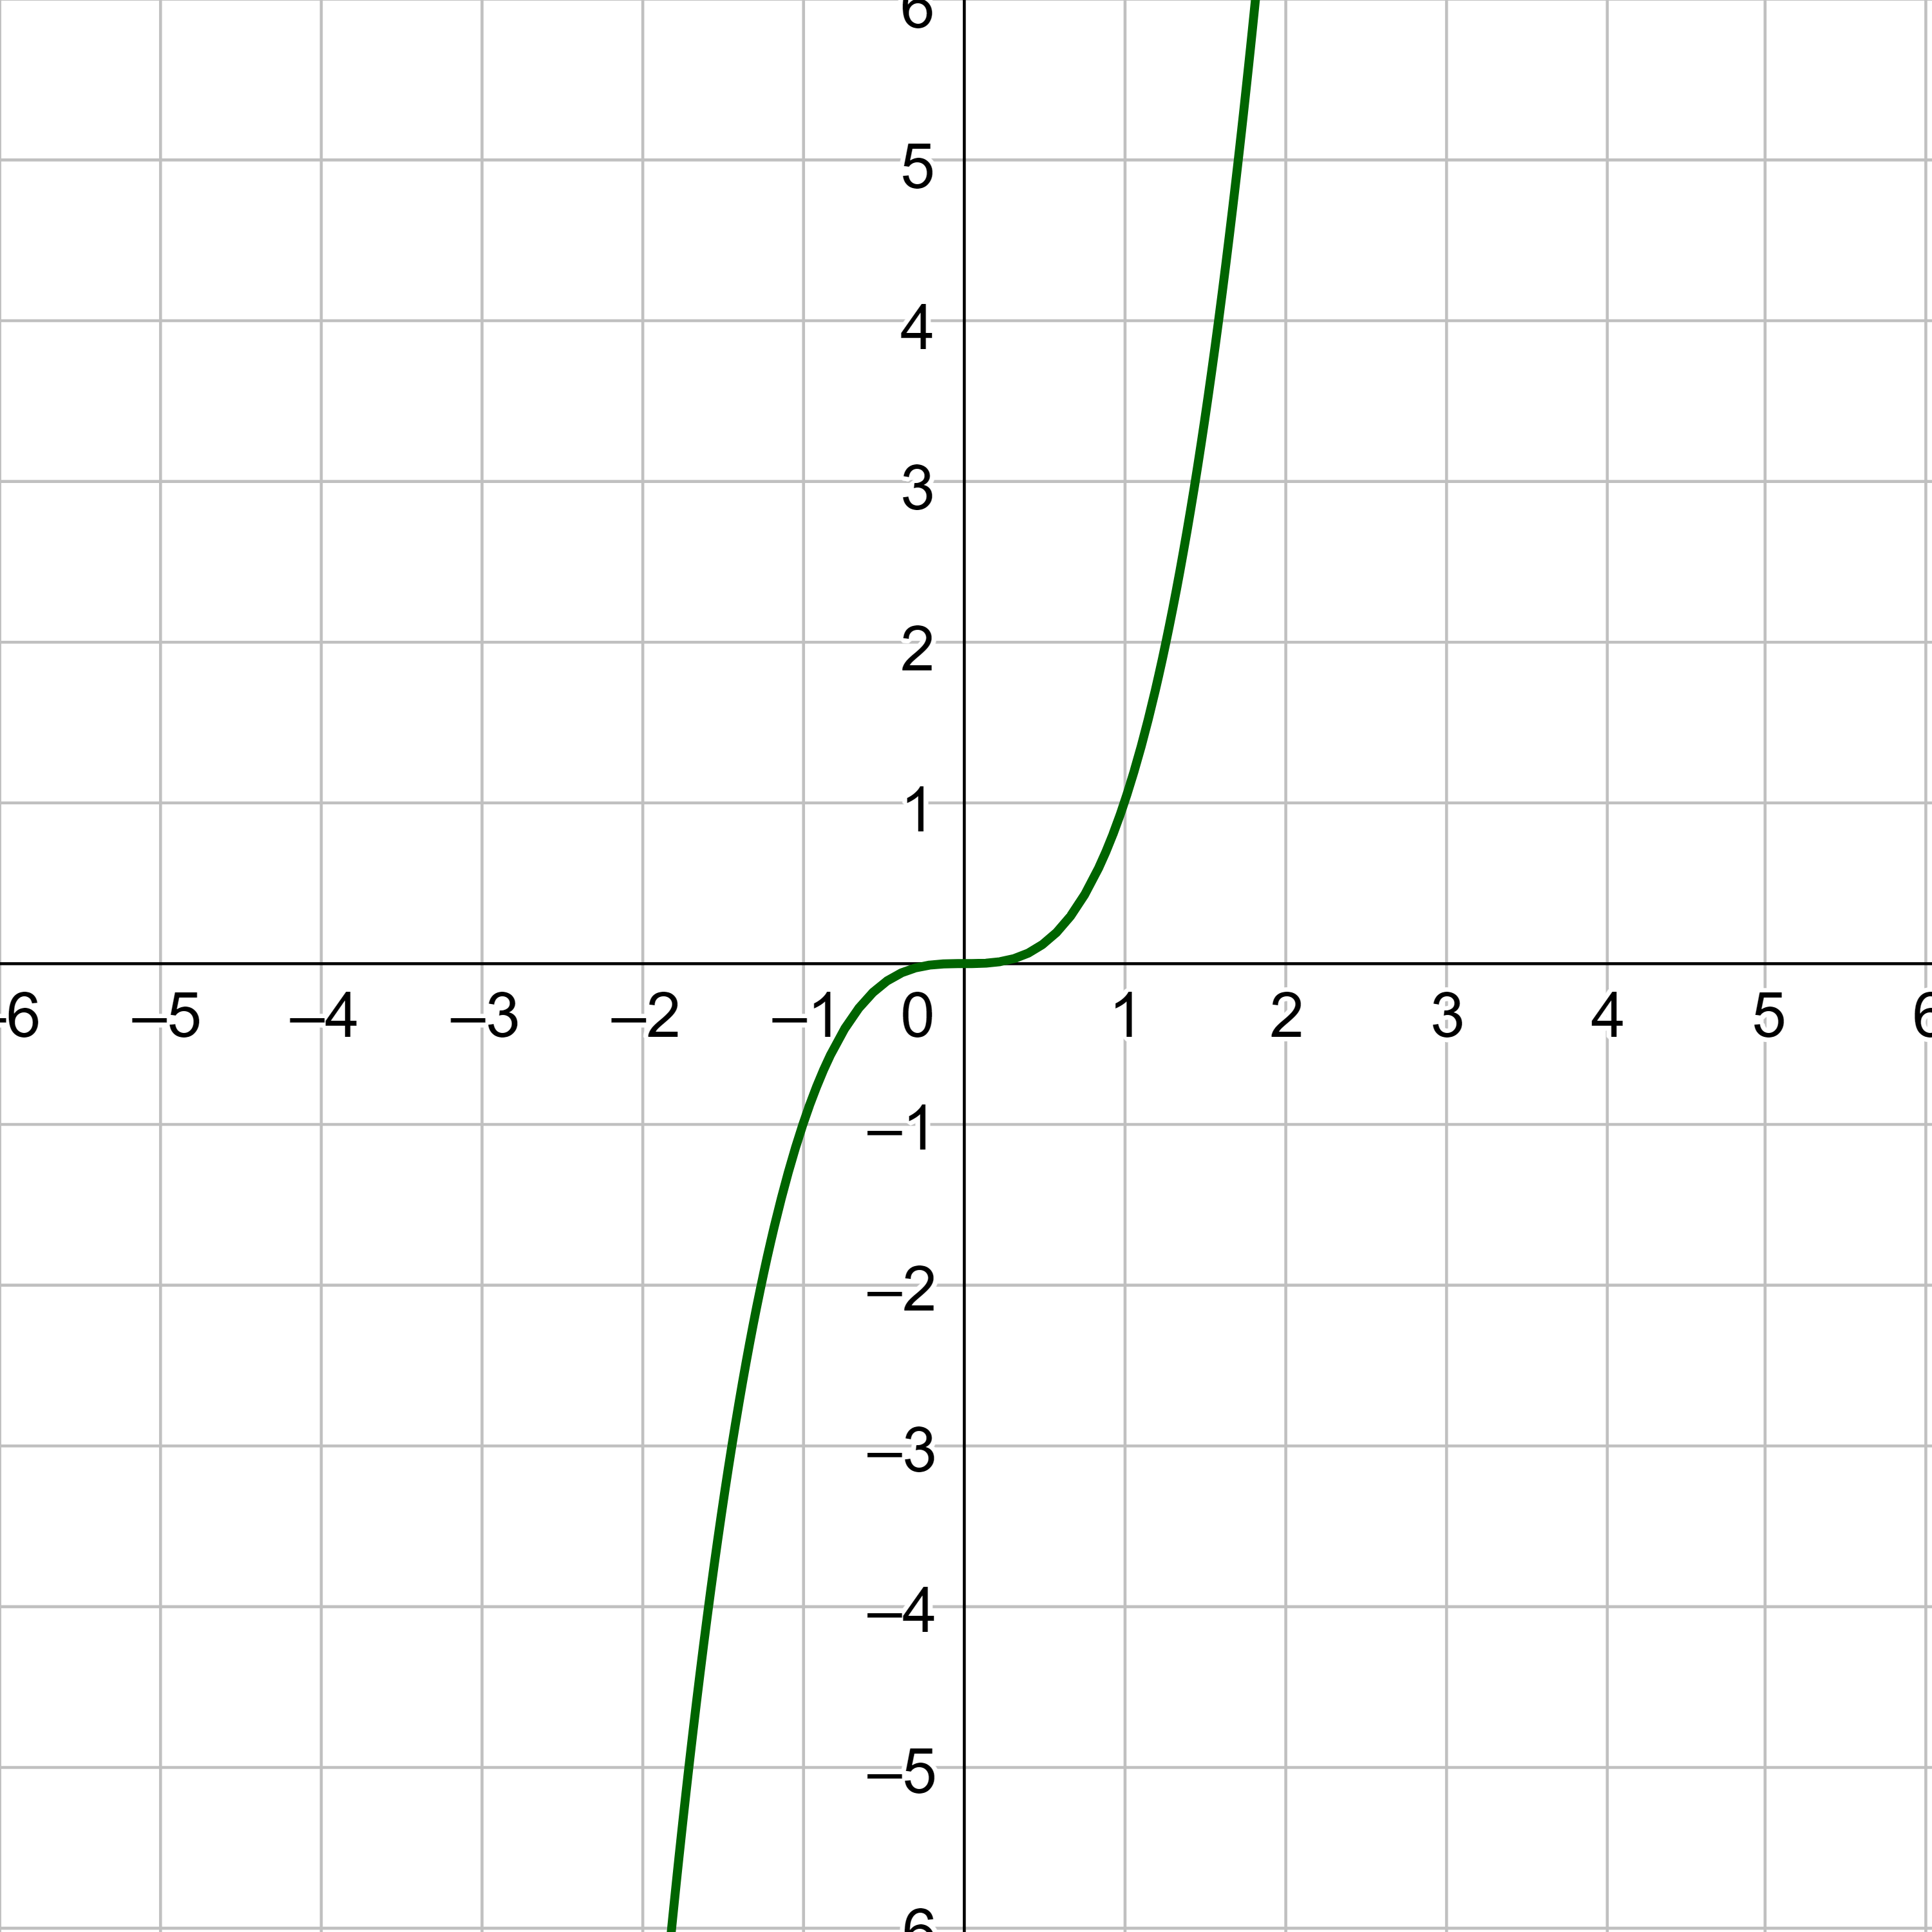
Other functions such as f(x) = x3 result in the original graph after reflecting in both the x- and y-axes. Reflecting in the x-axis, then reflecting that in the y-axis is the same result as a 180° rotation about the origin. Functions that are symmetric after reflecting in both axes, or rotating 180°, are called odd functions.
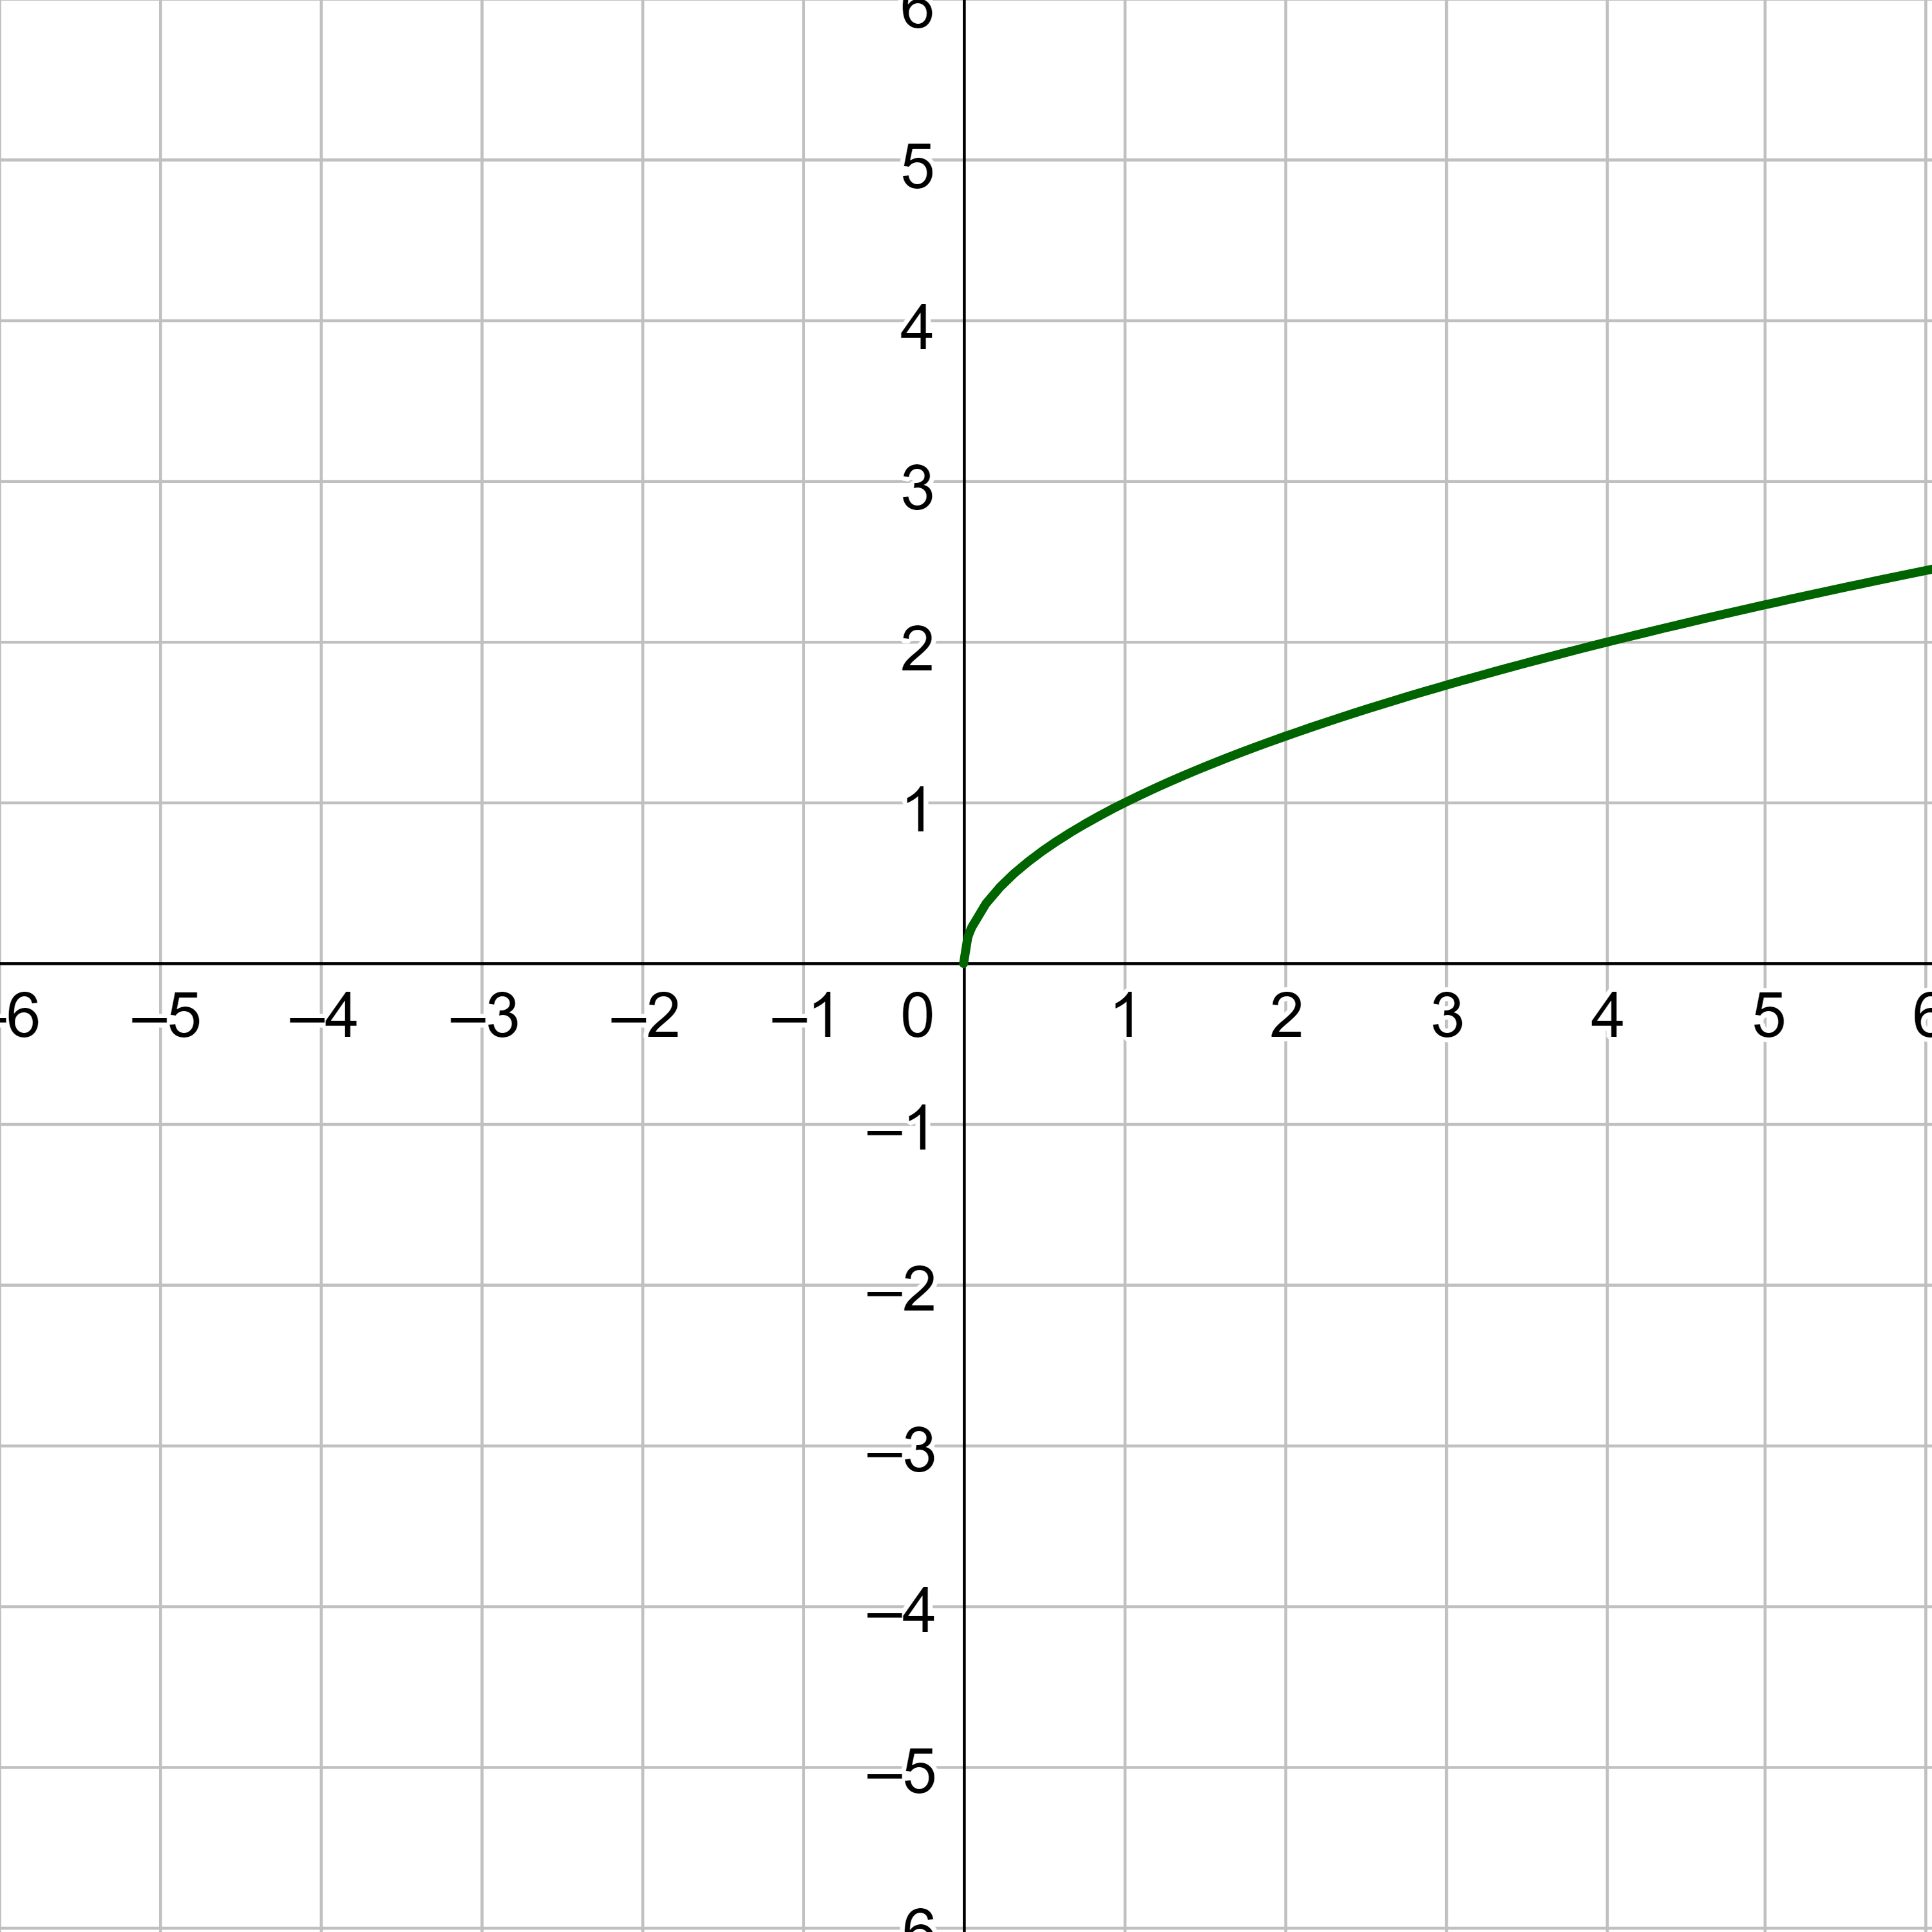
A function can be even, odd, both, or neither. Consider a circle with its center on the origin. It is both even and odd. However, the square root function is neither even or odd.
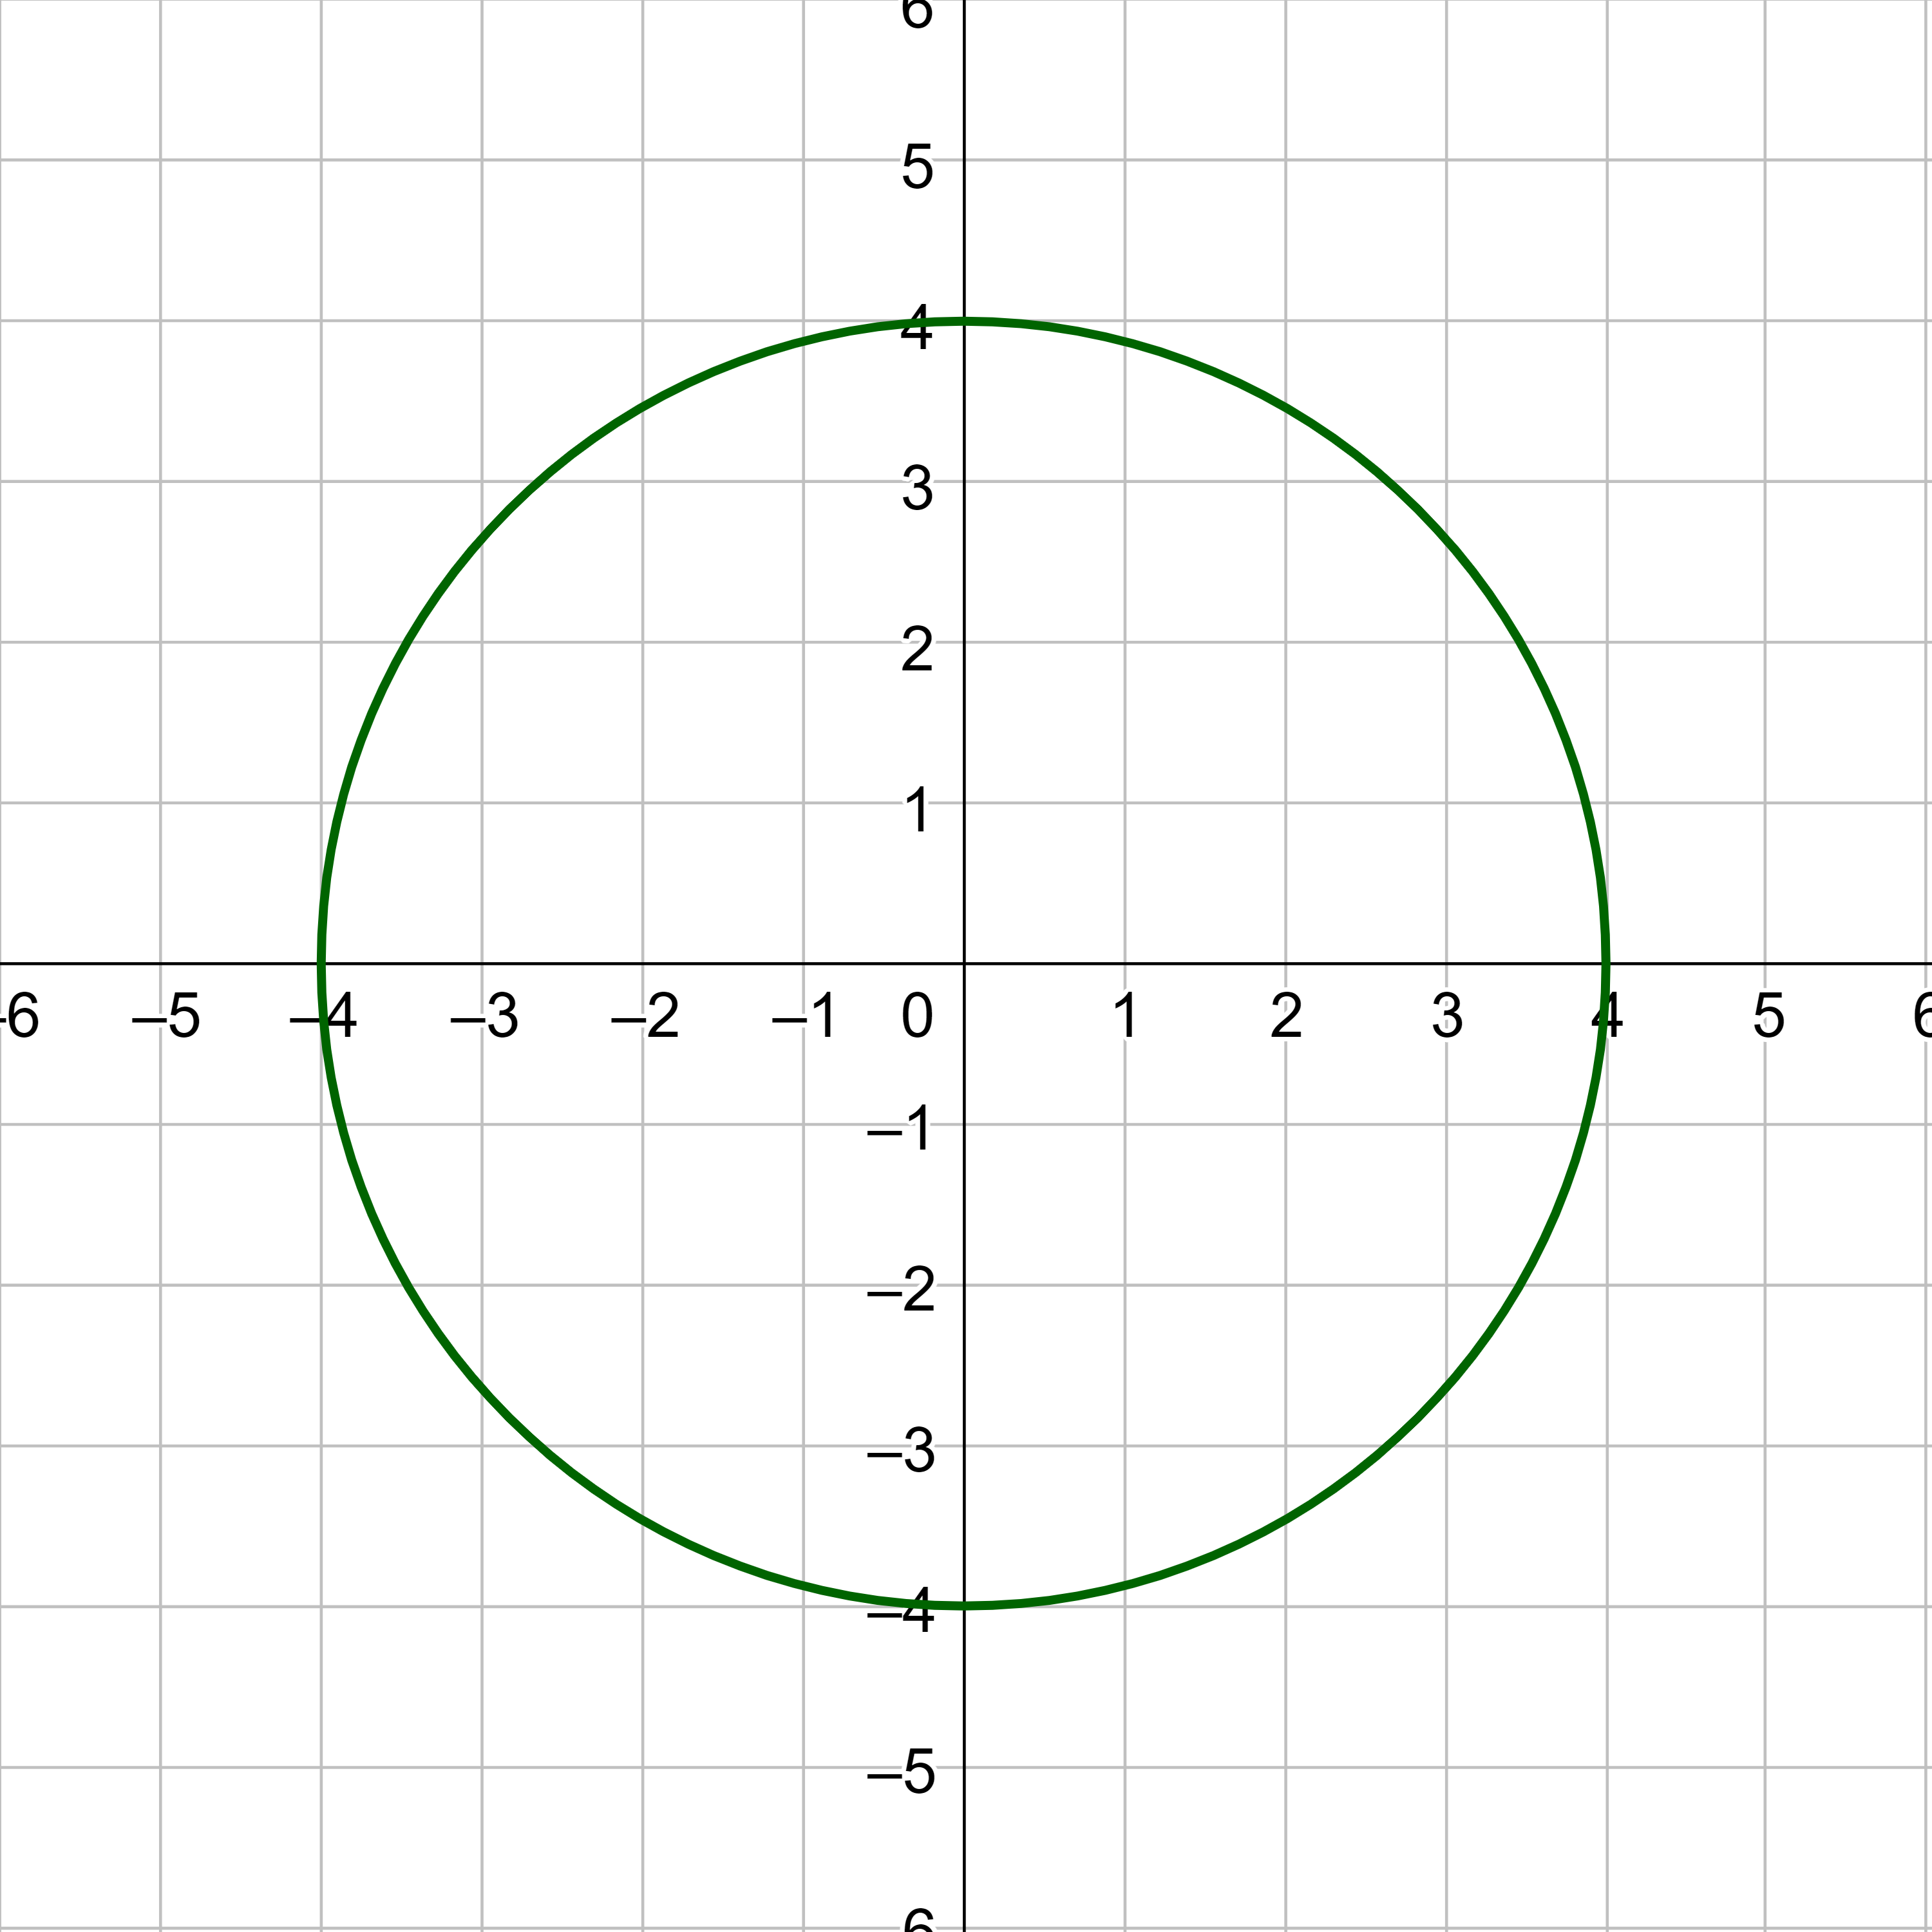
The graph of an even function is symmetric with a reflection over the y-axis.
The graph of an odd function is symmetric with a 180° rotation about the origin, or reflections in both the x- and y-axis.
Translations and reflections moved the graph, but did not change its shape. Stretches and shrinks are transformations that do change the shape by stretching or shrinking the graph in one direction. This is done by multiplying the inputs or outputs by some number.
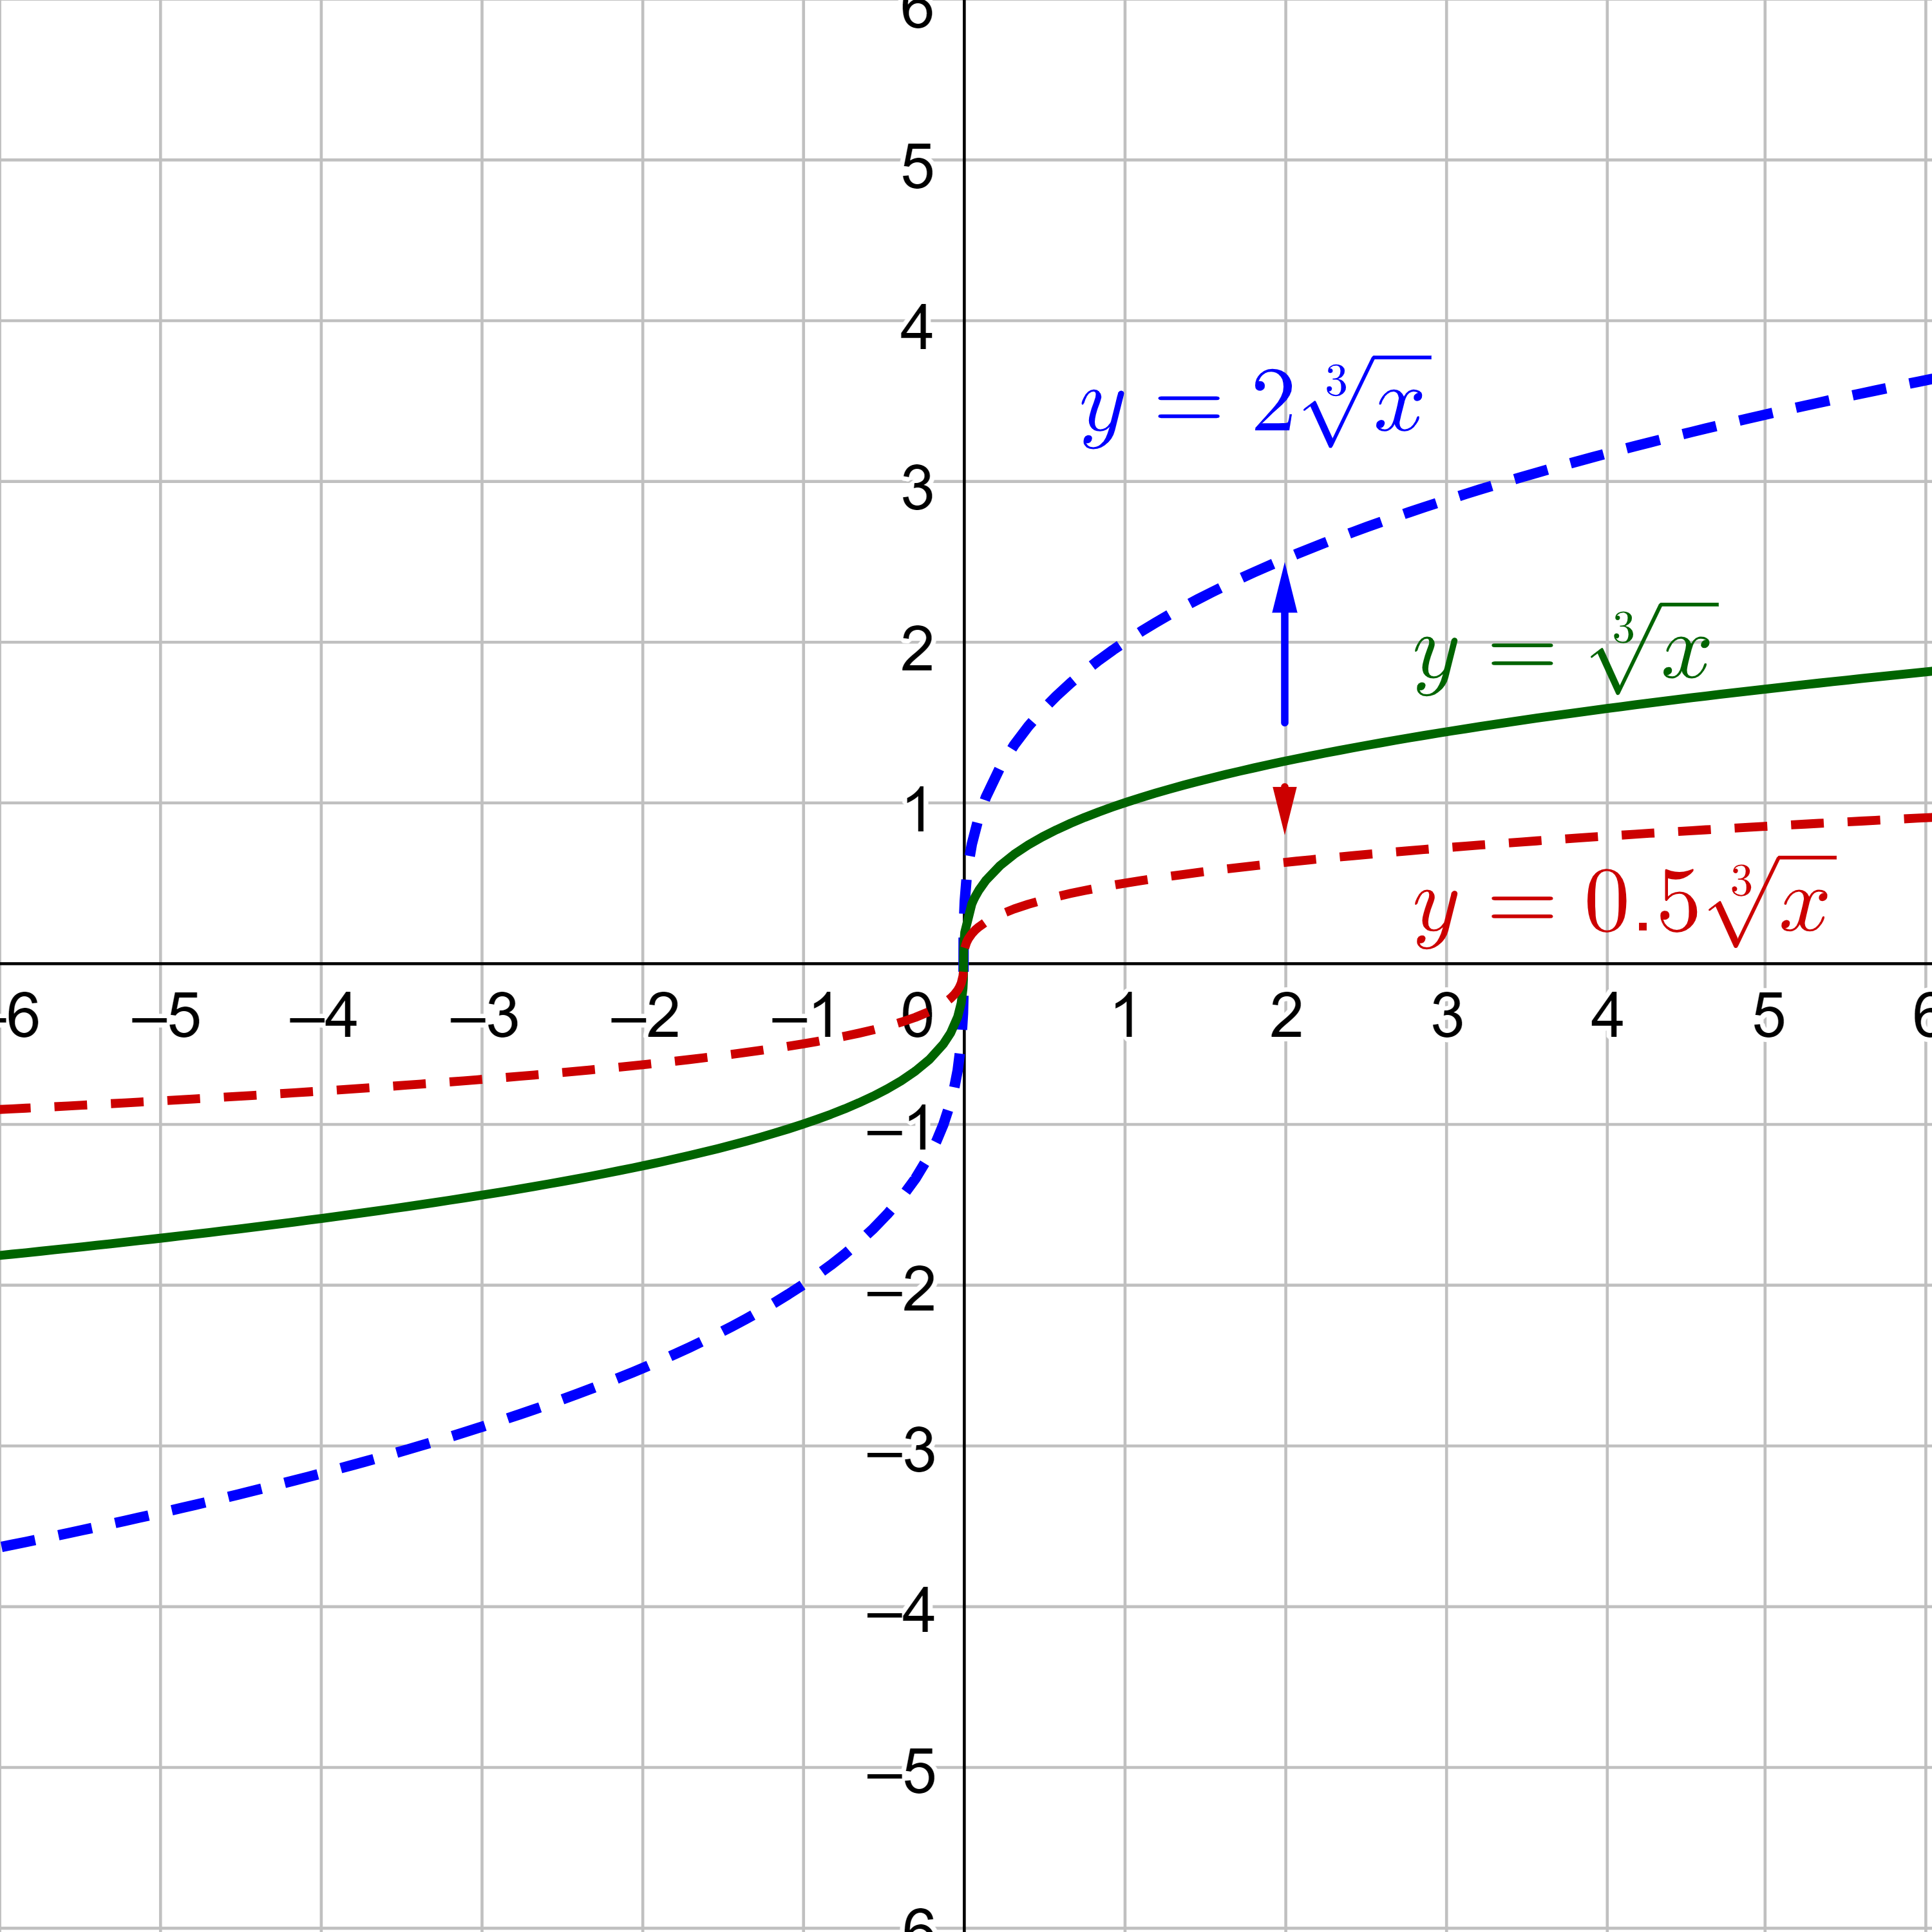
Multiplying the outside of a function results in multiplying the y-values. Multiplying a function by a number greater than 1 makes the graph taller, or stretched vertically. Multiplying the function by a number between 0 and 1 makes the graph shorter, or shrunk vertically. For example, multiplying the function by 2 would produce a graph that is twice as tall. Likewise multiplying by 0.5 results in a graph that is half as tall.
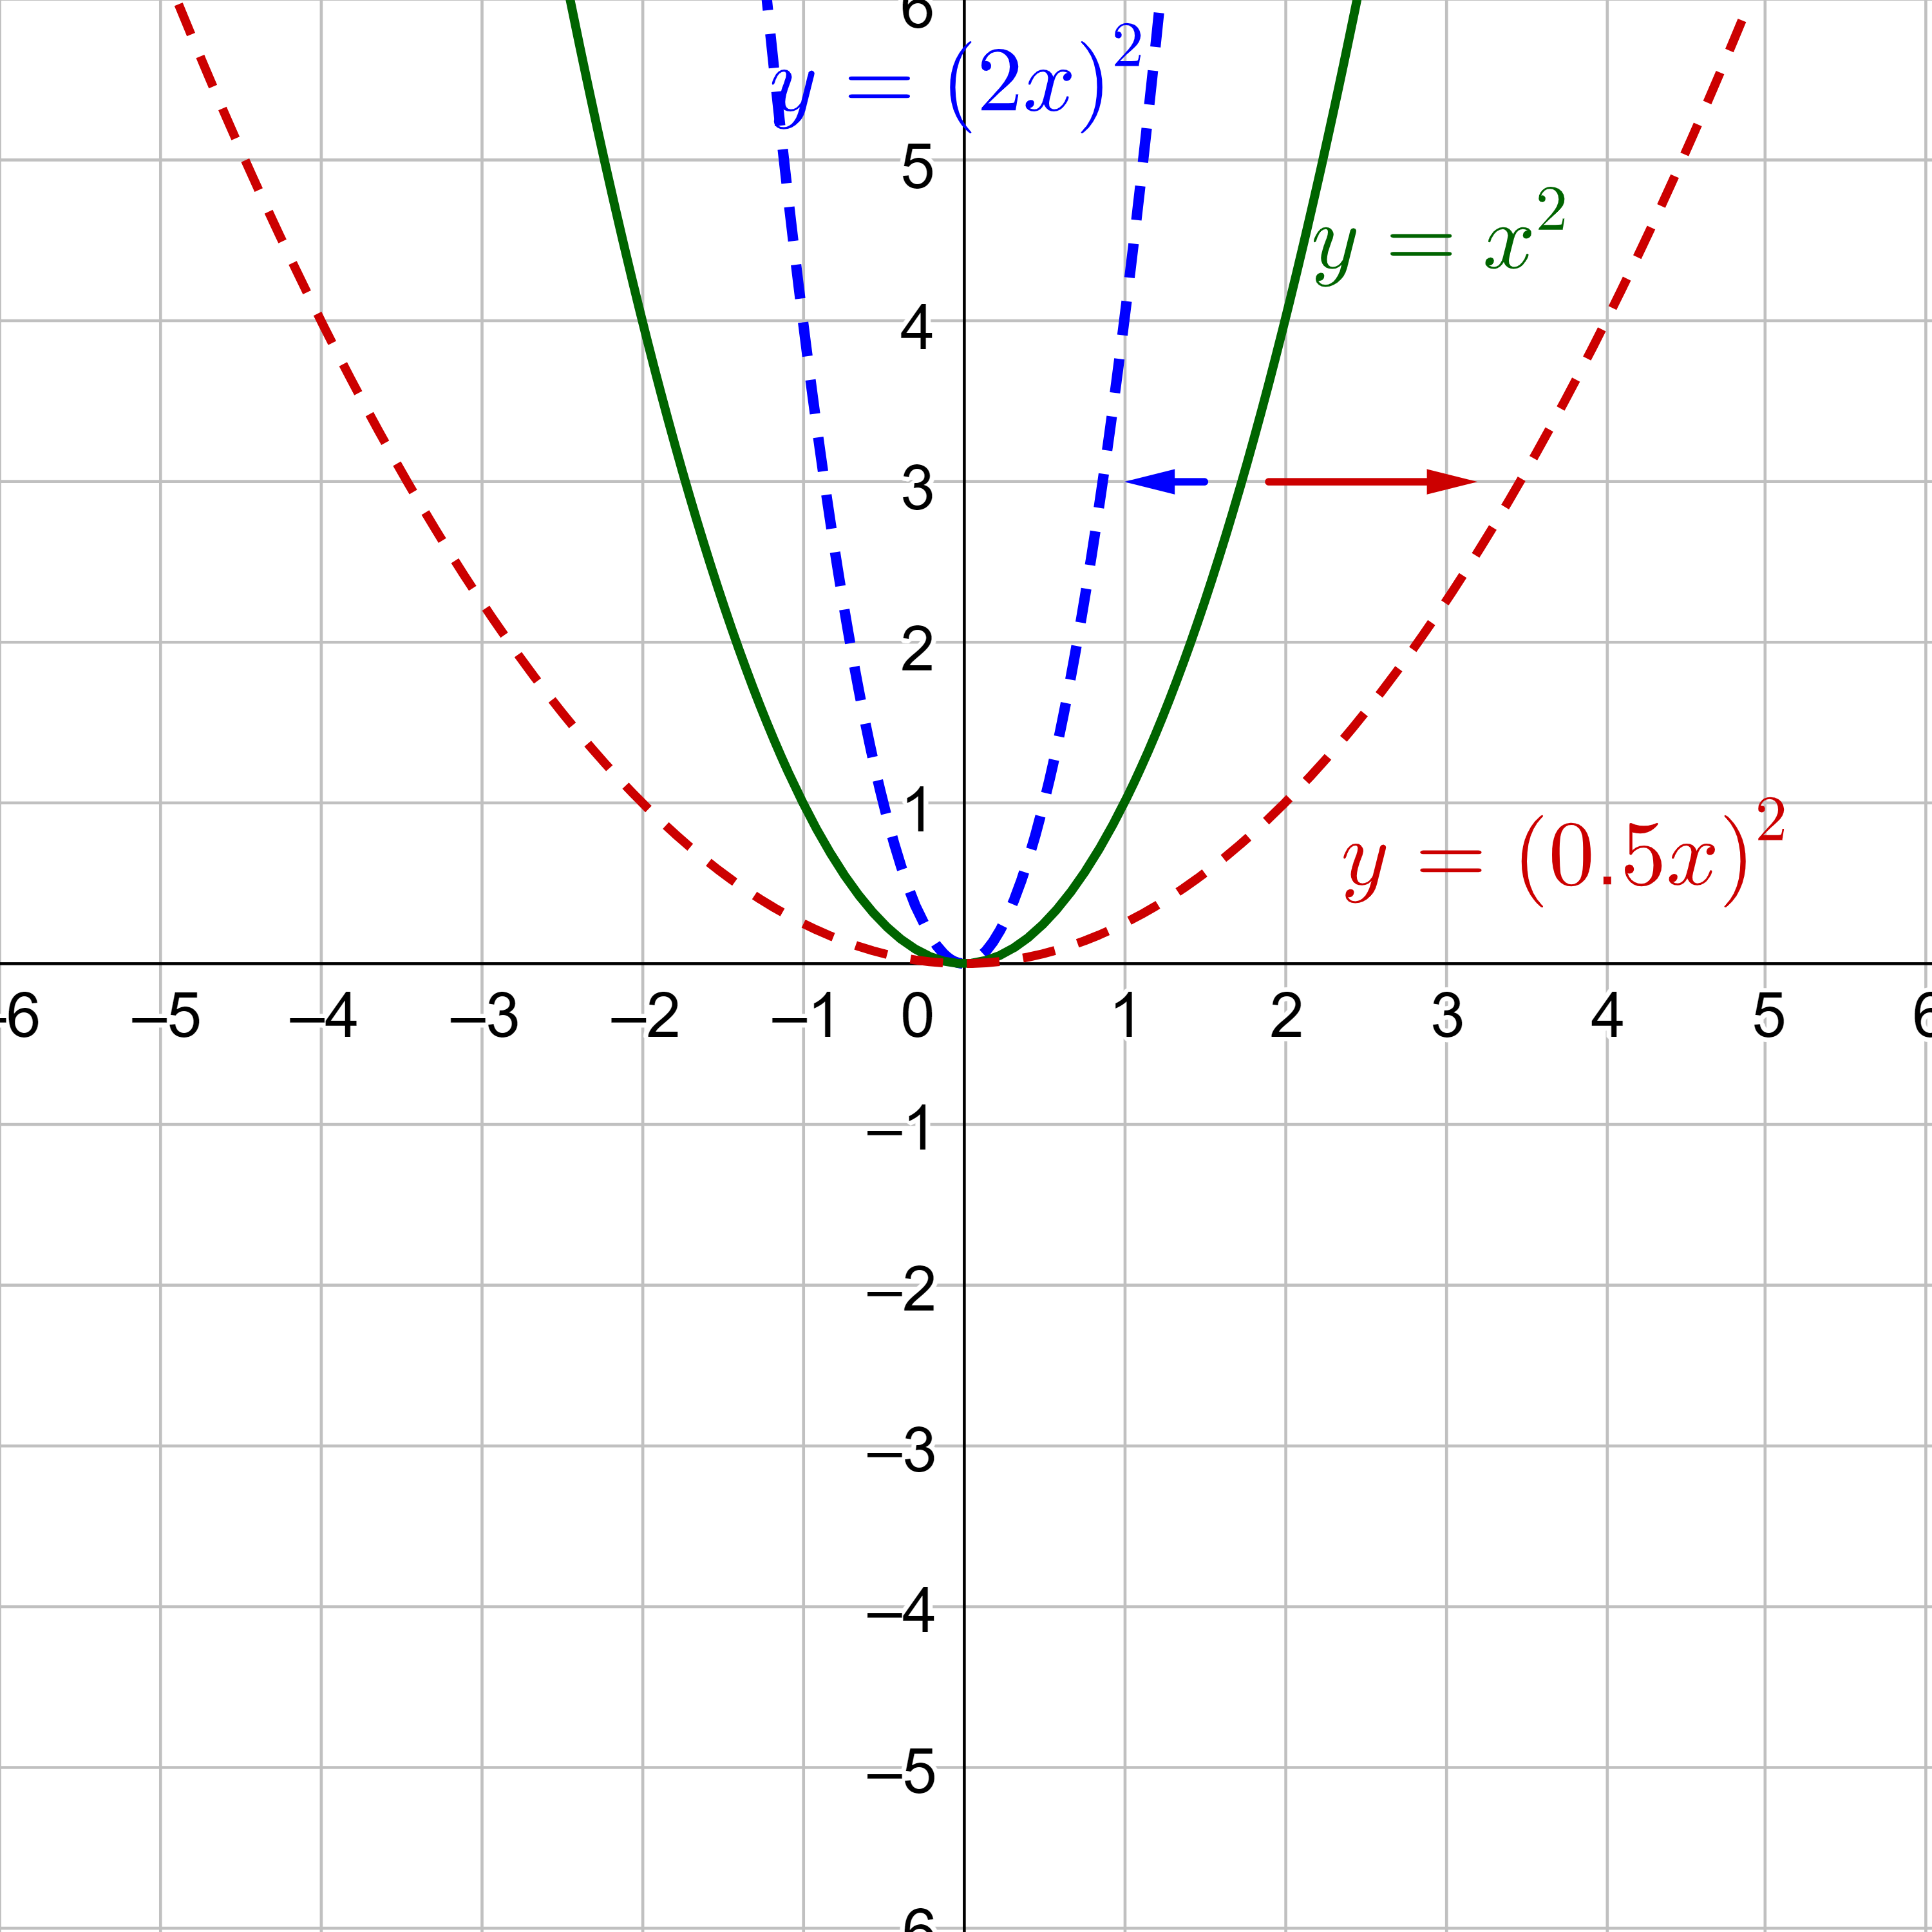
Multiplying the input inside a function results in the opposite of what might be expected. Multiplying the x by a number greater that 1 makes the graph skinnier, or shrunk horizontally. Multiplying the x by a number between 0 and 1 will make the graph wider, or stretched horizontally. For example, multiplying the input by 2 would produce a graph that is half as wide. But multiplying the input by 0.5 results in a graph that is twice as wide, or stretched horizontally.
Vertical stretch or shrink occurs when the function is multiplied by a number.
y = af(x)
Horizontal stretch or shrink occurs when the input is multiplied by a number.
y = f(bx)
If y = af(bx), then graph by
The function B(t) models the population of a certain bacteria in a petri dish. The graph is shown in figure 17.
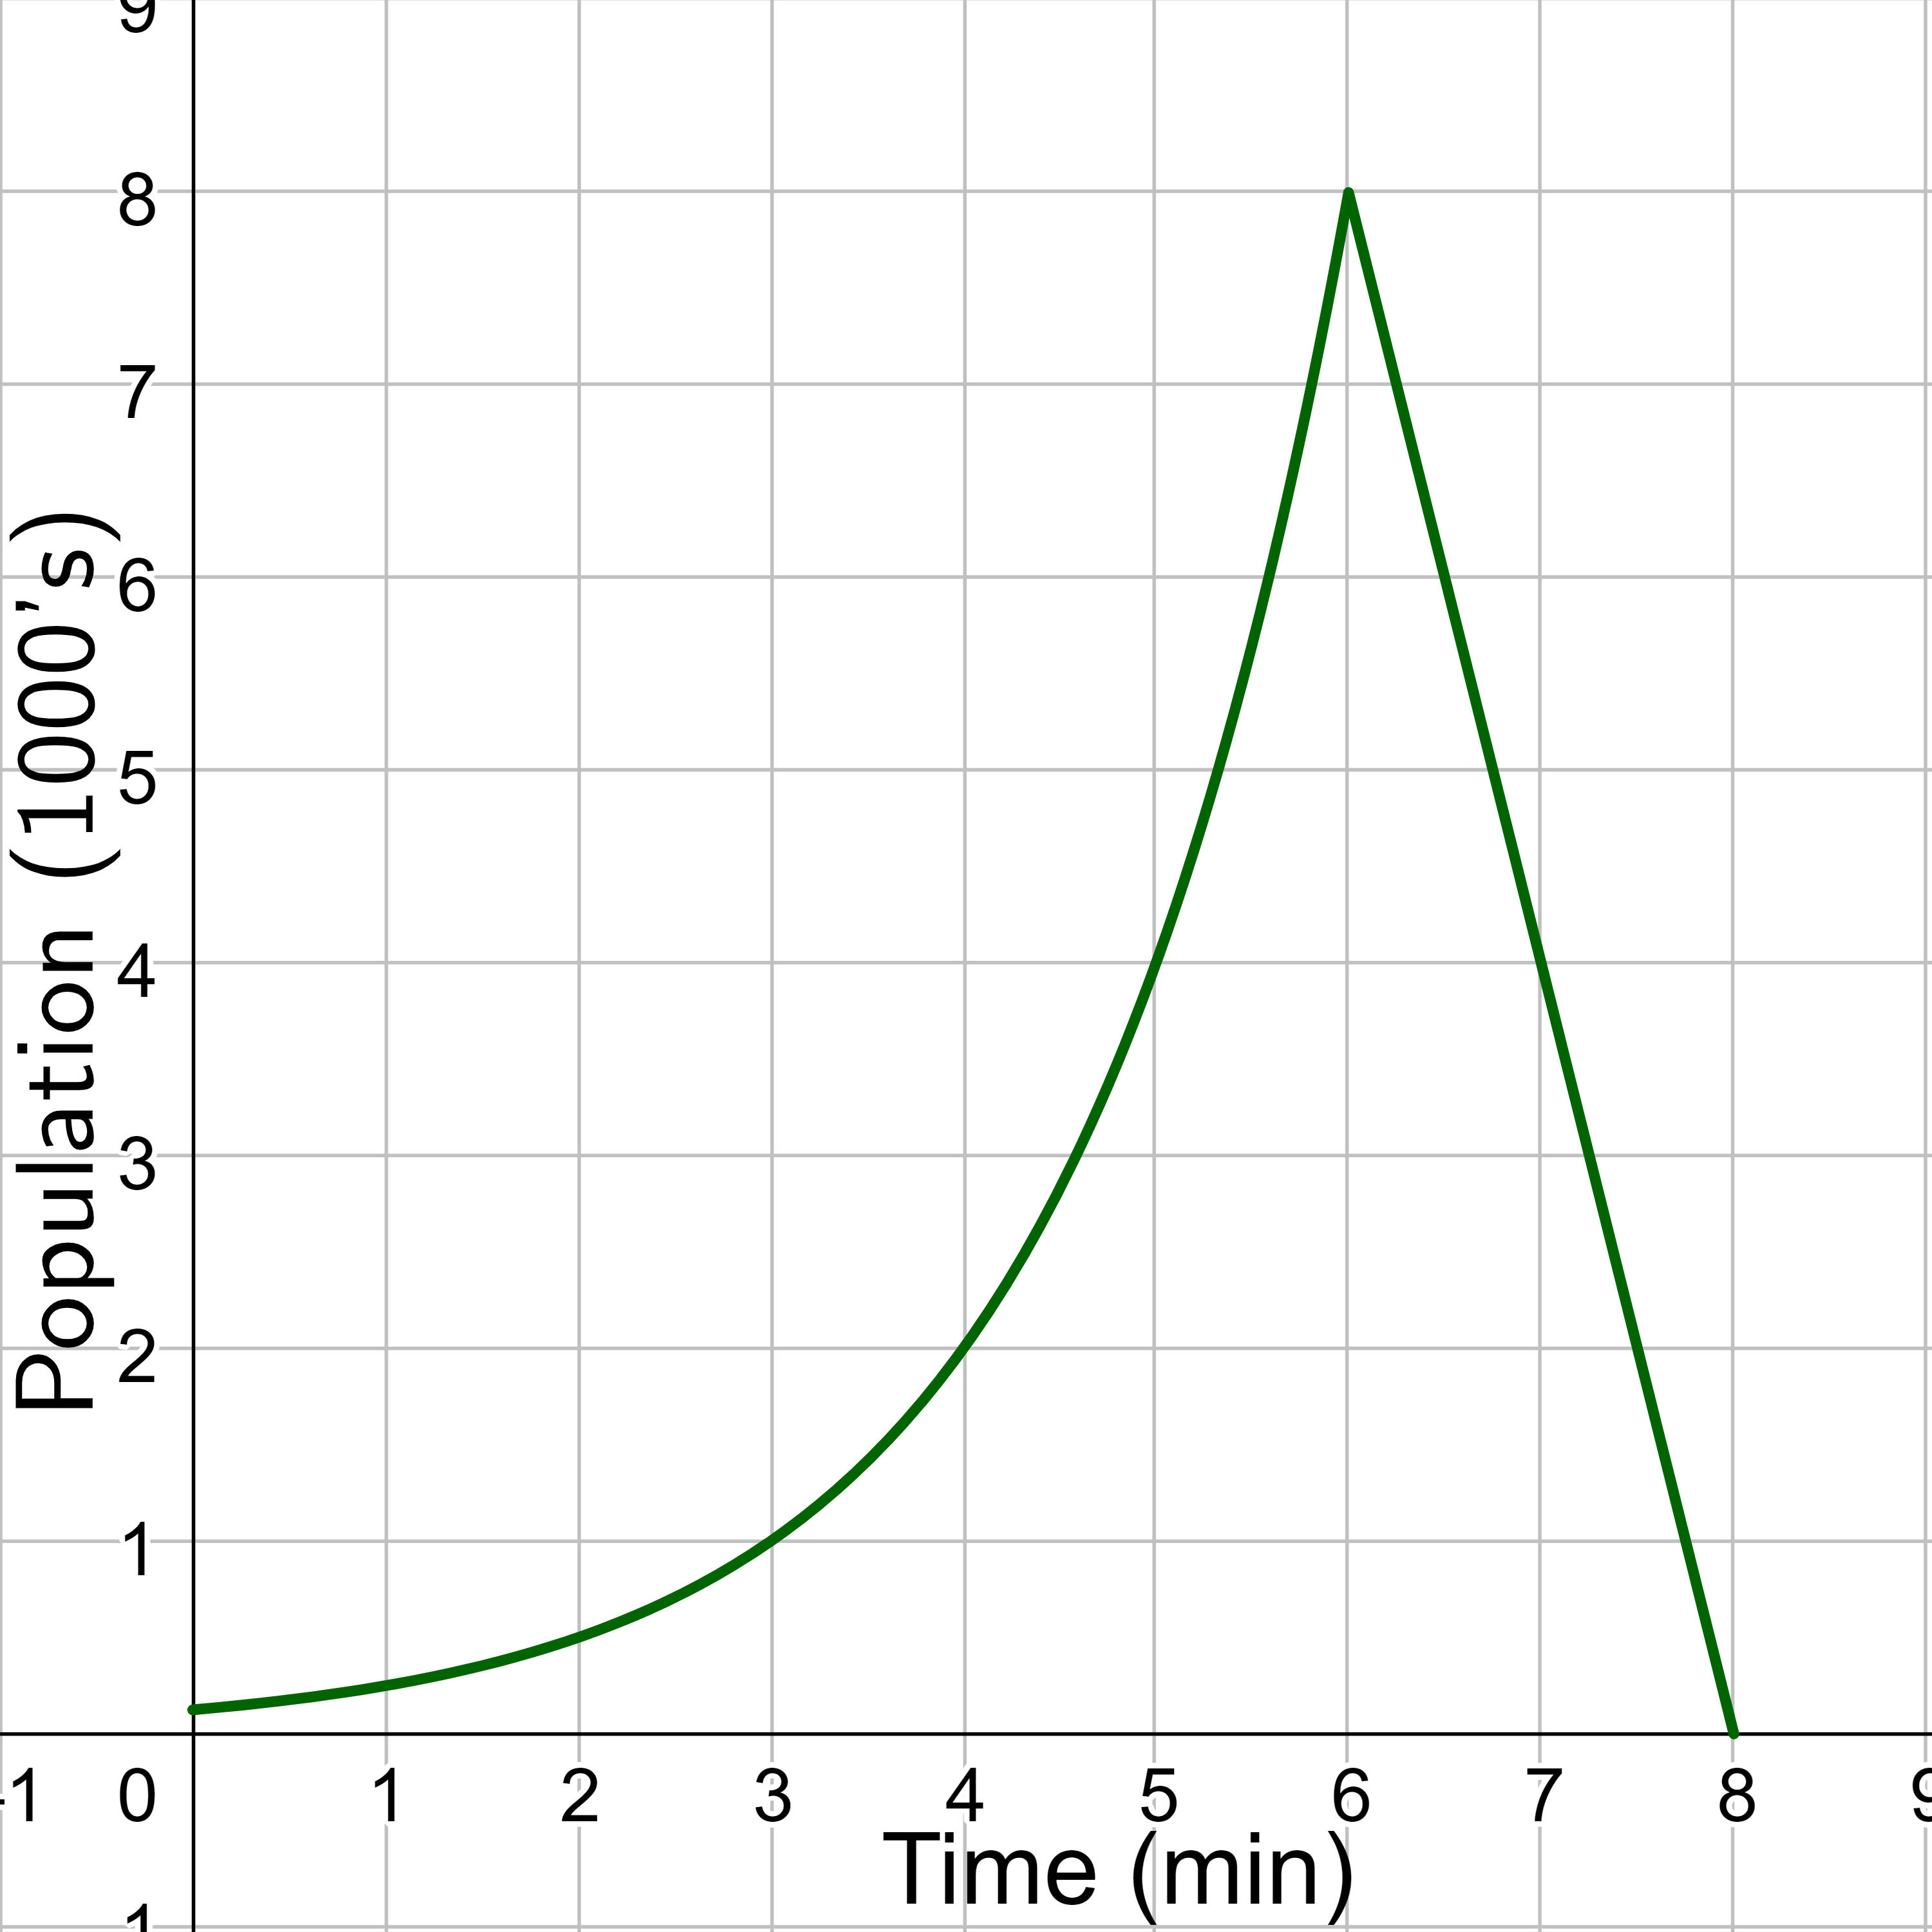
A scientist is comparing this population to another population, C, whose growth follows the same pattern but is half as large. Sketch a graph of this population.
Solution
Because the population is always half as large, the new population's output values are always half the original function's output values. Multiply all the y-values by ½ while leaving the t-values the same. This will produce a graph that is half as high which is a vertical shrink.
Choose some convenient reference points, (0, 0.1), (3, 1), (4, 2), (5, 4), (6, 8), (7, 4), and (8, 0). Then multiply all of the y-values by ½. The following shows where the new points for the new graph will be located.
(0, 0.1) → (0, 0.05)
(3, 1) → (3, 0.5)
(4, 2) → (4, 1)
(5, 4) → (5, 2)
(6, 8) → (6, 4)
(7, 4) → (7, 2)
(8, 0) → (8, 0)
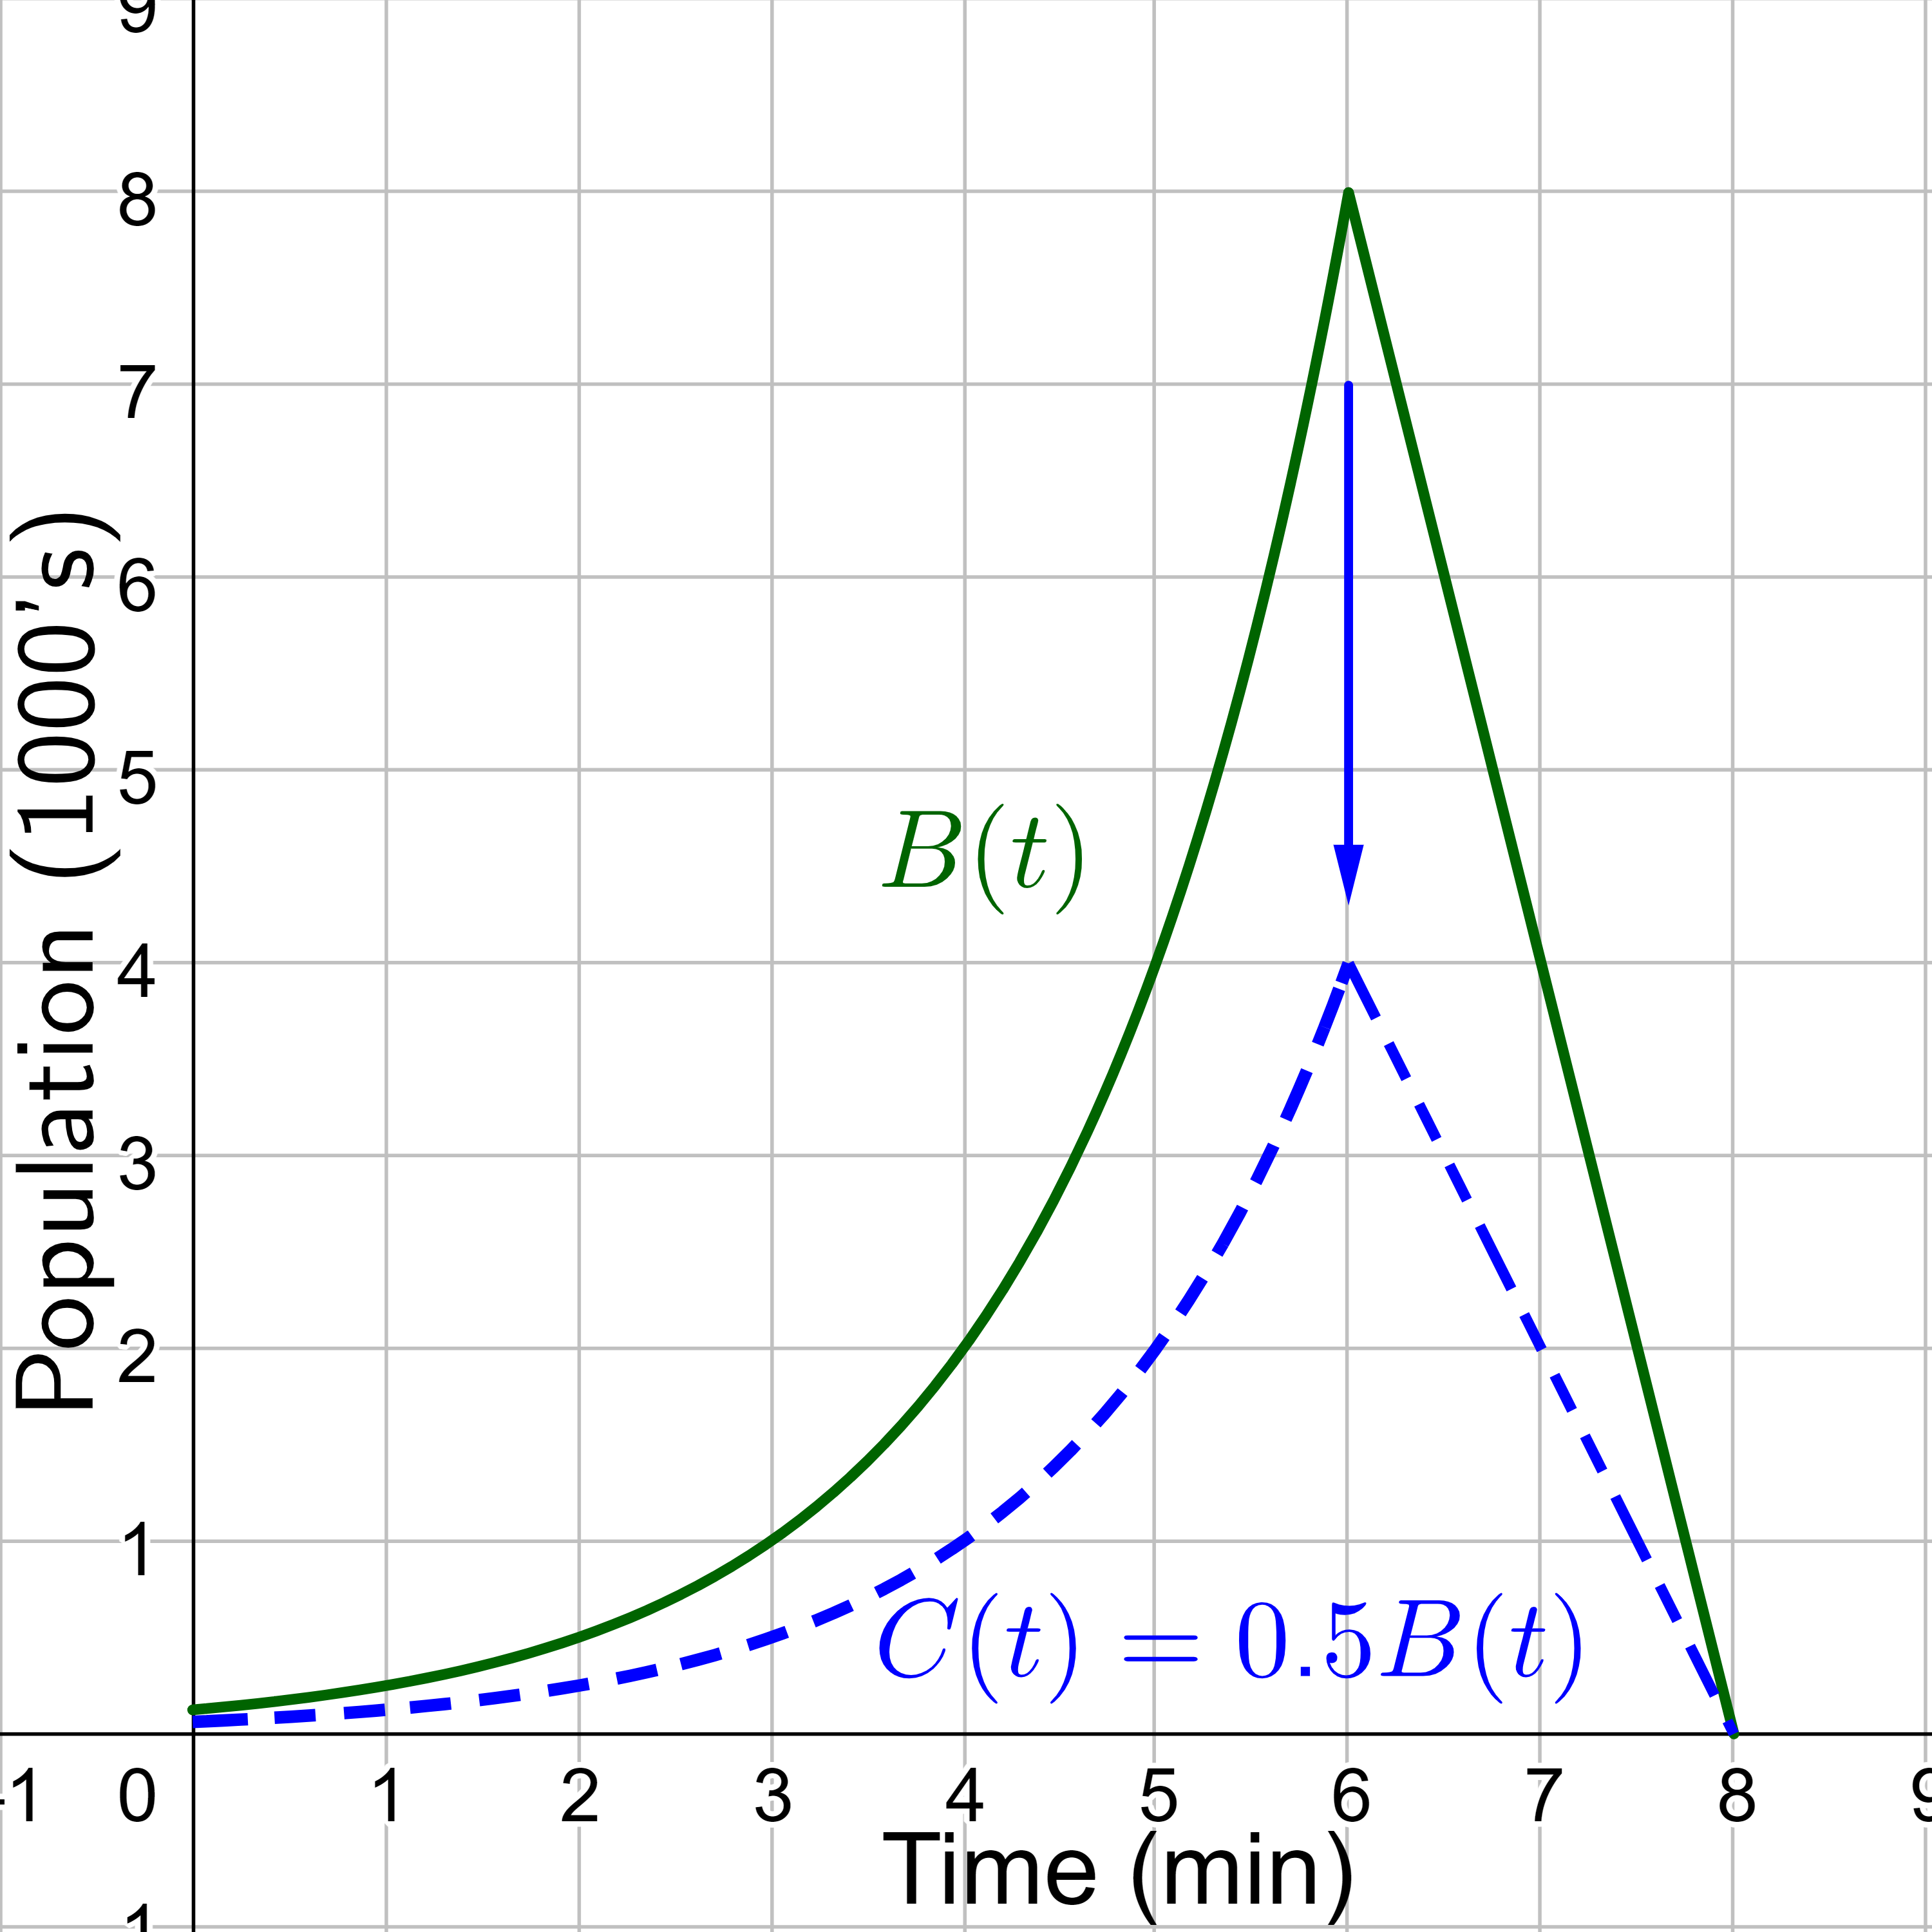
Symbolically, the relationship is written as
C(t) = 0.5B(t)
Write the equation for the function that is the quadratic parent function stretched vertically by a factor of 3, and then translated down by 4 units.
Answer
y = 3x2 − 4
The function B(t) models the population of a certain bacteria in a petri dish. The graph is shown in figure 19.
Suppose a scientist is comparing a population of bacteria to a population that progresses through its lifespan twice as fast as the original population. In other words, this new population, D, will progress in 1 minute the same amount as the original population does in 2 minutes, and in 2 minutes, it will progress as much as the original population does in 4 minutes. Sketch a graph of this population.
Solution
Because the time is cut in half, the description is a horizontal shrink by a factor of 1/2. This means we want D(2) = B(4) and D(3) = B(6). In general, that means that D(t) = B(2t). Remember that a horizontal stretch or shrink is by a factor of \(\frac{1}{b}\). In this case, the horizontal shrink factor is \(\frac{1}{2}\), so b = 2.
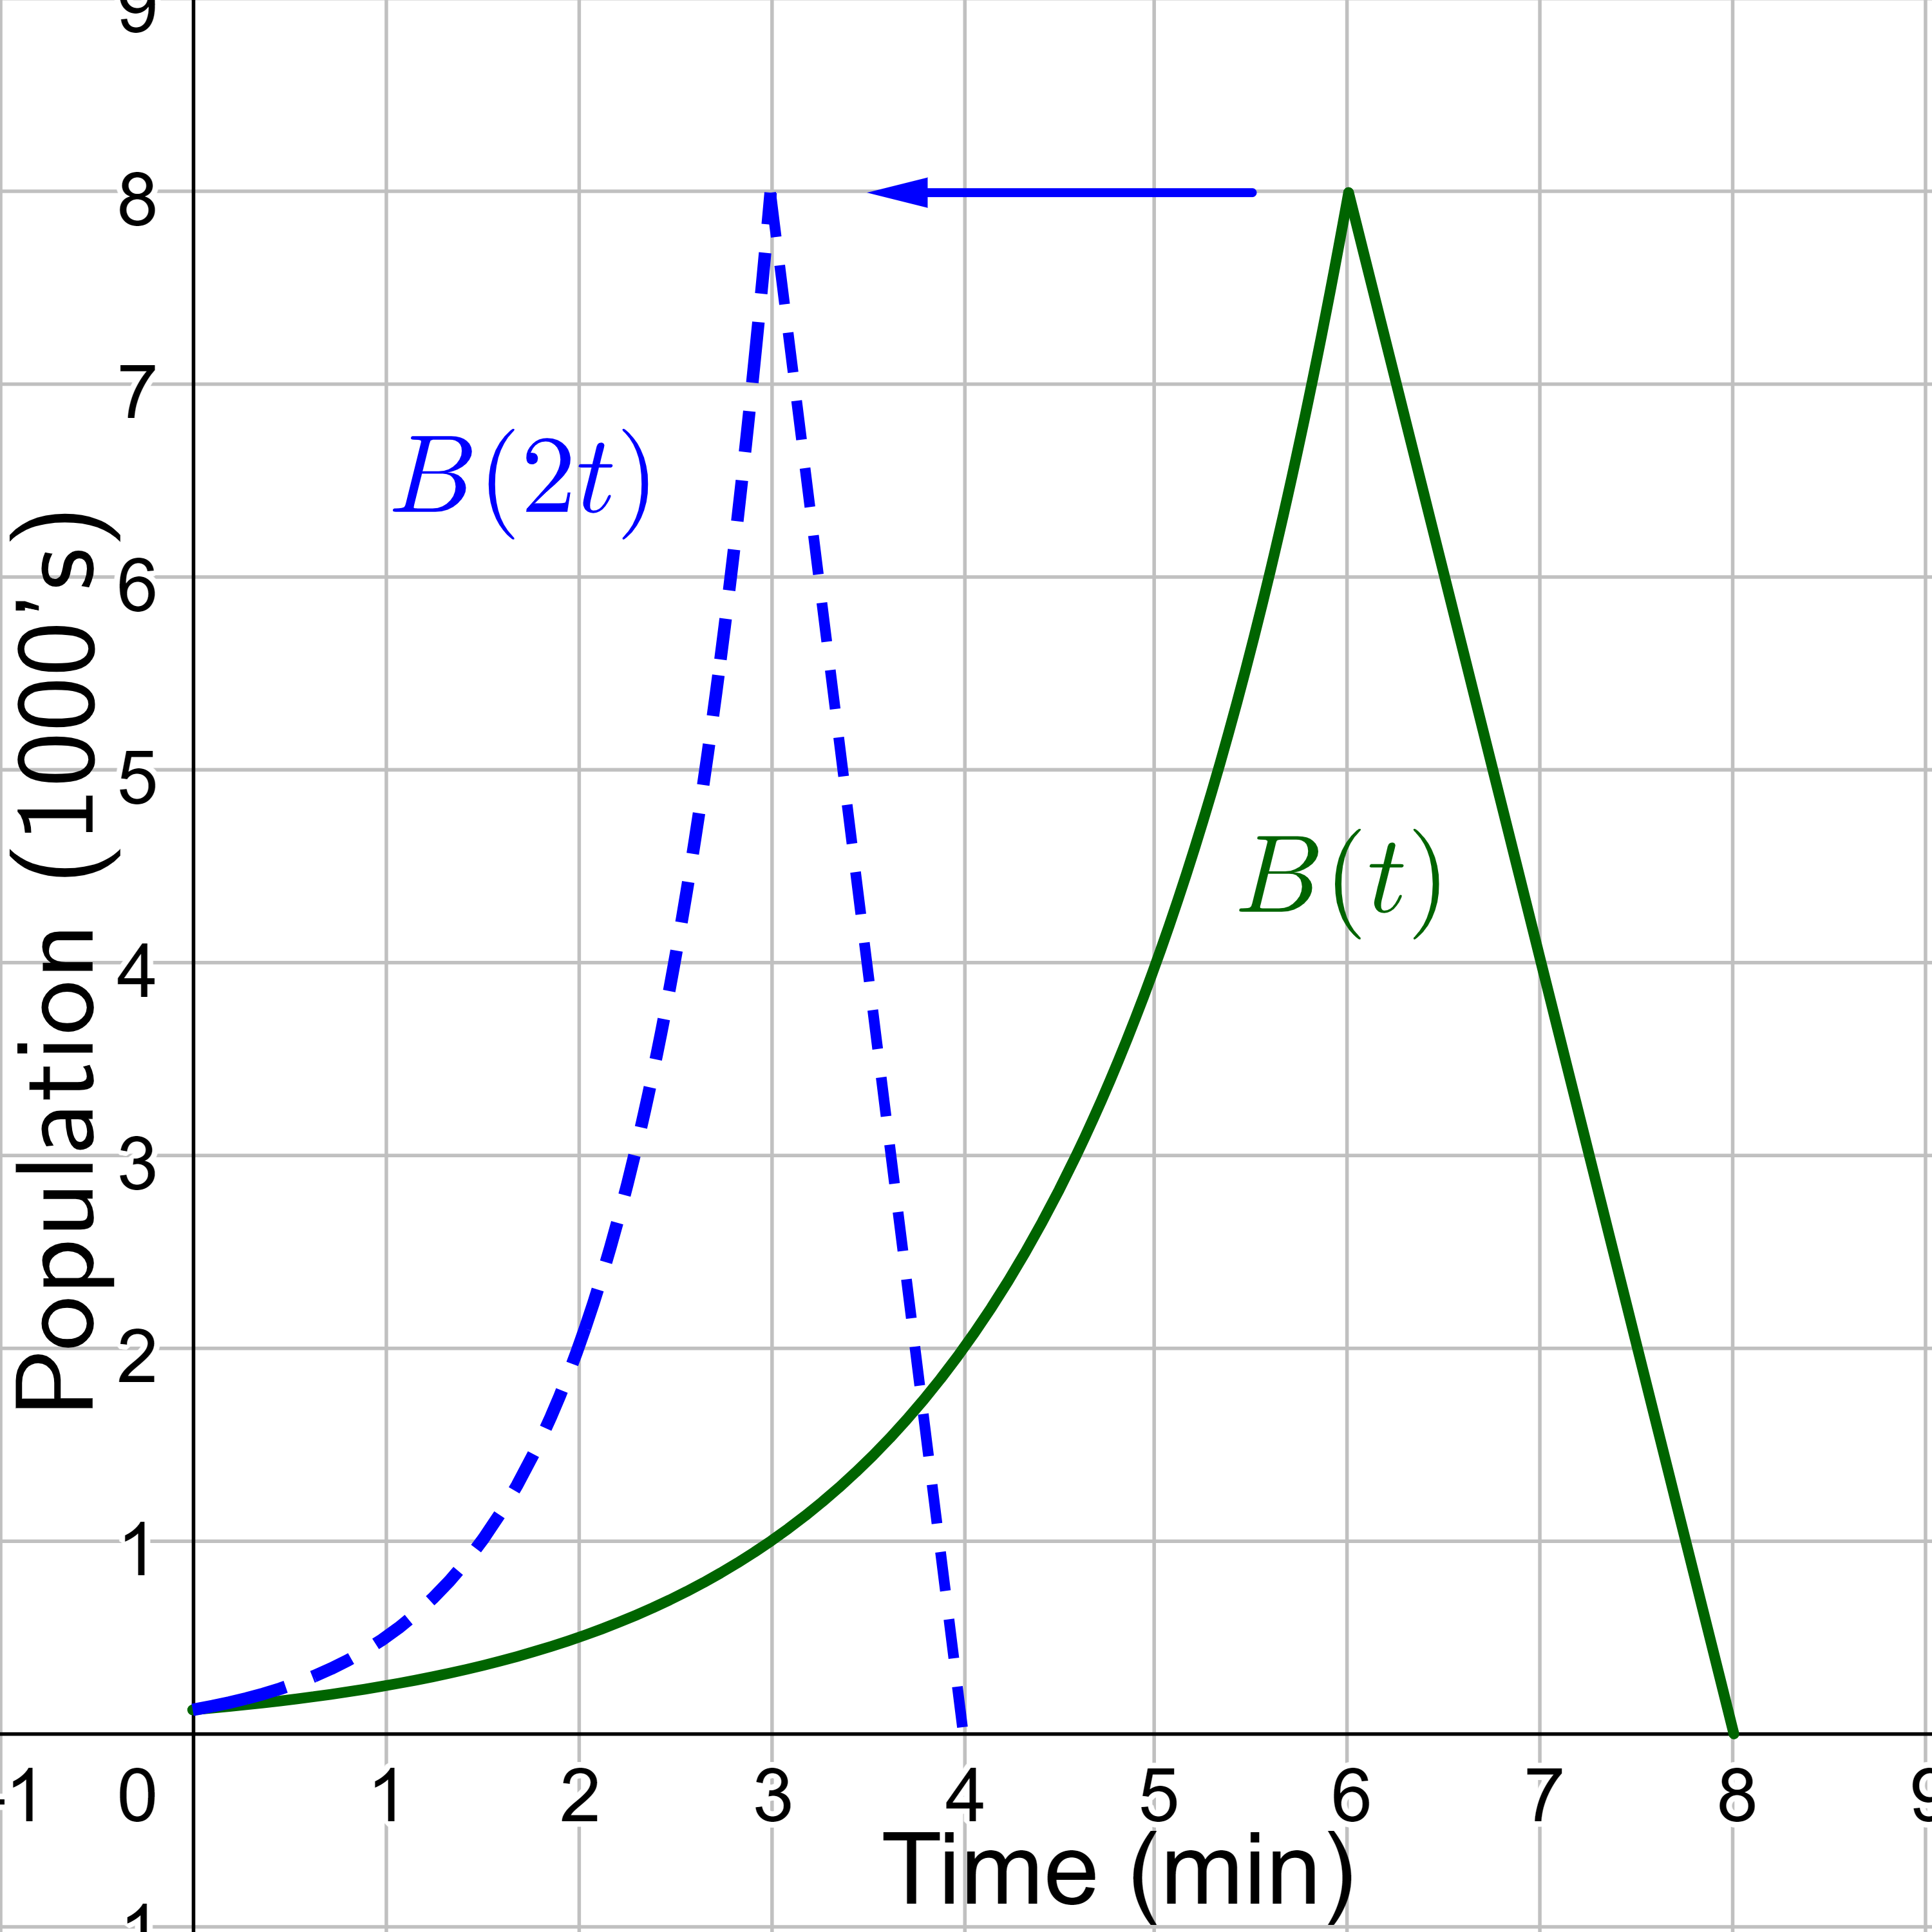
D(t) = B(2t)
Write an equation for the parent cubic function horizontally stretched by a factor of 3.
Answer
\(y = \left(\frac{1}{3}x\right)^3\)
When combining transformations, it is very important to consider the order of the transformations. For example, vertically transforming by 3 and then vertically stretching by 2 does not create the same graph as vertically stretching by 2 and then vertically translating by 3. This is because when the translation is first, both the original function and the translation get stretched, while only the original function gets stretched when the stretch is first.
In general, follow the order of operations to decide the order of transformations. The multiplying for the reflections, stretches, or shrinks should come before the addition for translations.
Horizontal transformations are a little counterintuitive to think about. With the function g(x) = f(2x + 3), for example, think about how the inputs to the function g relate to the inputs to the function f. Suppose f(7) = 12. What input to g would produce that output? In other words, what value of x will allow g(x) = f(2x + 3) = 12? So 2x + 3 = 7. To solve for x, first subtract 3, resulting in a horizontal translation, and then divide by 2, causing a horizontal shrink.
This format ends up being very difficult to work with, because it is usually much easier to horizontally stretch a graph before translating. This can be fixed by factoring inside the function.
$$ f(bx + h) = f\left(b \left(x + \frac{h}{b}\right)\right) $$
Here is an example.
$$ f(x) = (2x + 5)^2 $$
Factor out the 2.
$$ f(x) = \left(2\left(x + \frac{5}{2}\right)\right)^2 $$
Now the order of operation can be followed. First do the horizontal shrink by a factor of 1/2, then the horizontal translation to the left of 5/2.
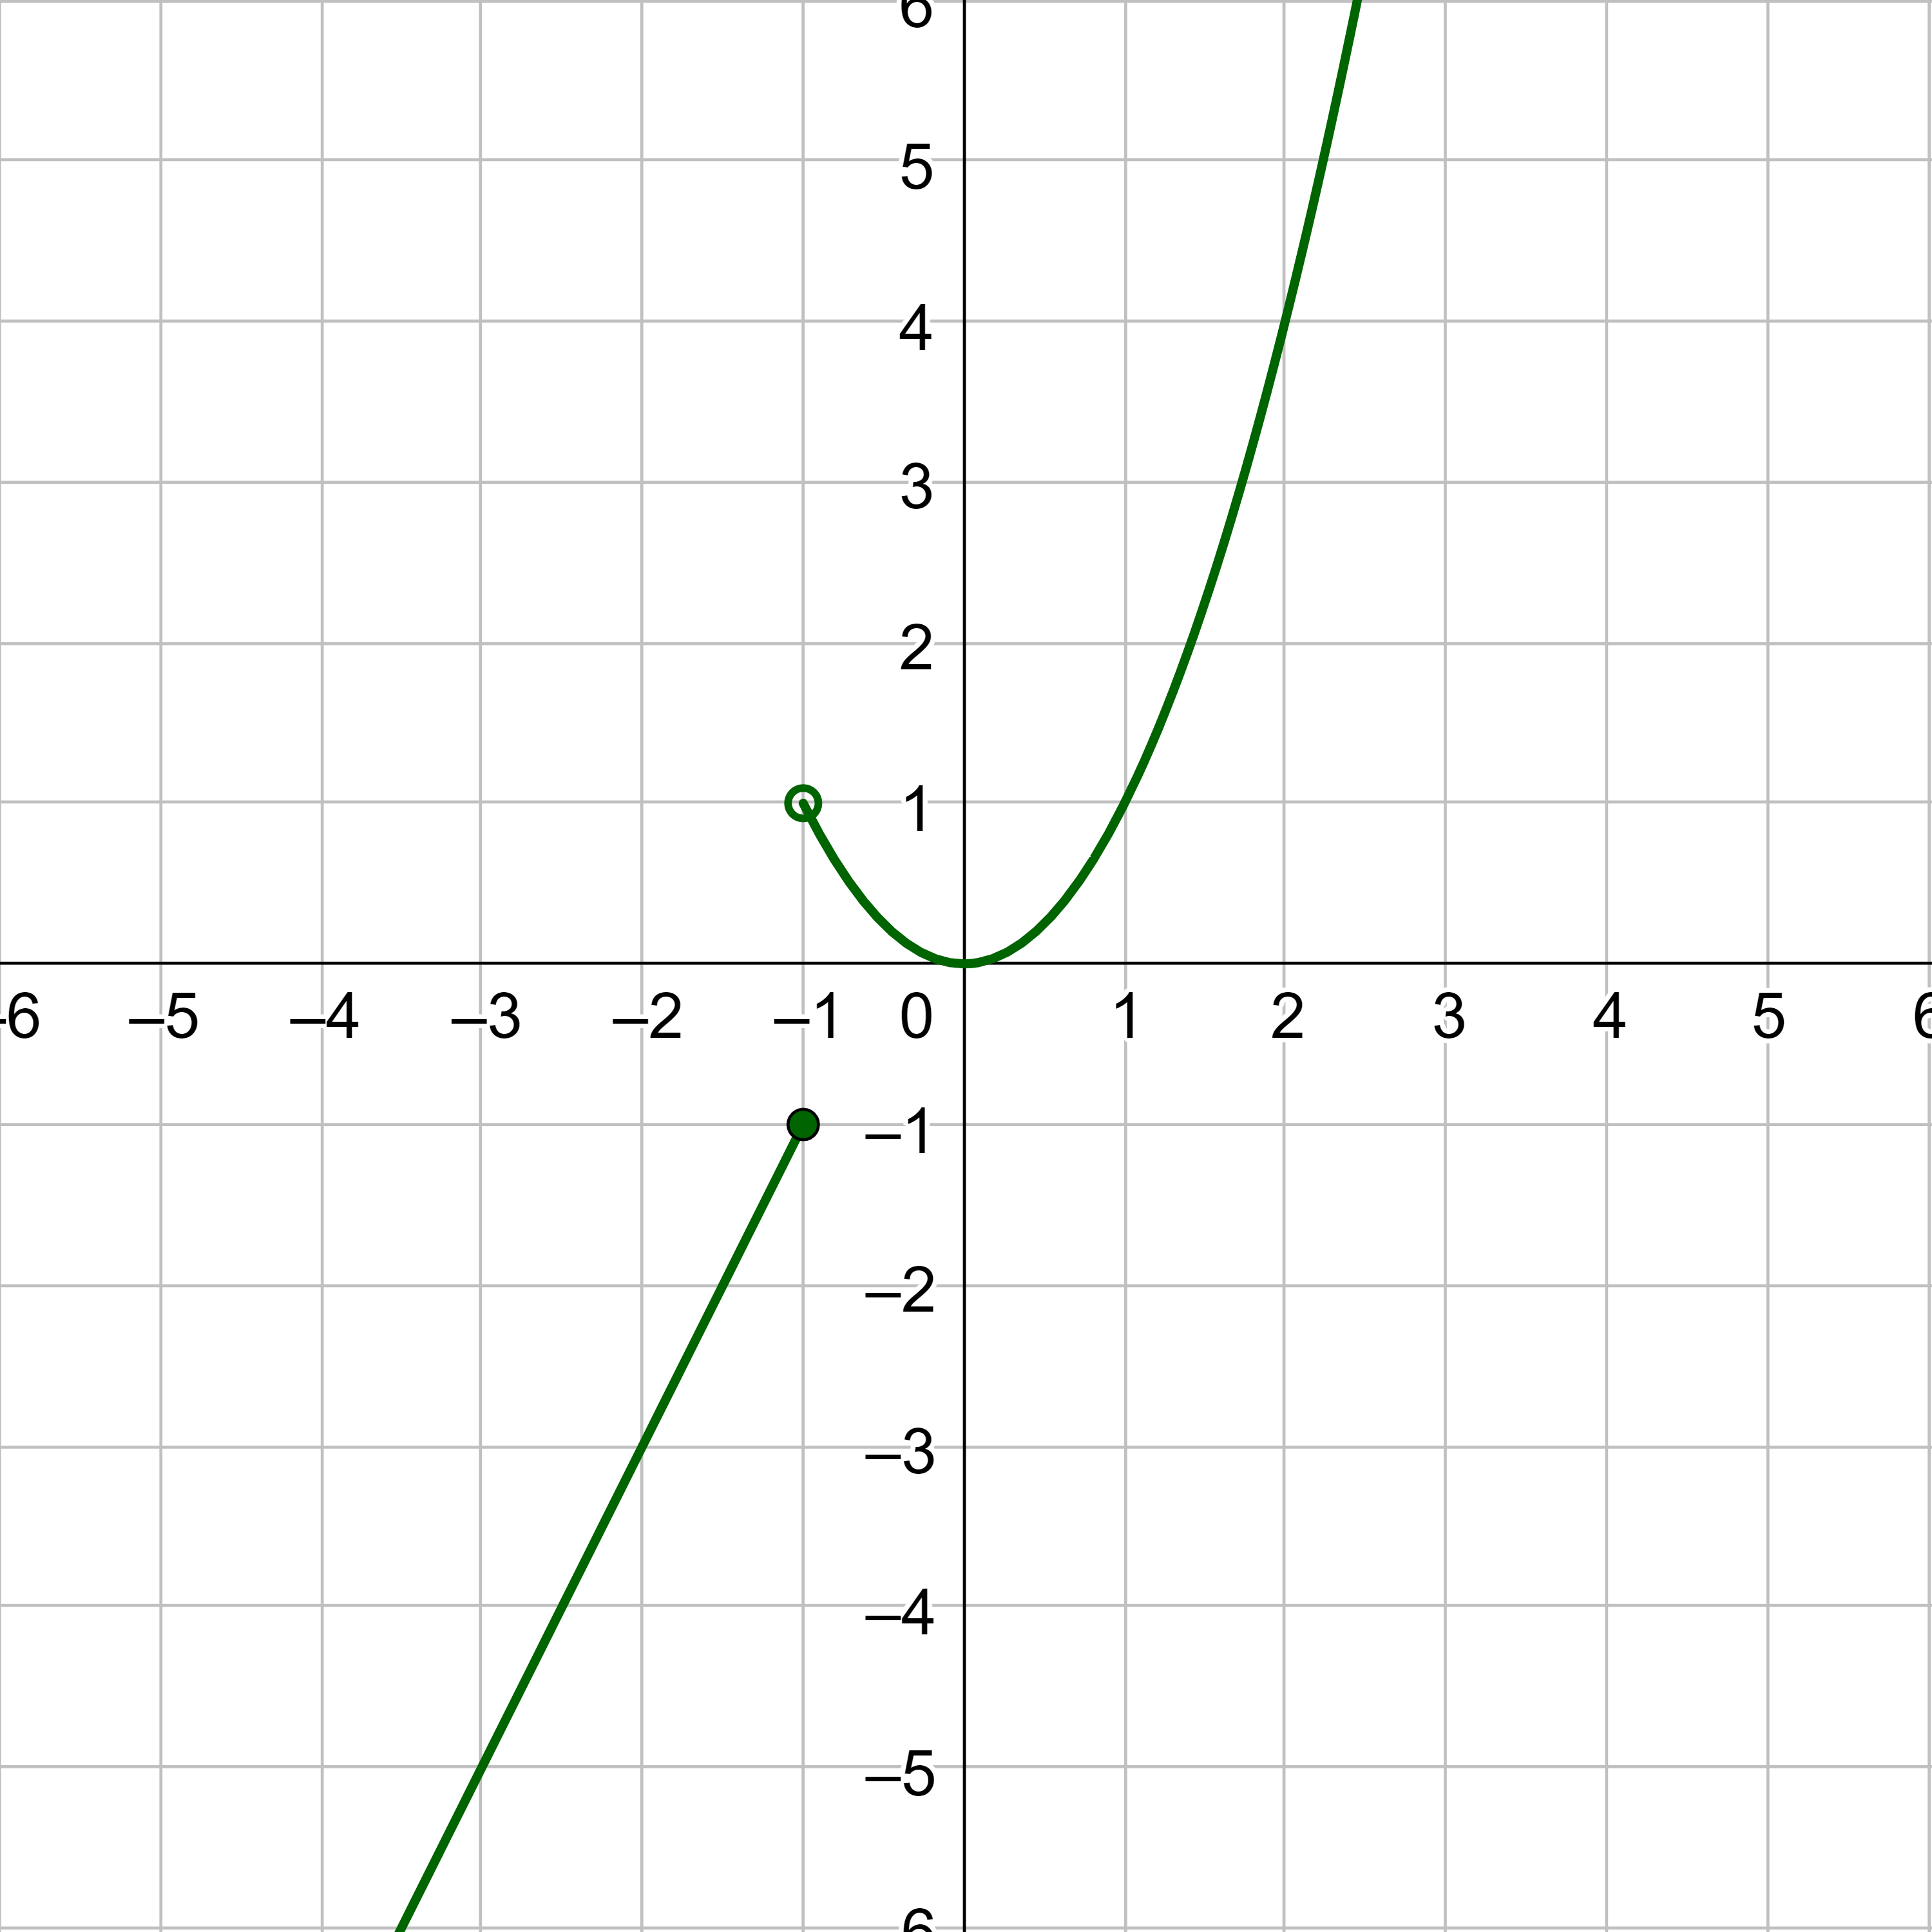
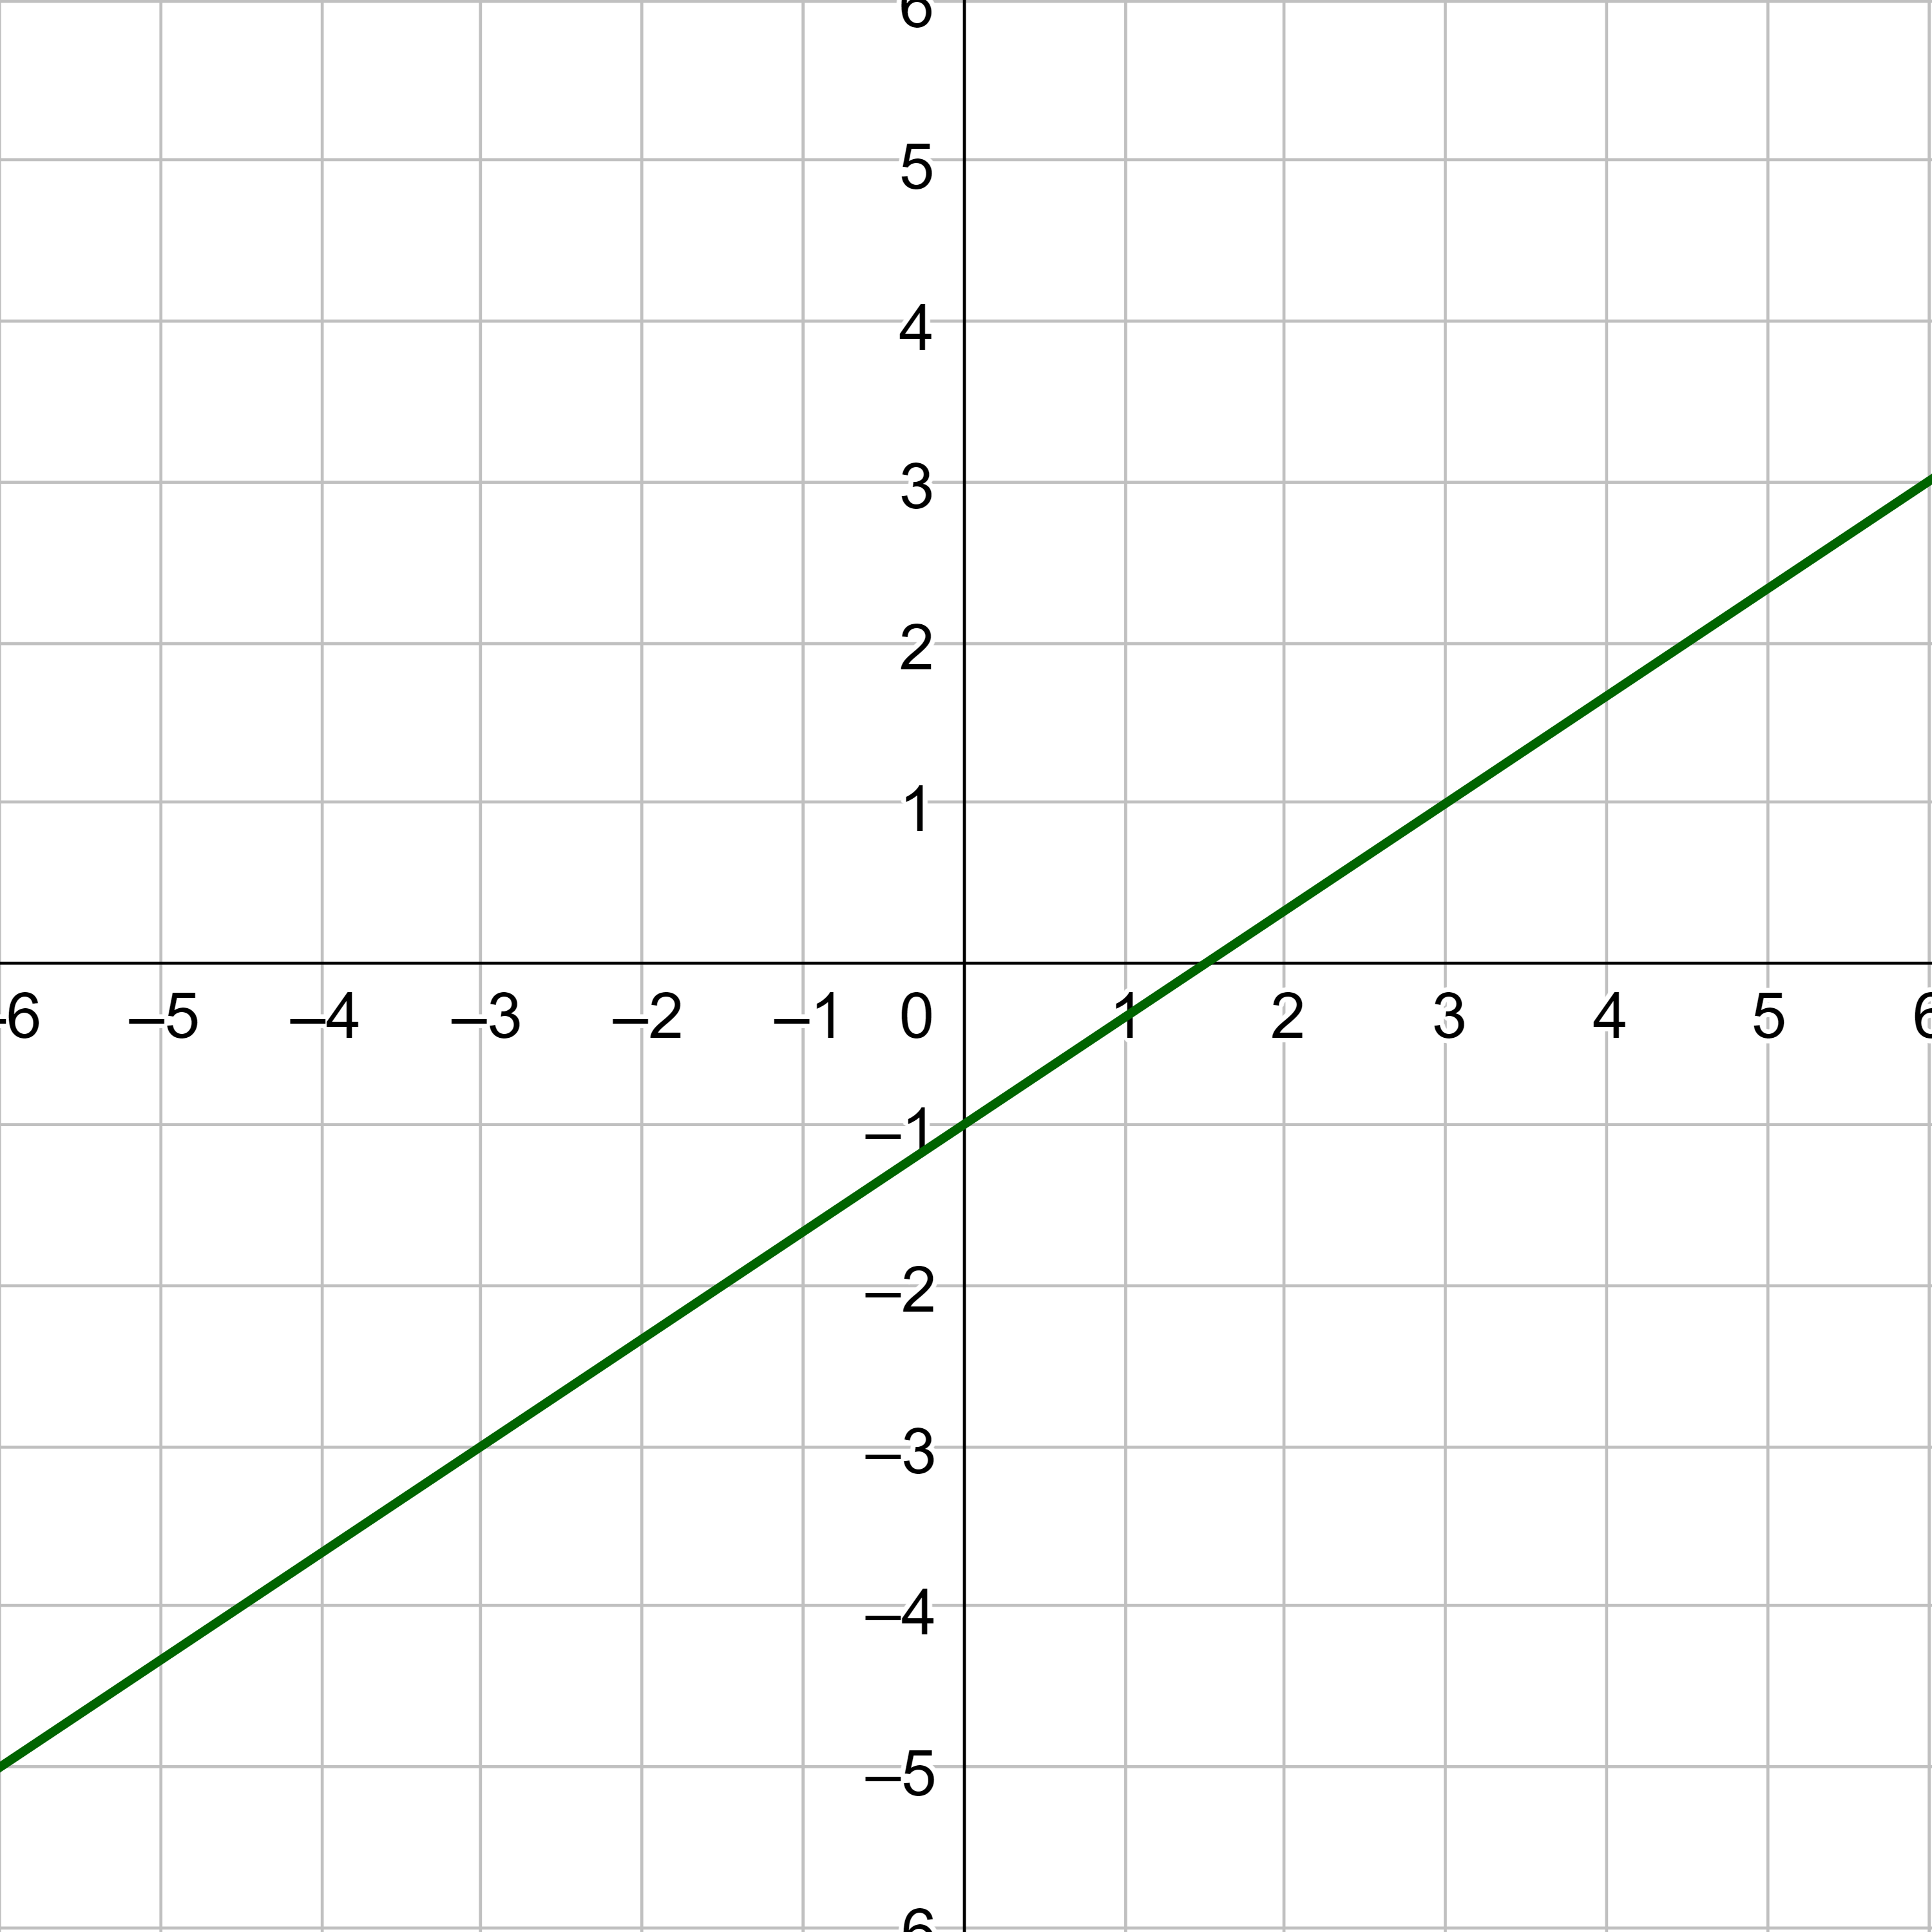
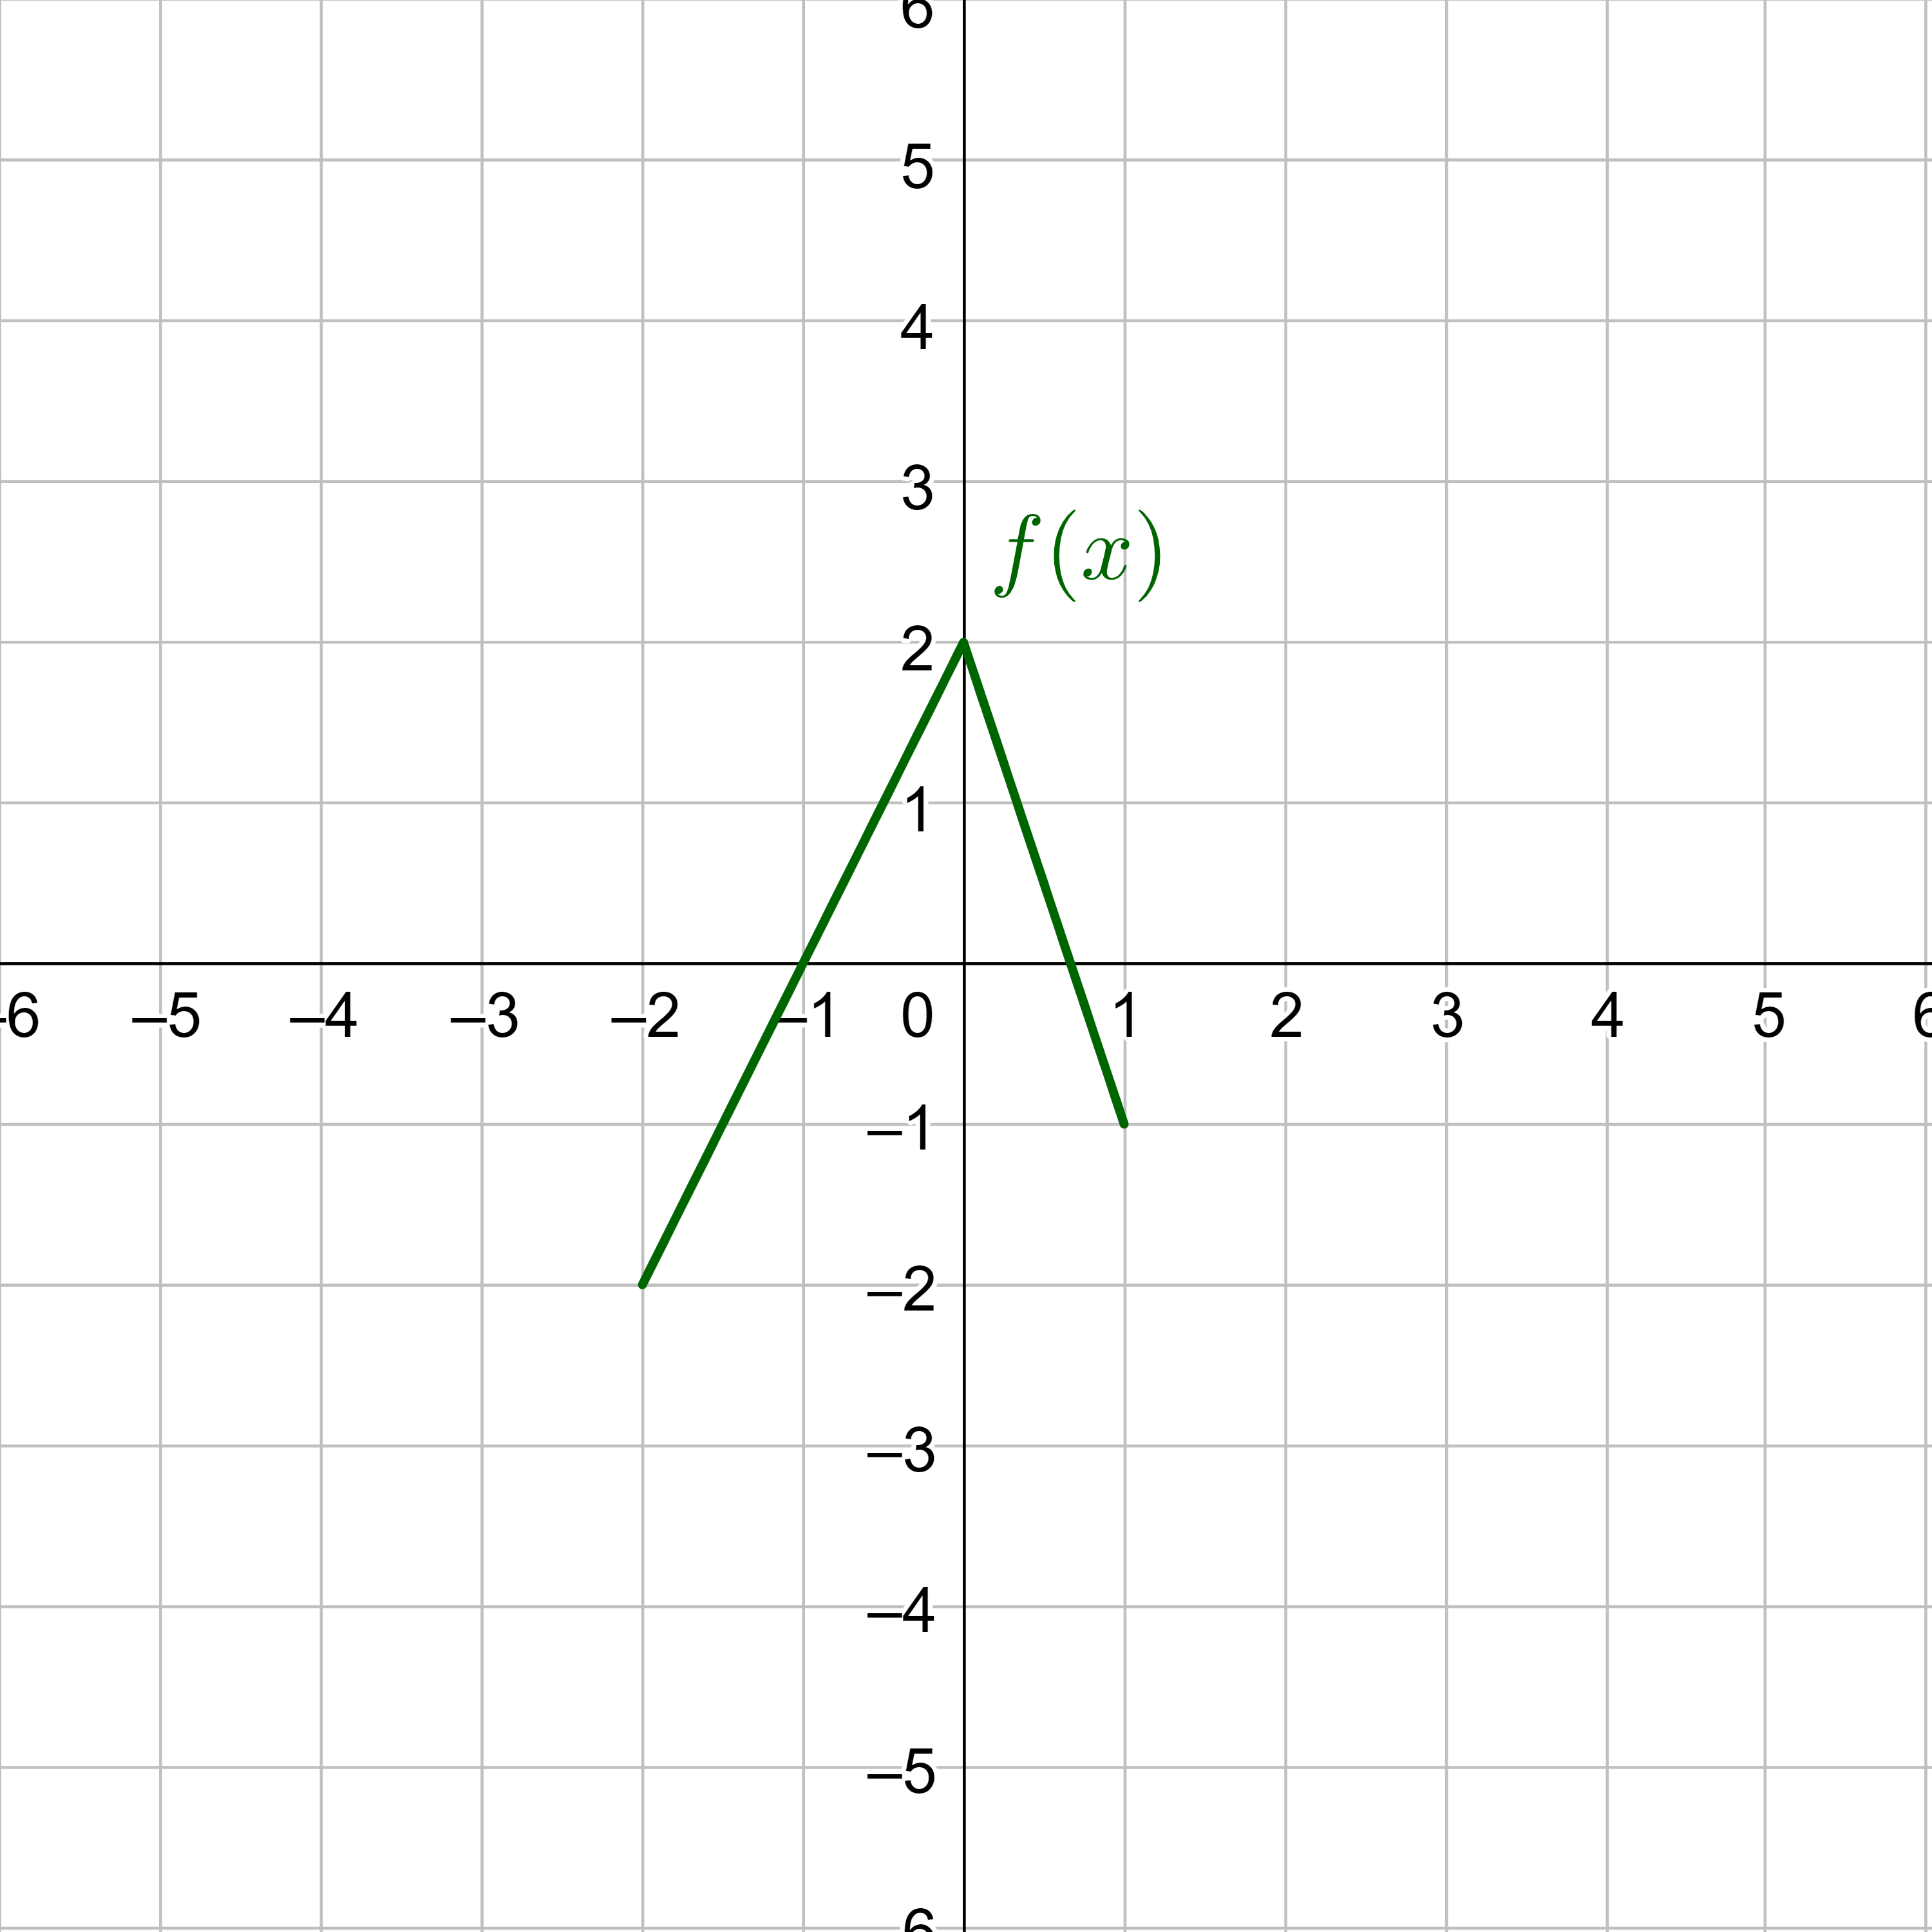
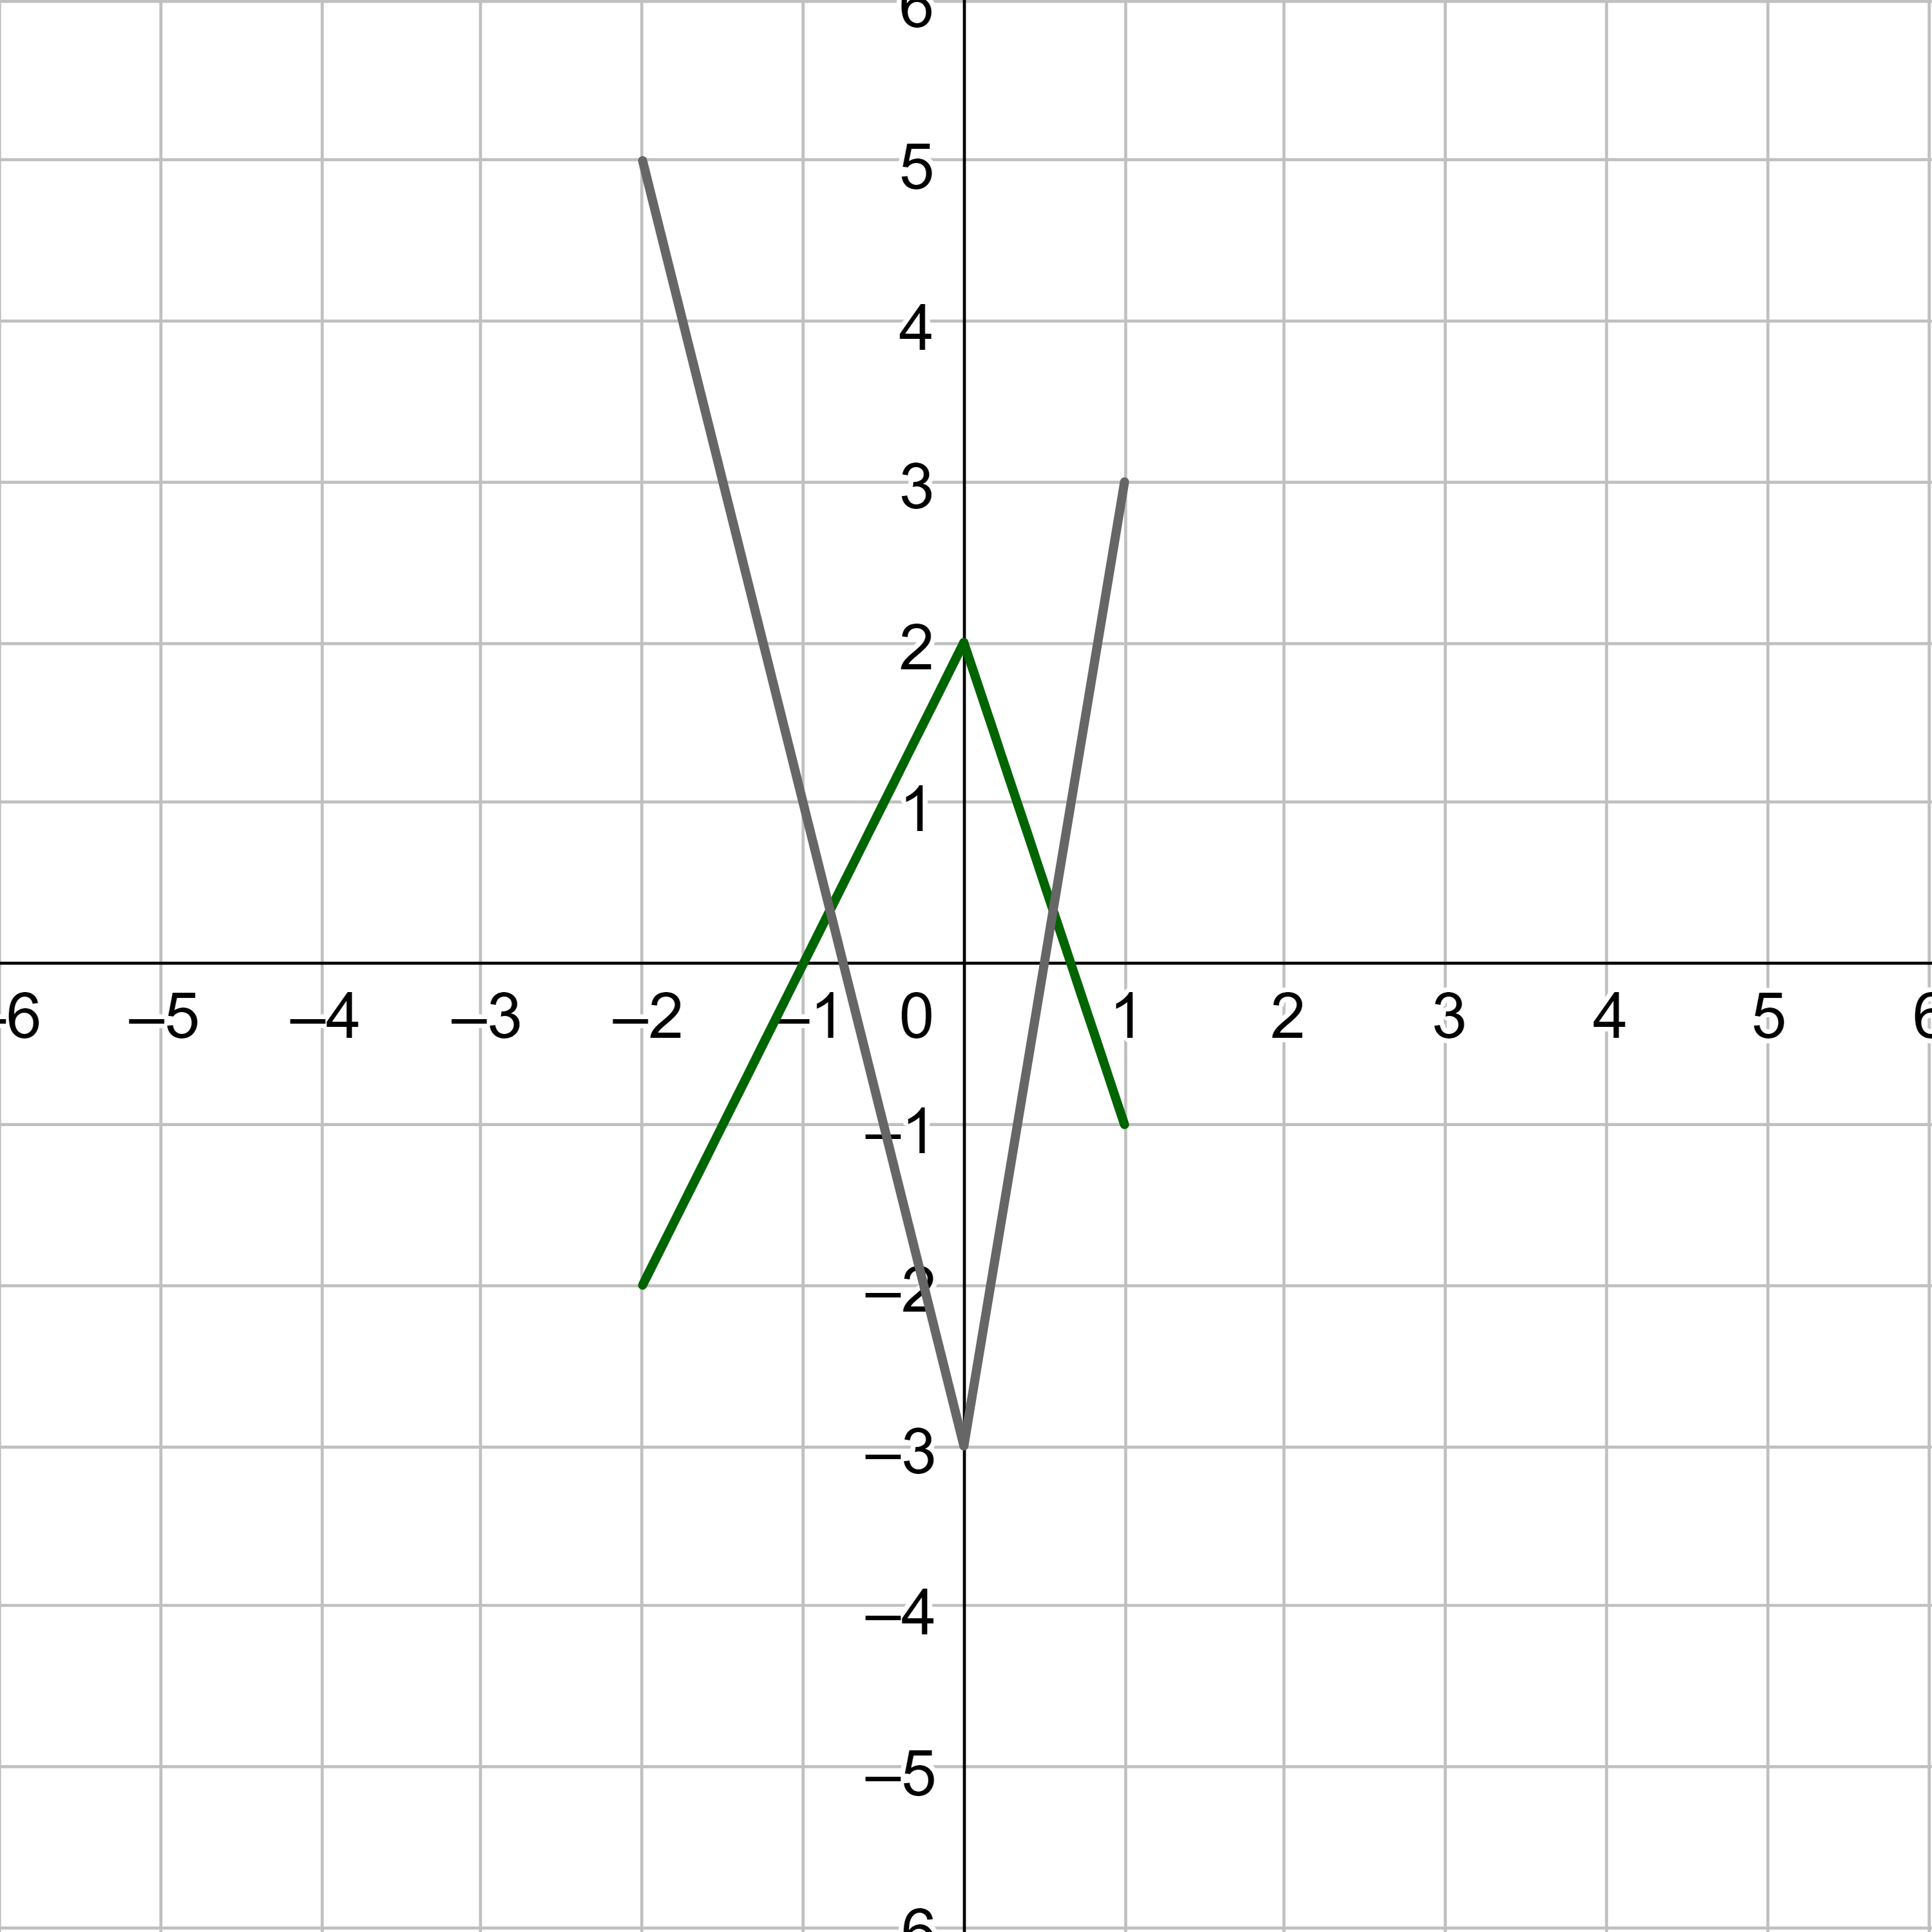
Use the graph of f(x) in figure 21 to sketch a graph of \(k(x) = f\left(\frac{1}{3}x - 1\right) - 2\).
Solution
To simplify the process, start by factoring out the inside of the function.
$$ f\left(\frac{1}{3}x - 1\right) - 2 $$
$$ f\left(\frac{1}{3}\left(x - 3\right)\right) - 2 $$
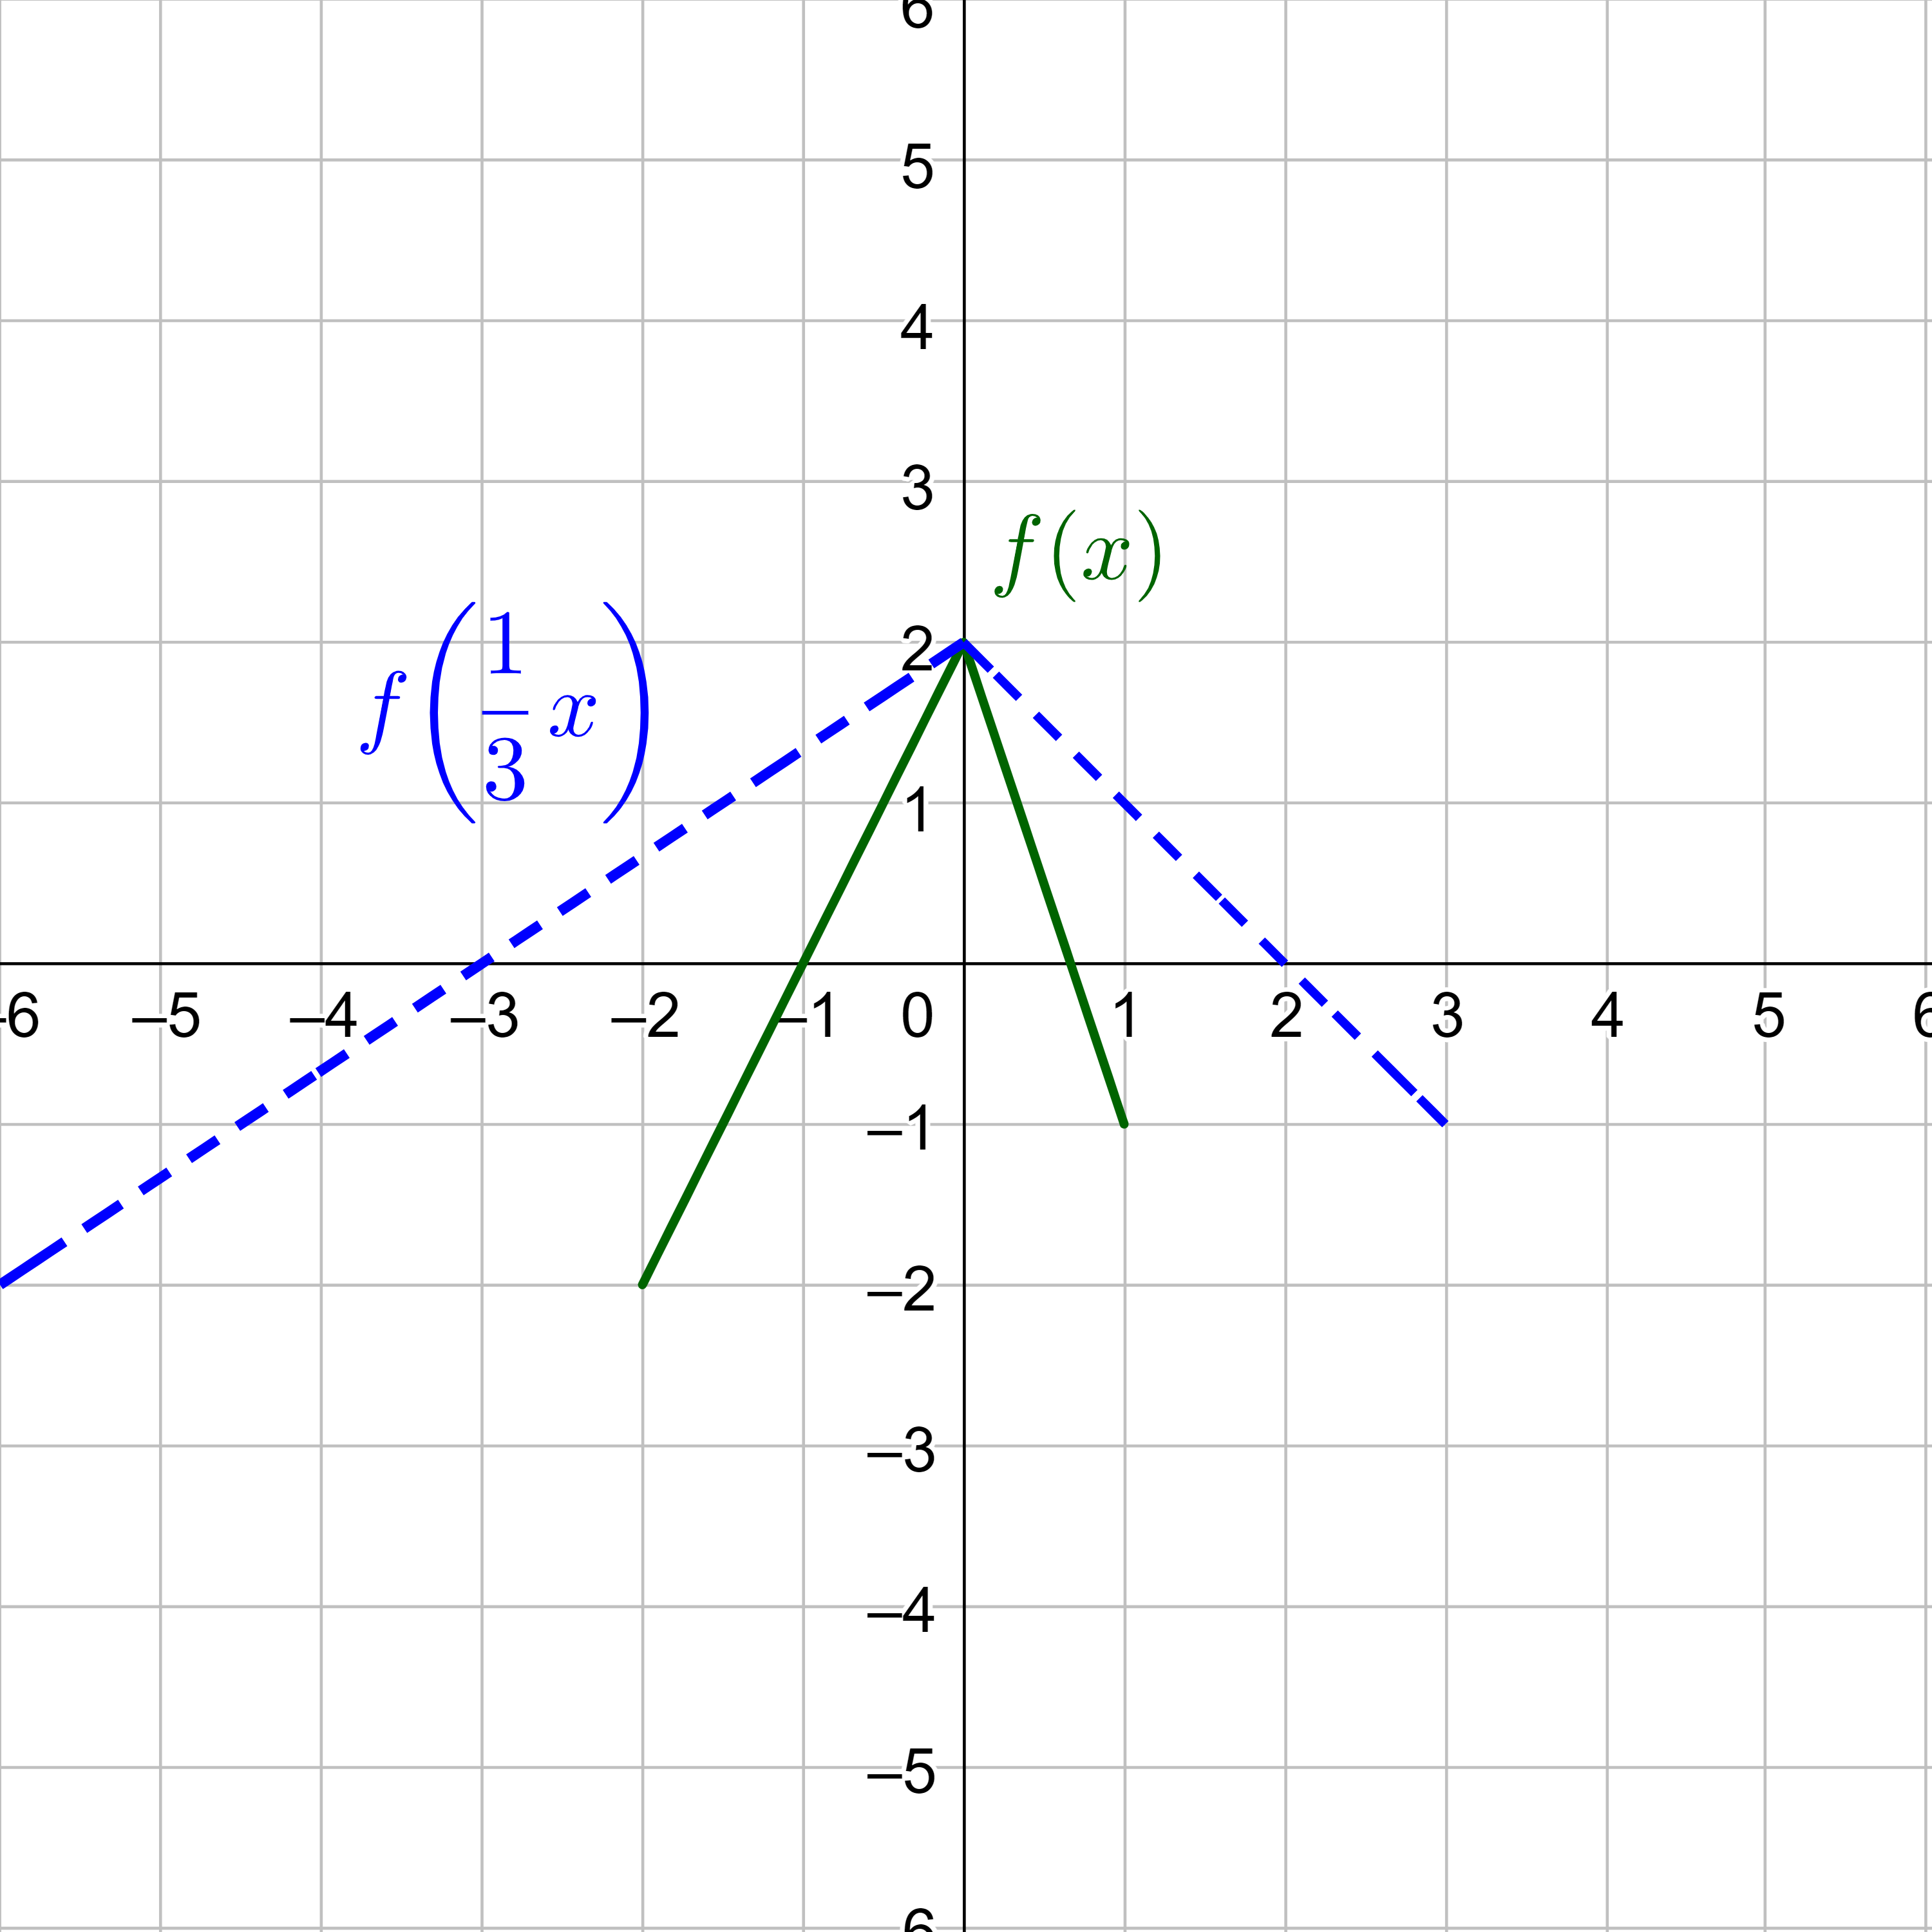
Now graph by applying the stretch first. It is a horizontal stretch by a factor of 3 because the b is \(\frac{1}{3}\) and the horizontal stretch is by the factor of \(\frac{1}{b}\).
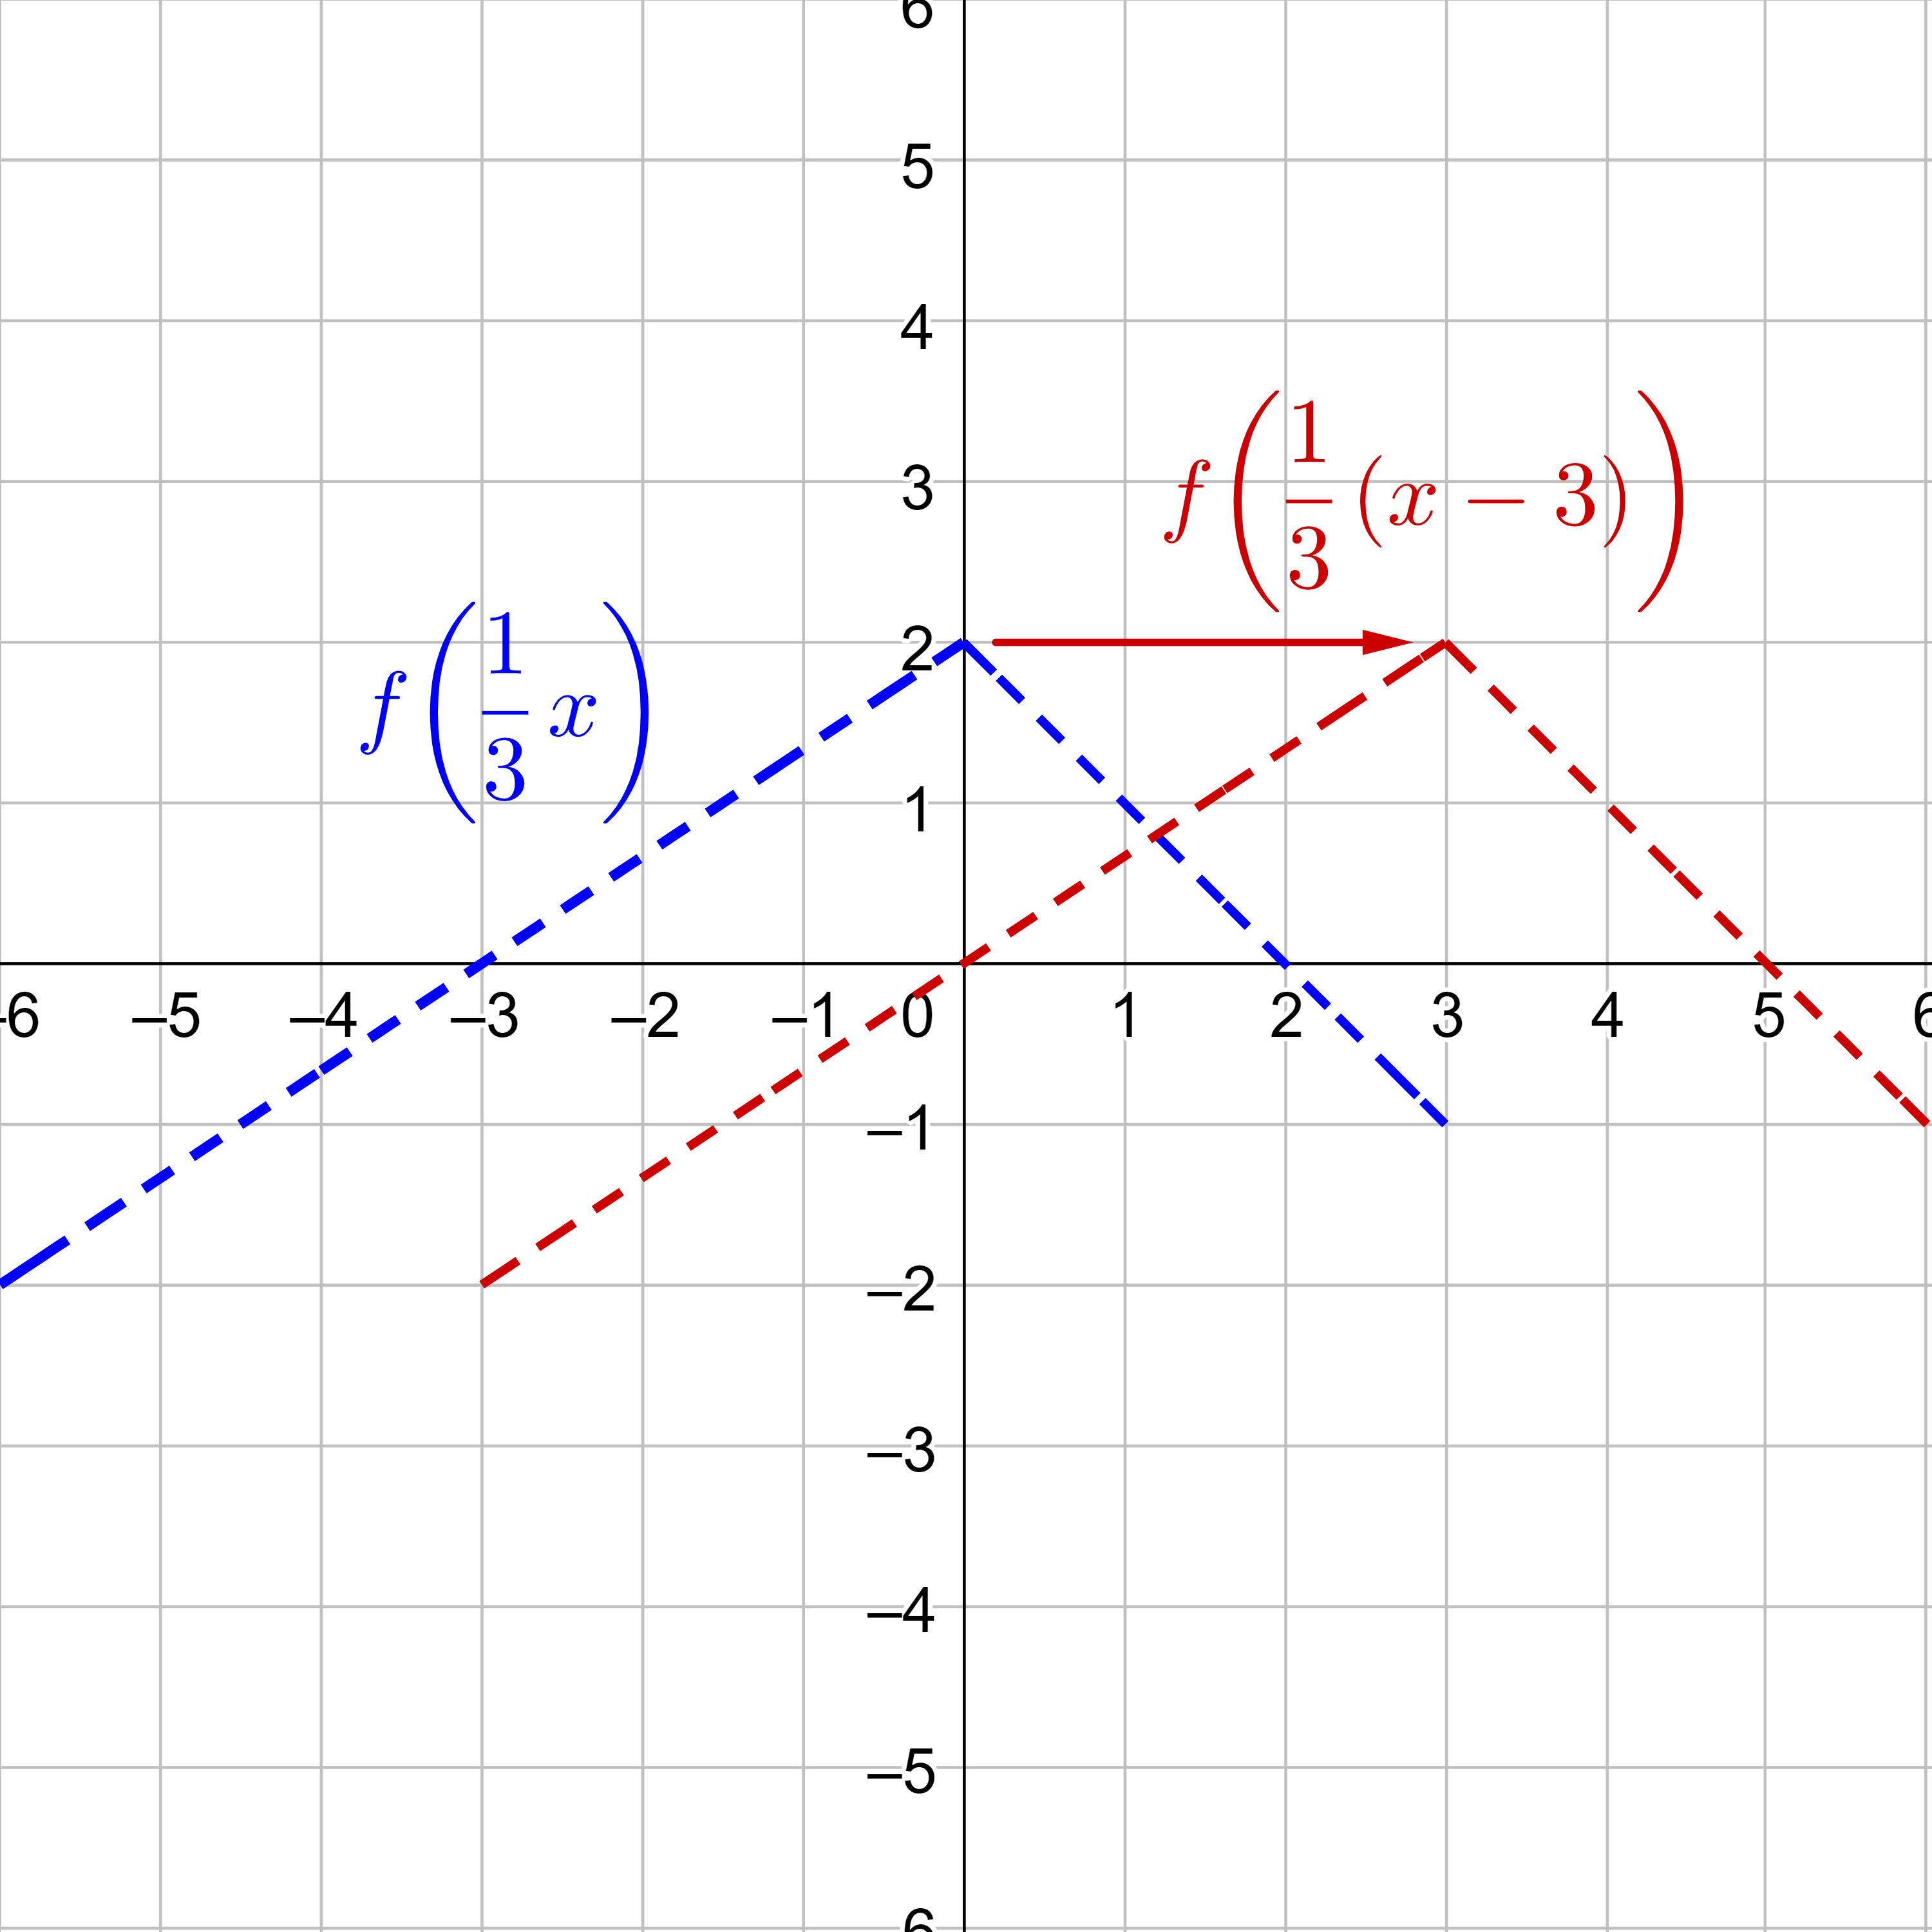
Next, horizontally translate right by 3 units, as indicated by x − 3.
Last, vertically translate down by 2, as indicated by the −2 on the outside of the function.
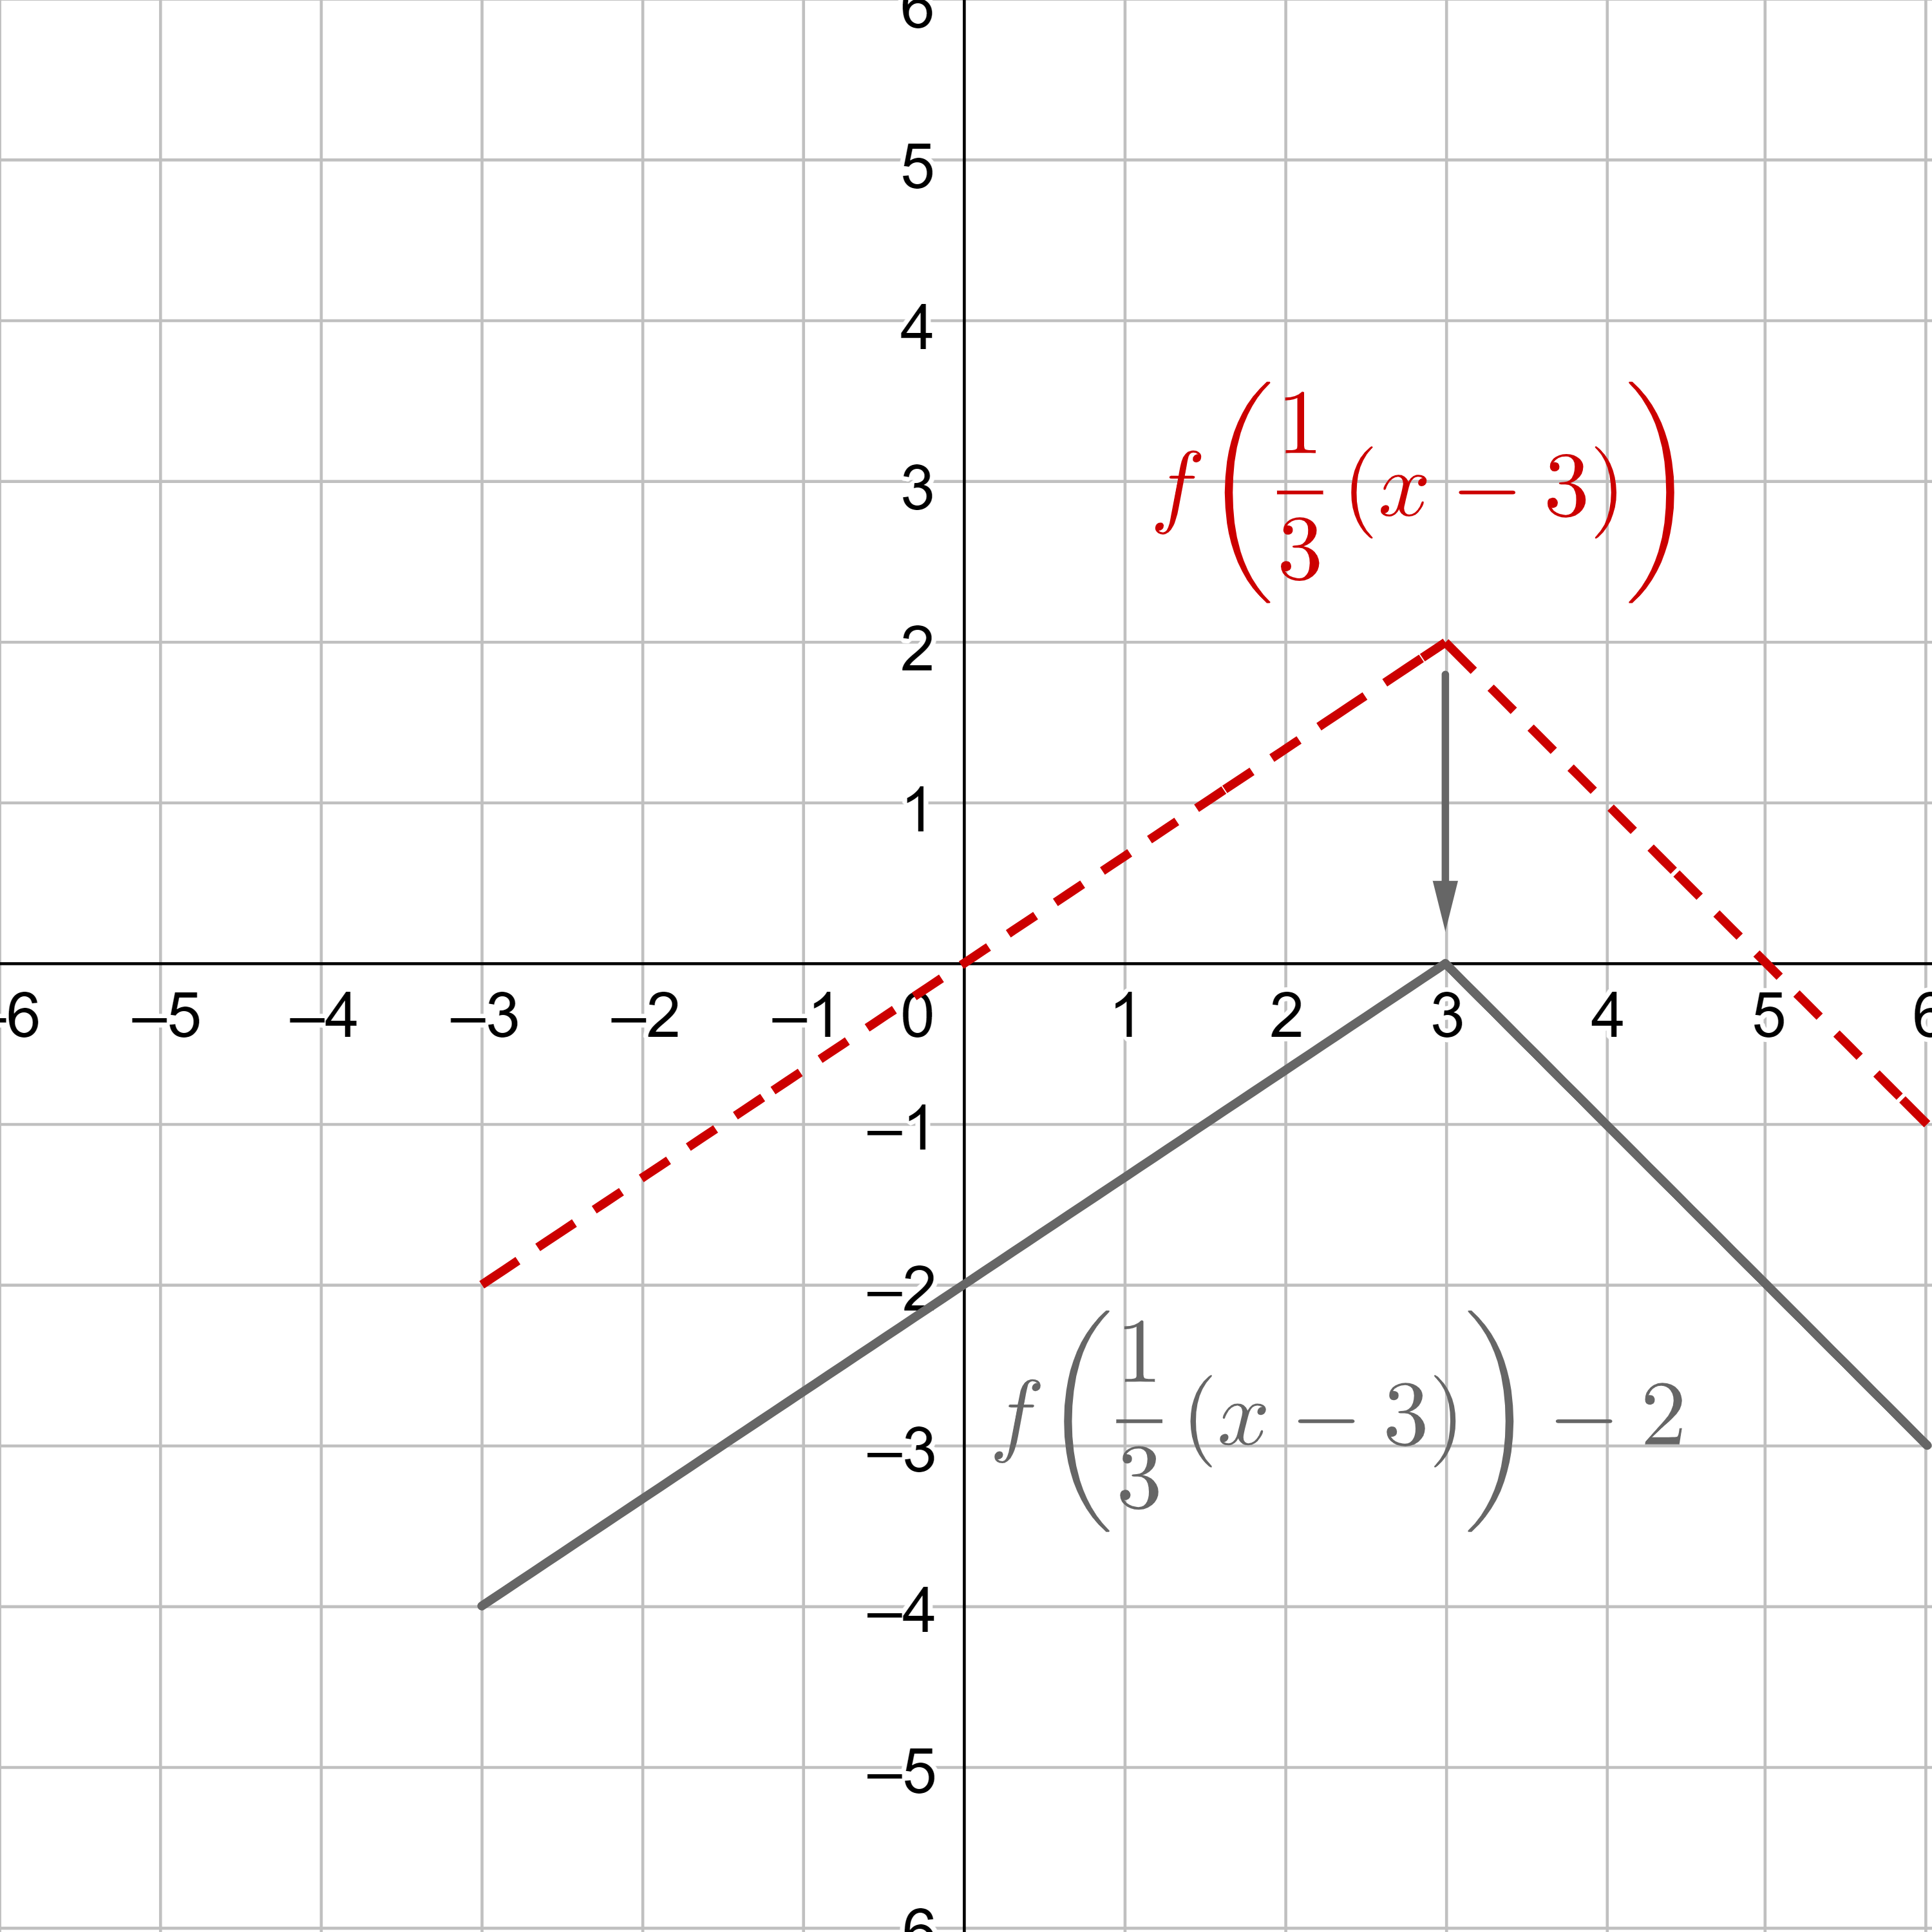
Note: Often, the horizontal and vertical translations are done together in one step.
Use the graph of f(x) in figure 25 to sketch a graph of \(y = -2 f\left(x\right) + 1\).
Answer
For functions written as y = af(b(x − h)) + k
The inside may need to be factored to put it in this form.
Helpful videos about this lesson.