You are my hiding place; you will protect me from trouble and surround me with songs of deliverance. Psalms 32:7 NIV
1-06 Graphs of Parent Functions
Mr. Wright teaches the lesson.
Summary: In this section, you will:
Identify the graphs of parent functions.
Graph piecewise functions.
SDA NAD Content Standards (2018): PC.4.1
Toolbox. (pixabay.com/vinayr16)
Imagine trying to fix a car with only one wrench. You might have problems because the nuts and bolts are different sizes. To do your best work on a car you need a lot of different tools in your toolbox. In a similar way, to do precalculus and higher mathematics, you need a toolbox full of functions. These are called toolkit, or parent, functions.
Parent Functions
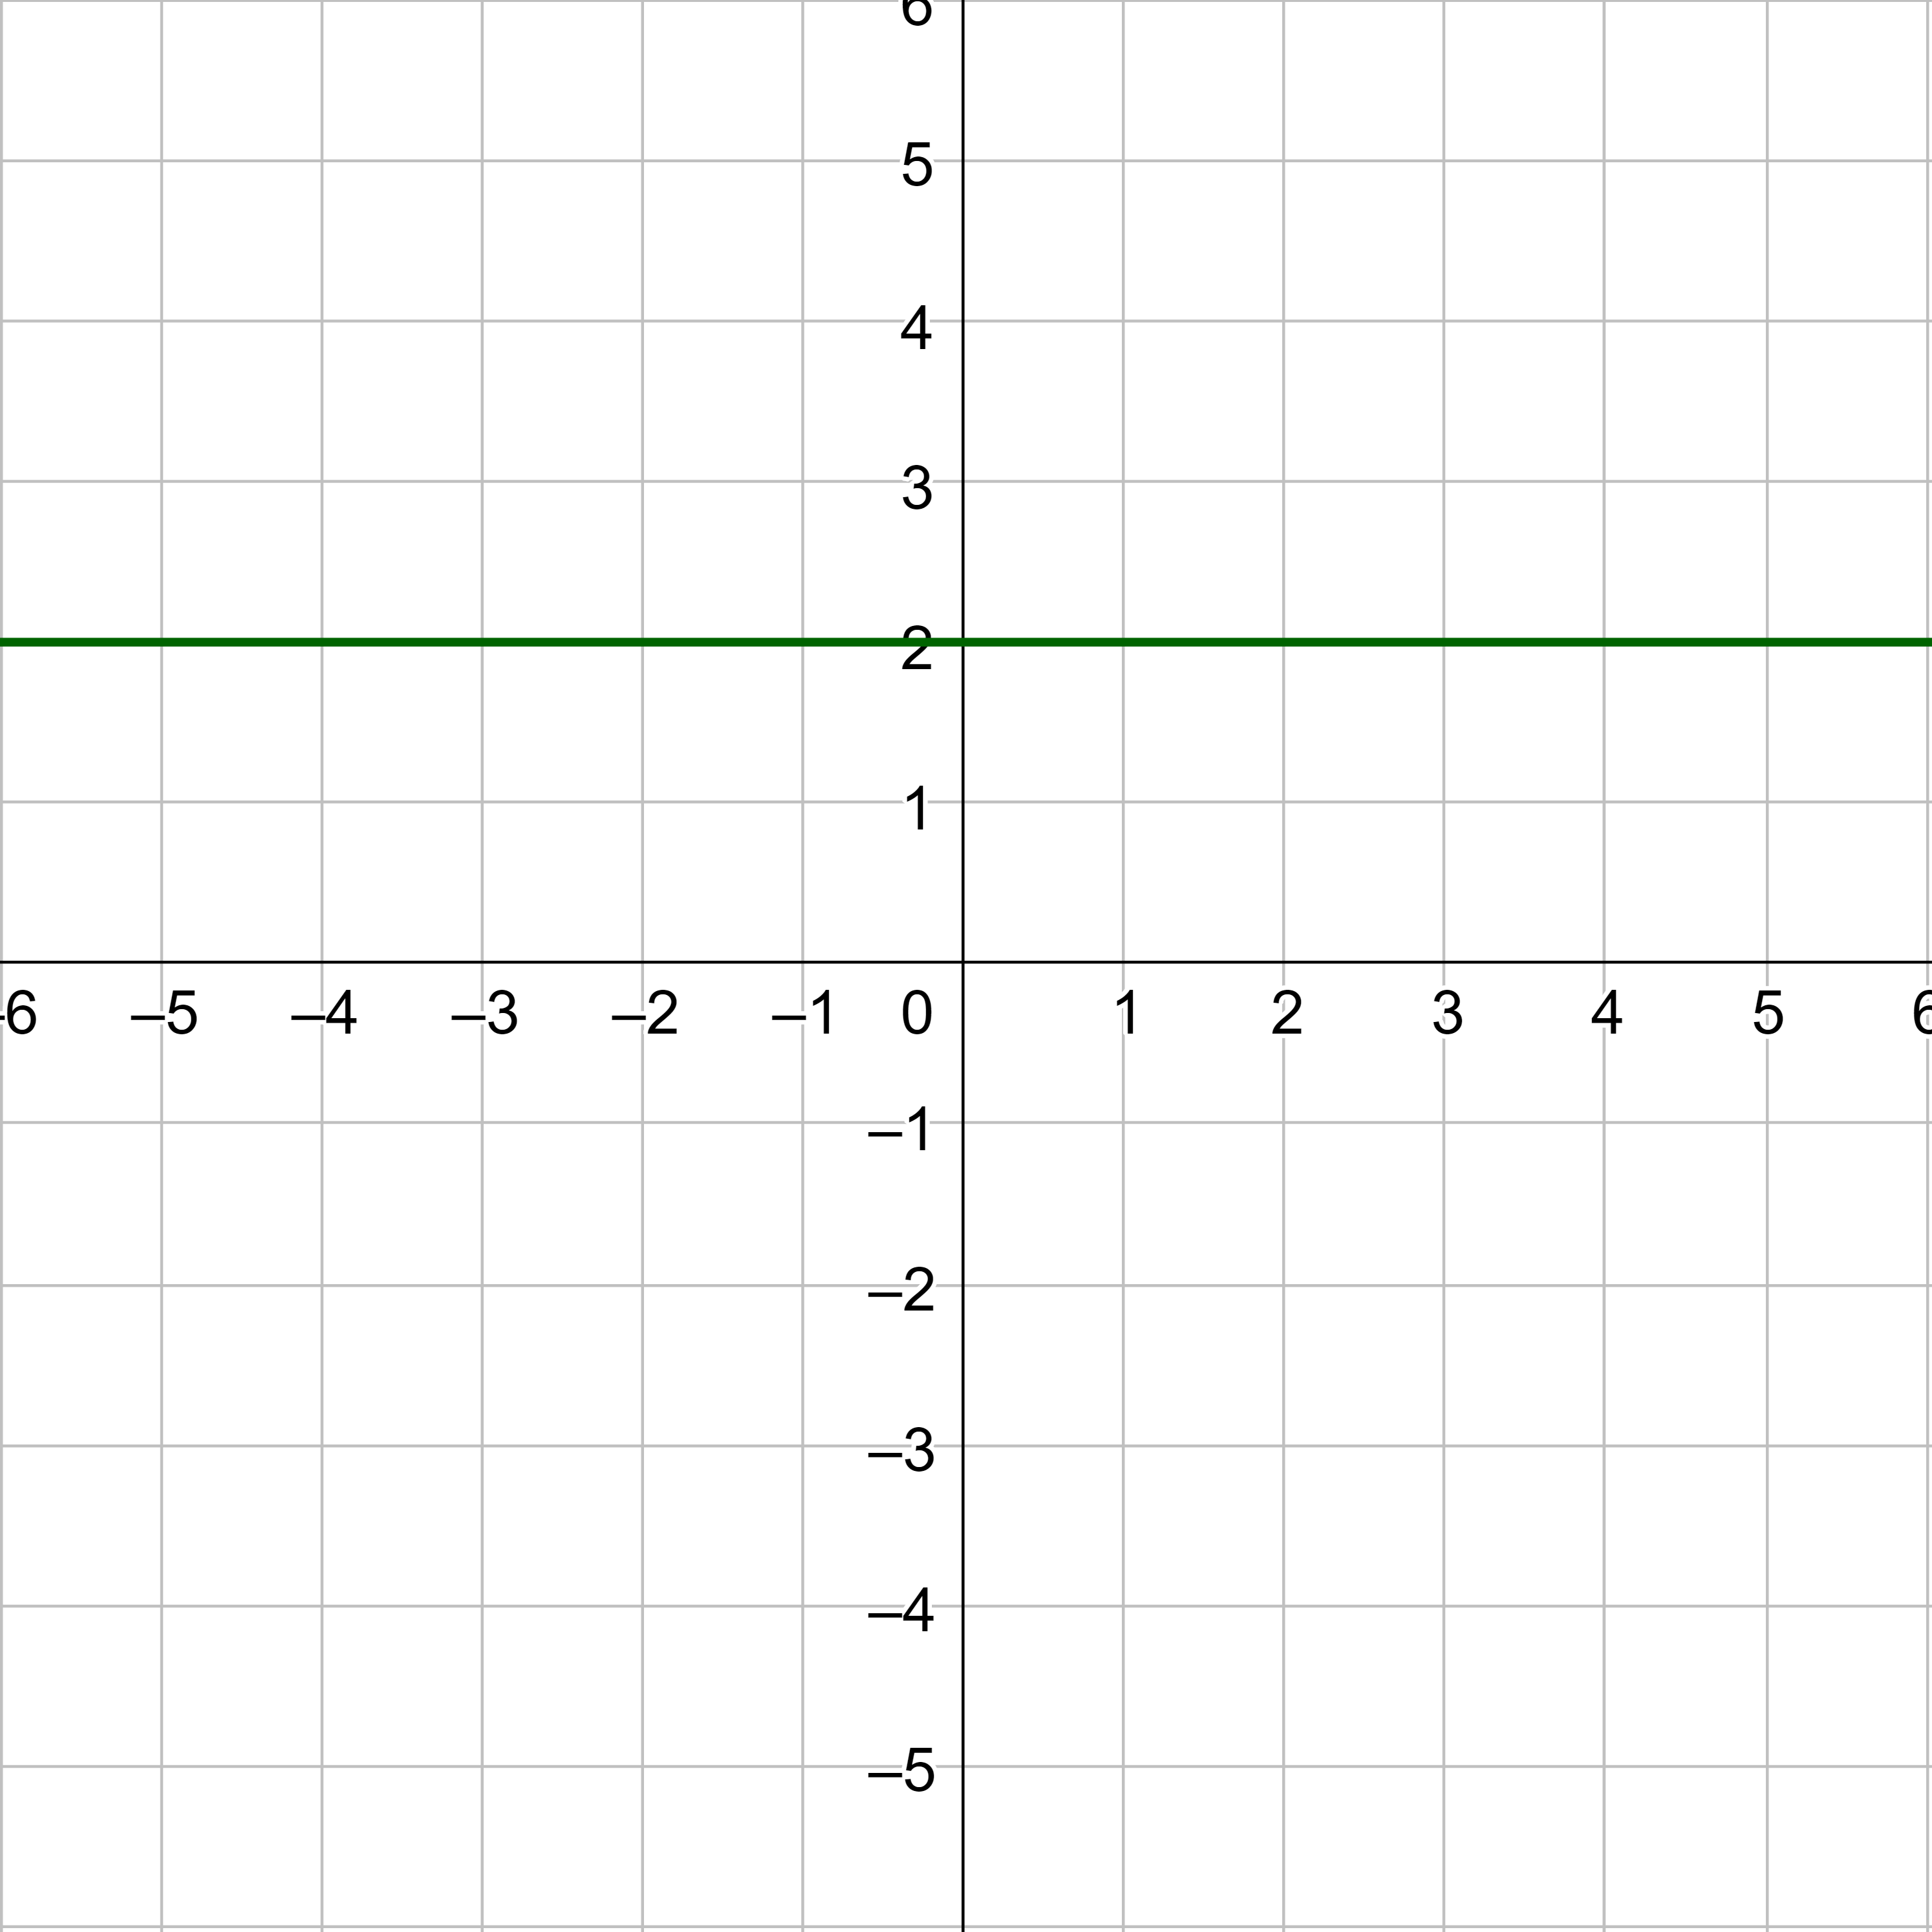
Constant functionf(x) = c
Constant function f(x) = 2.
Domain is all real numbers.
Range is the set {c} that contains this single element.
Neither increasing or decreasing.
Symmetric over the y-axis.
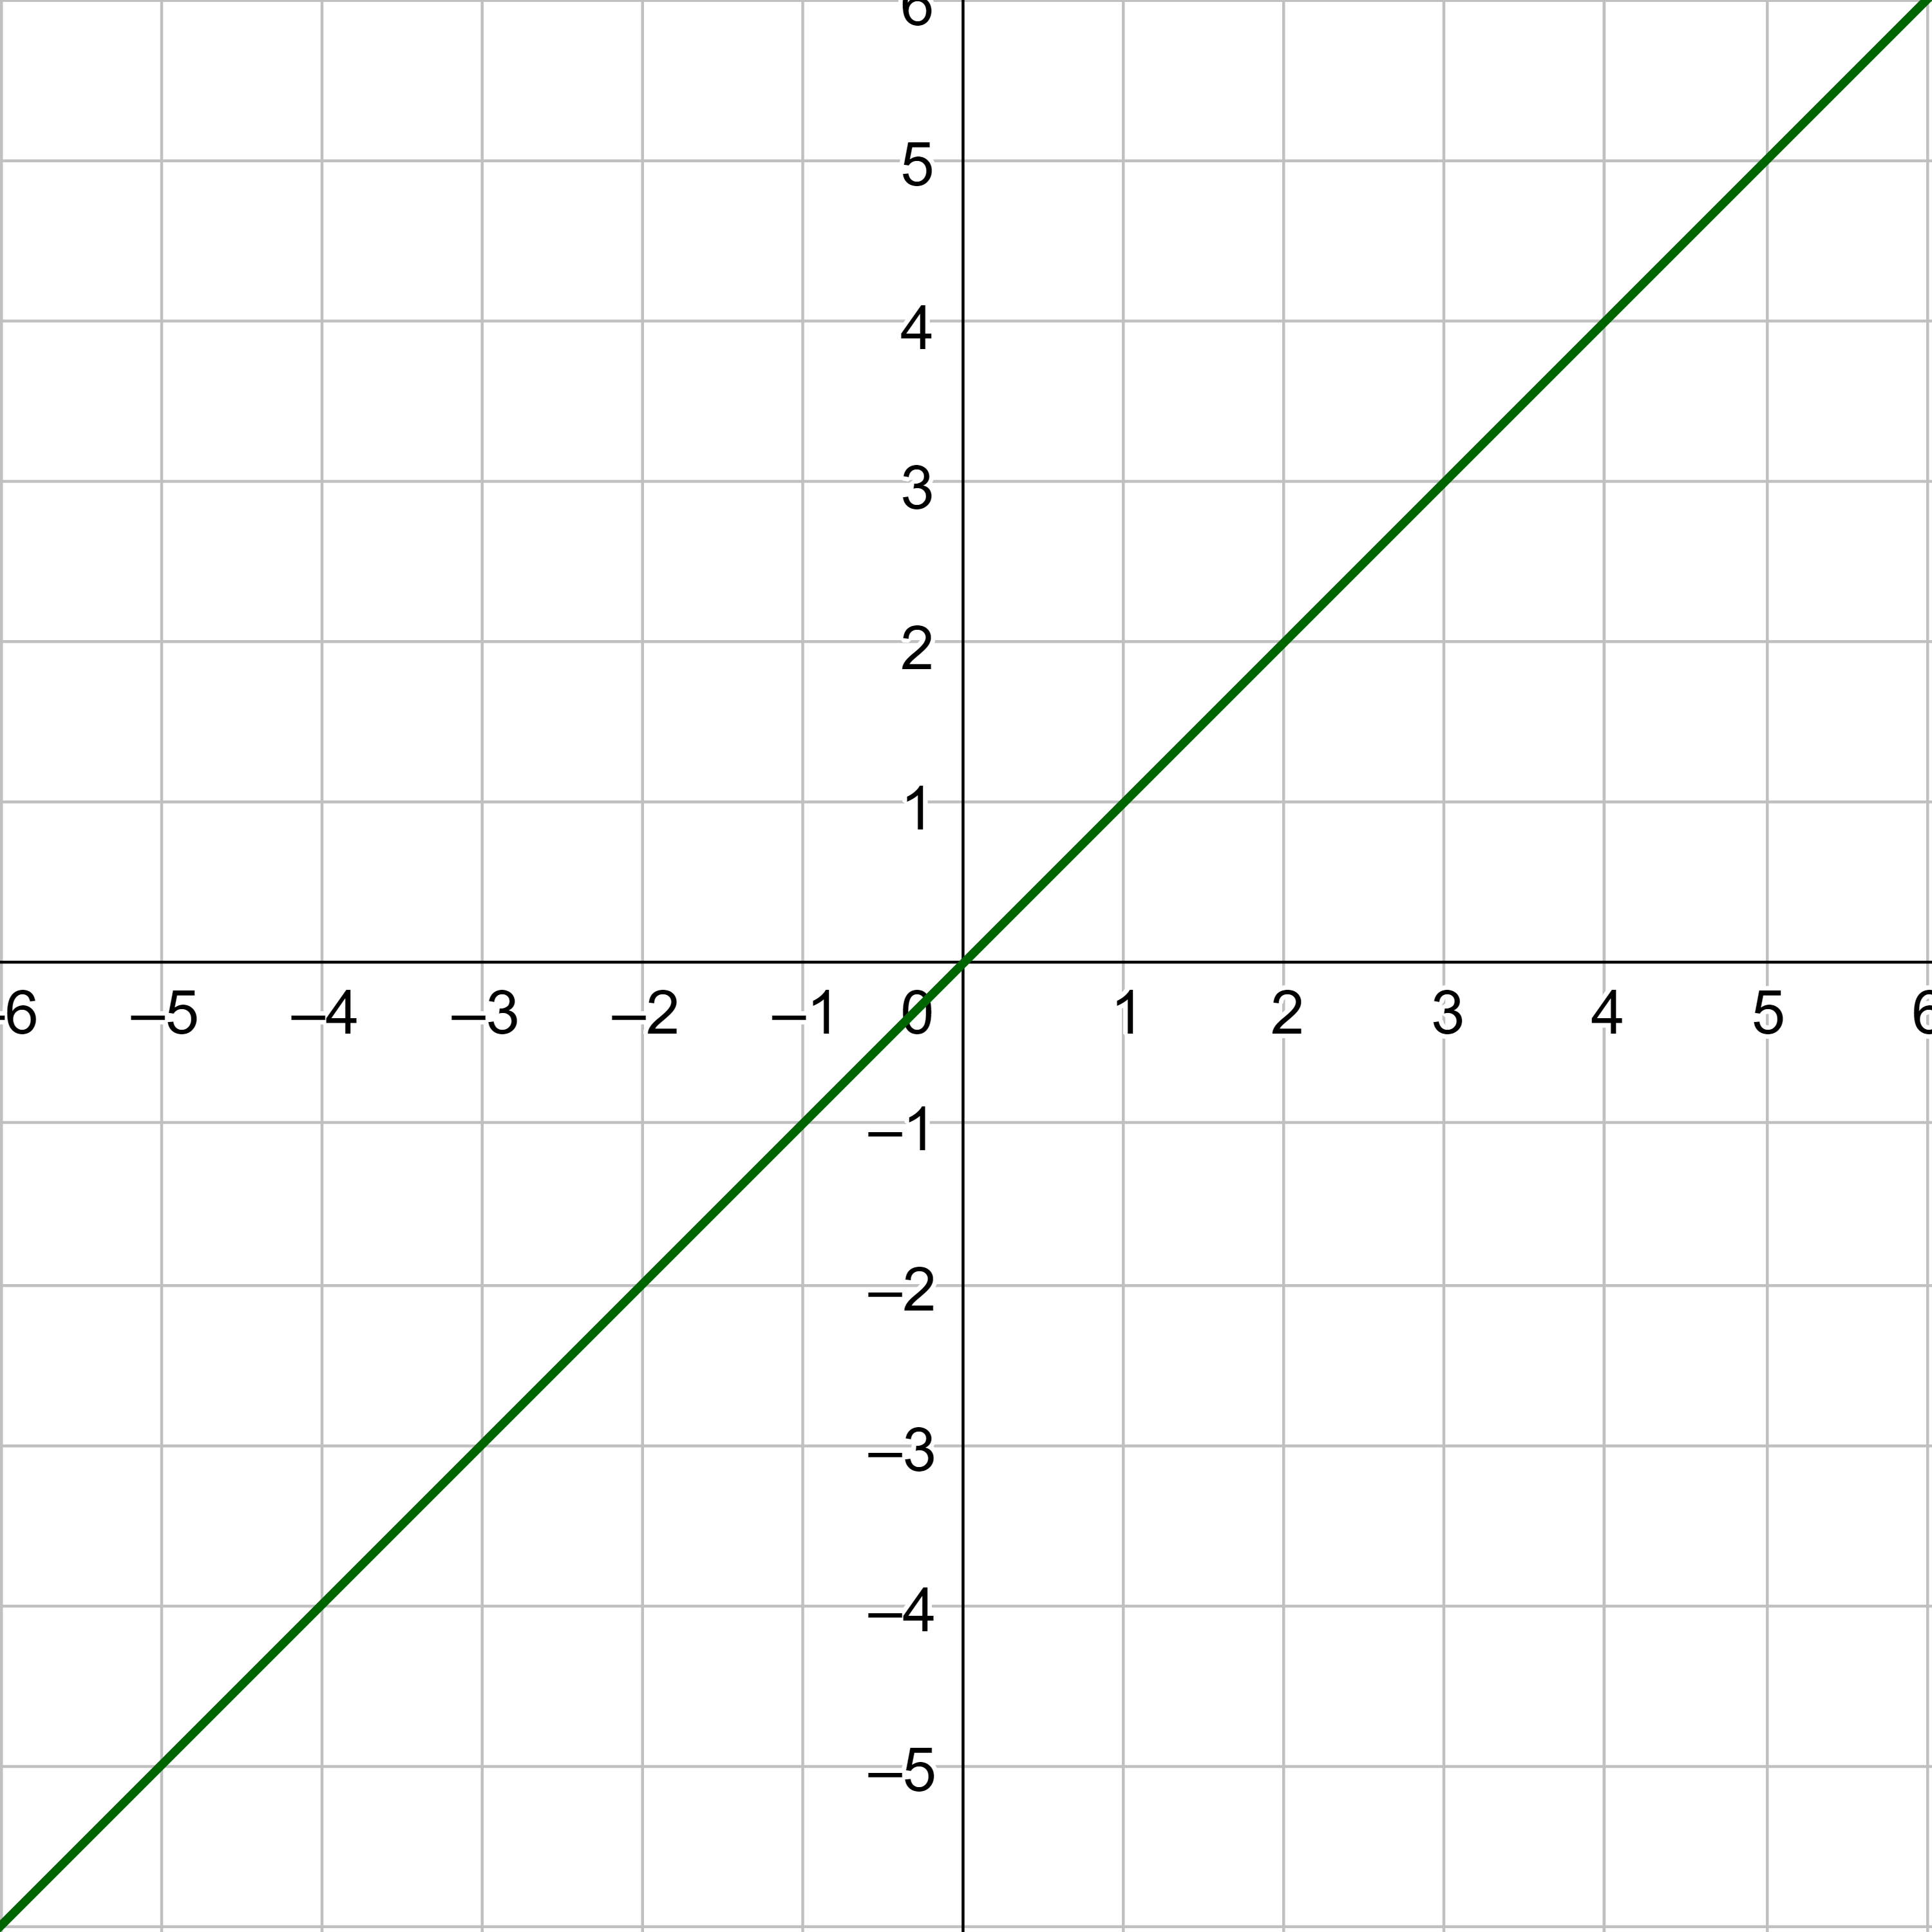
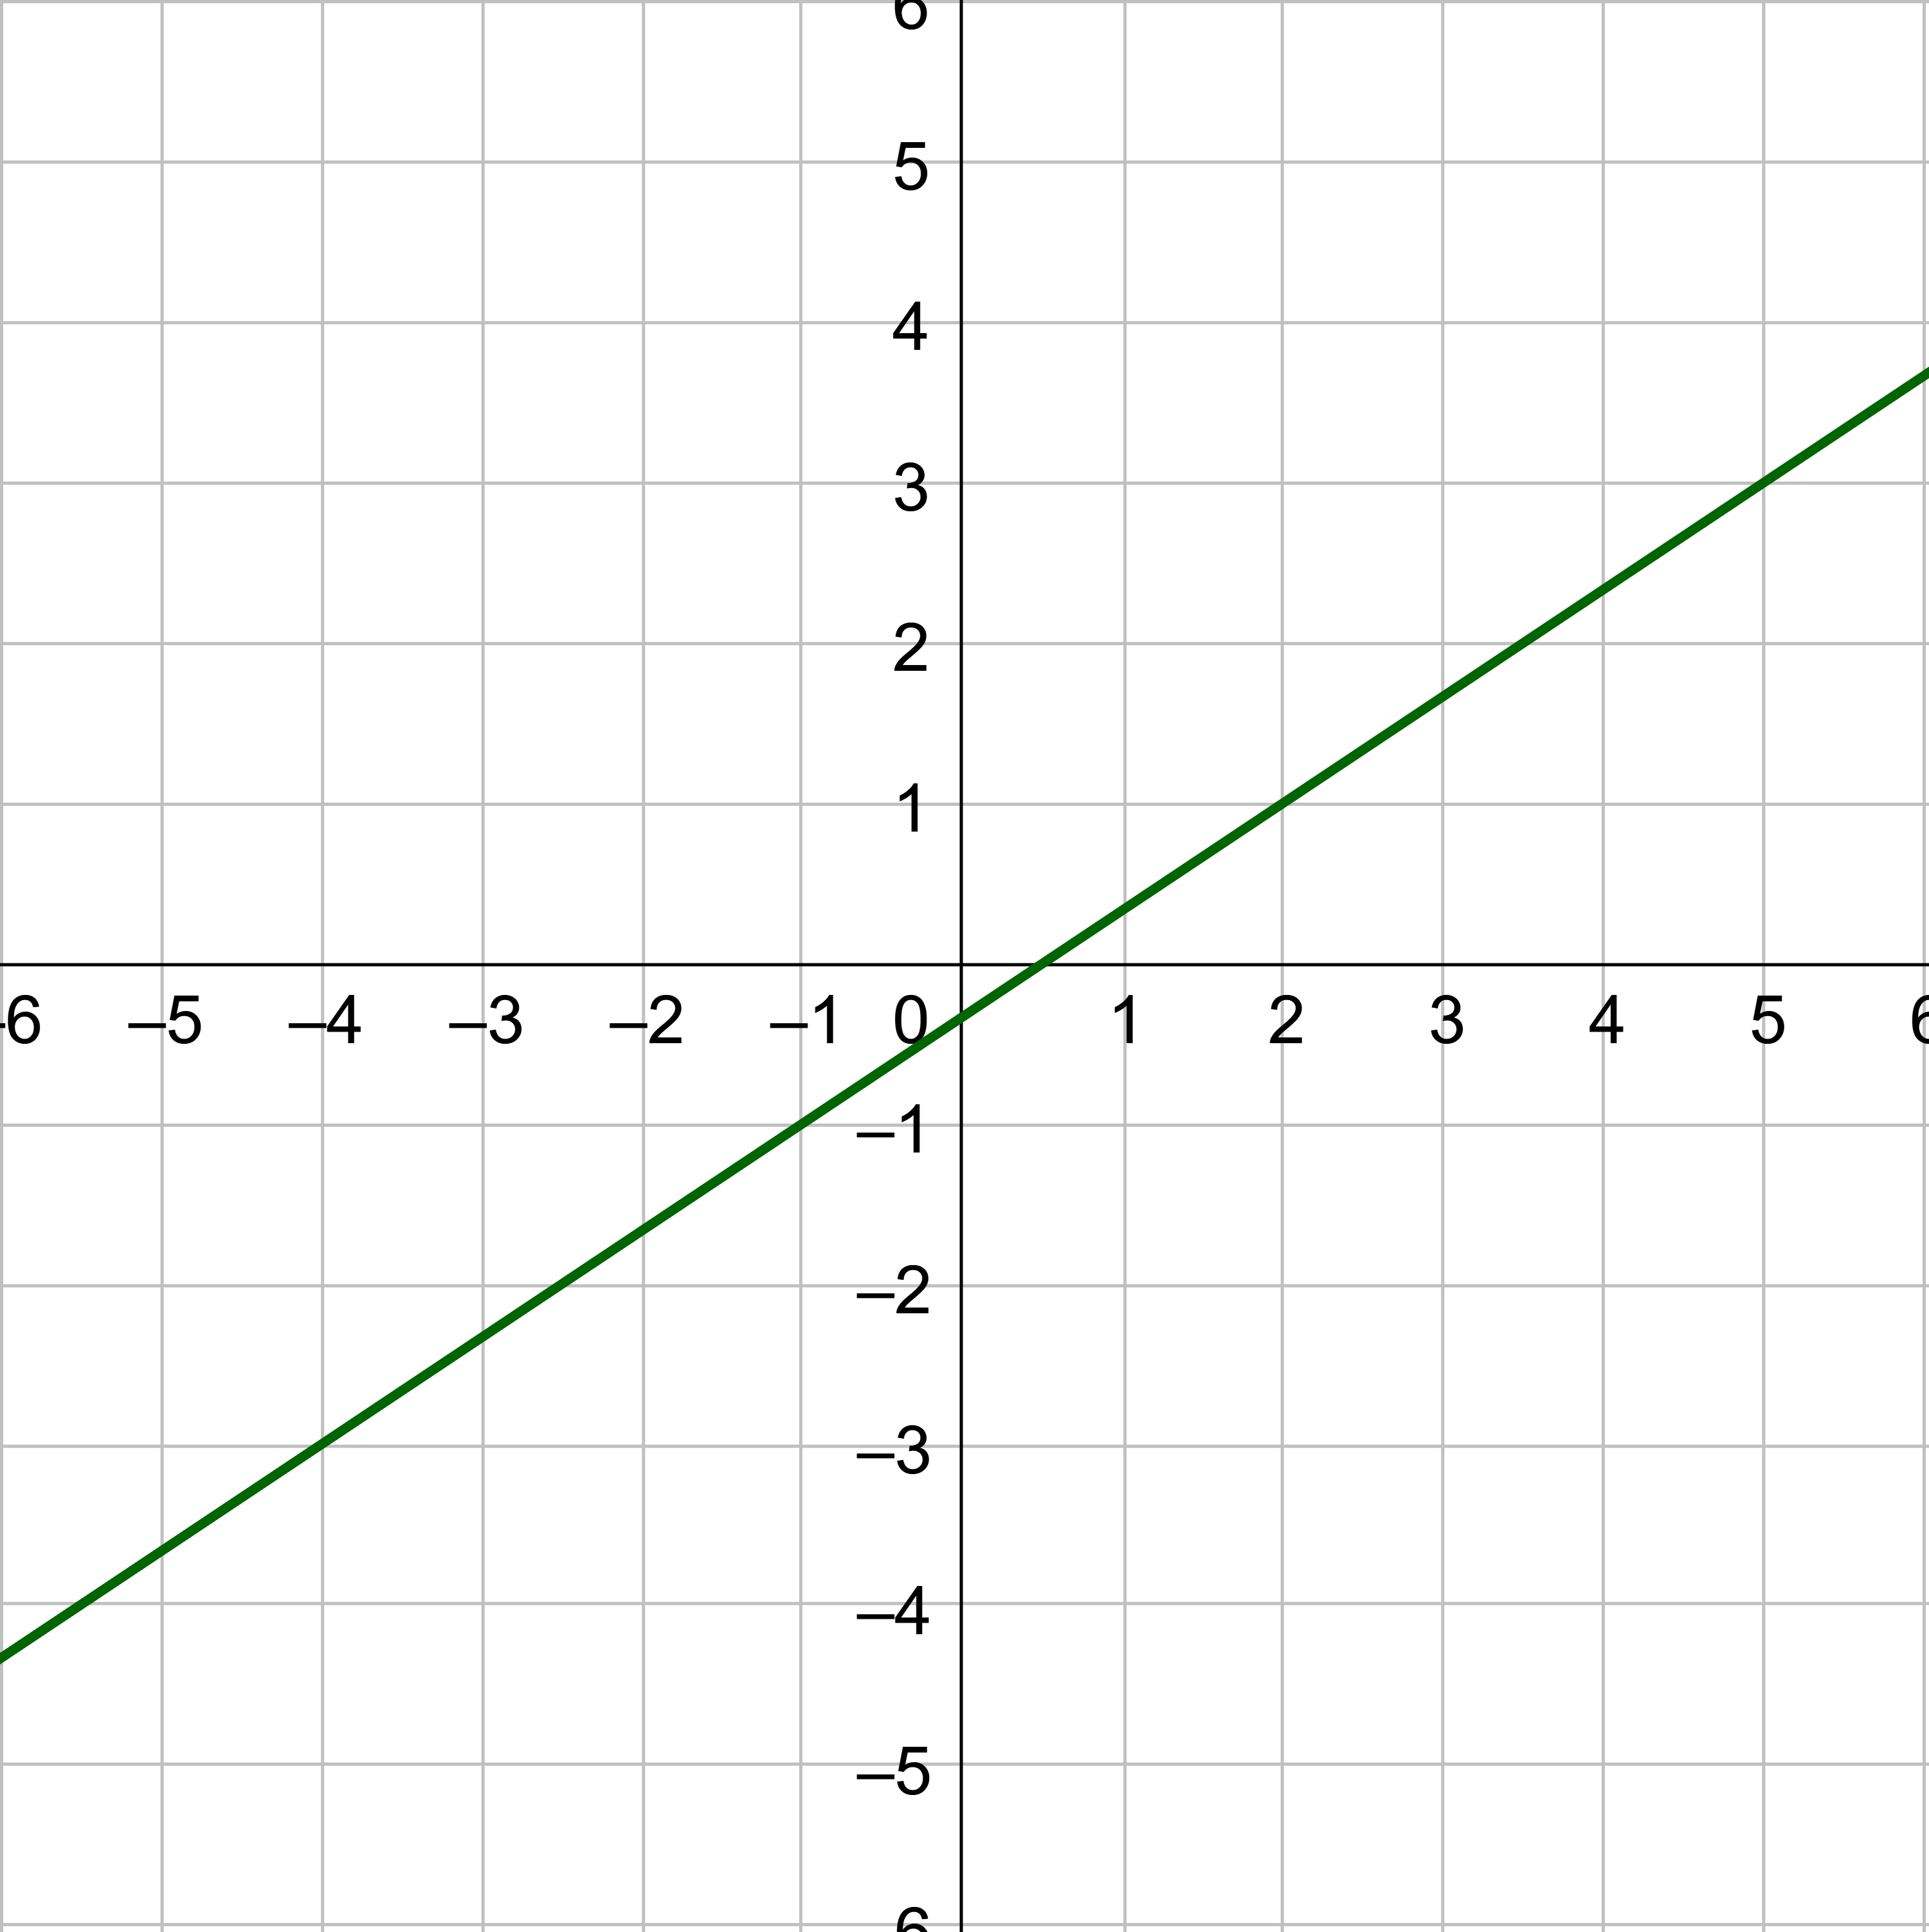
Linear functionf(x) = x
Linear function f(x) = x.
Domain is all real numbers.
Range is all real numbers.
Increases from (−∞, ∞).
Symmetric about the origin.
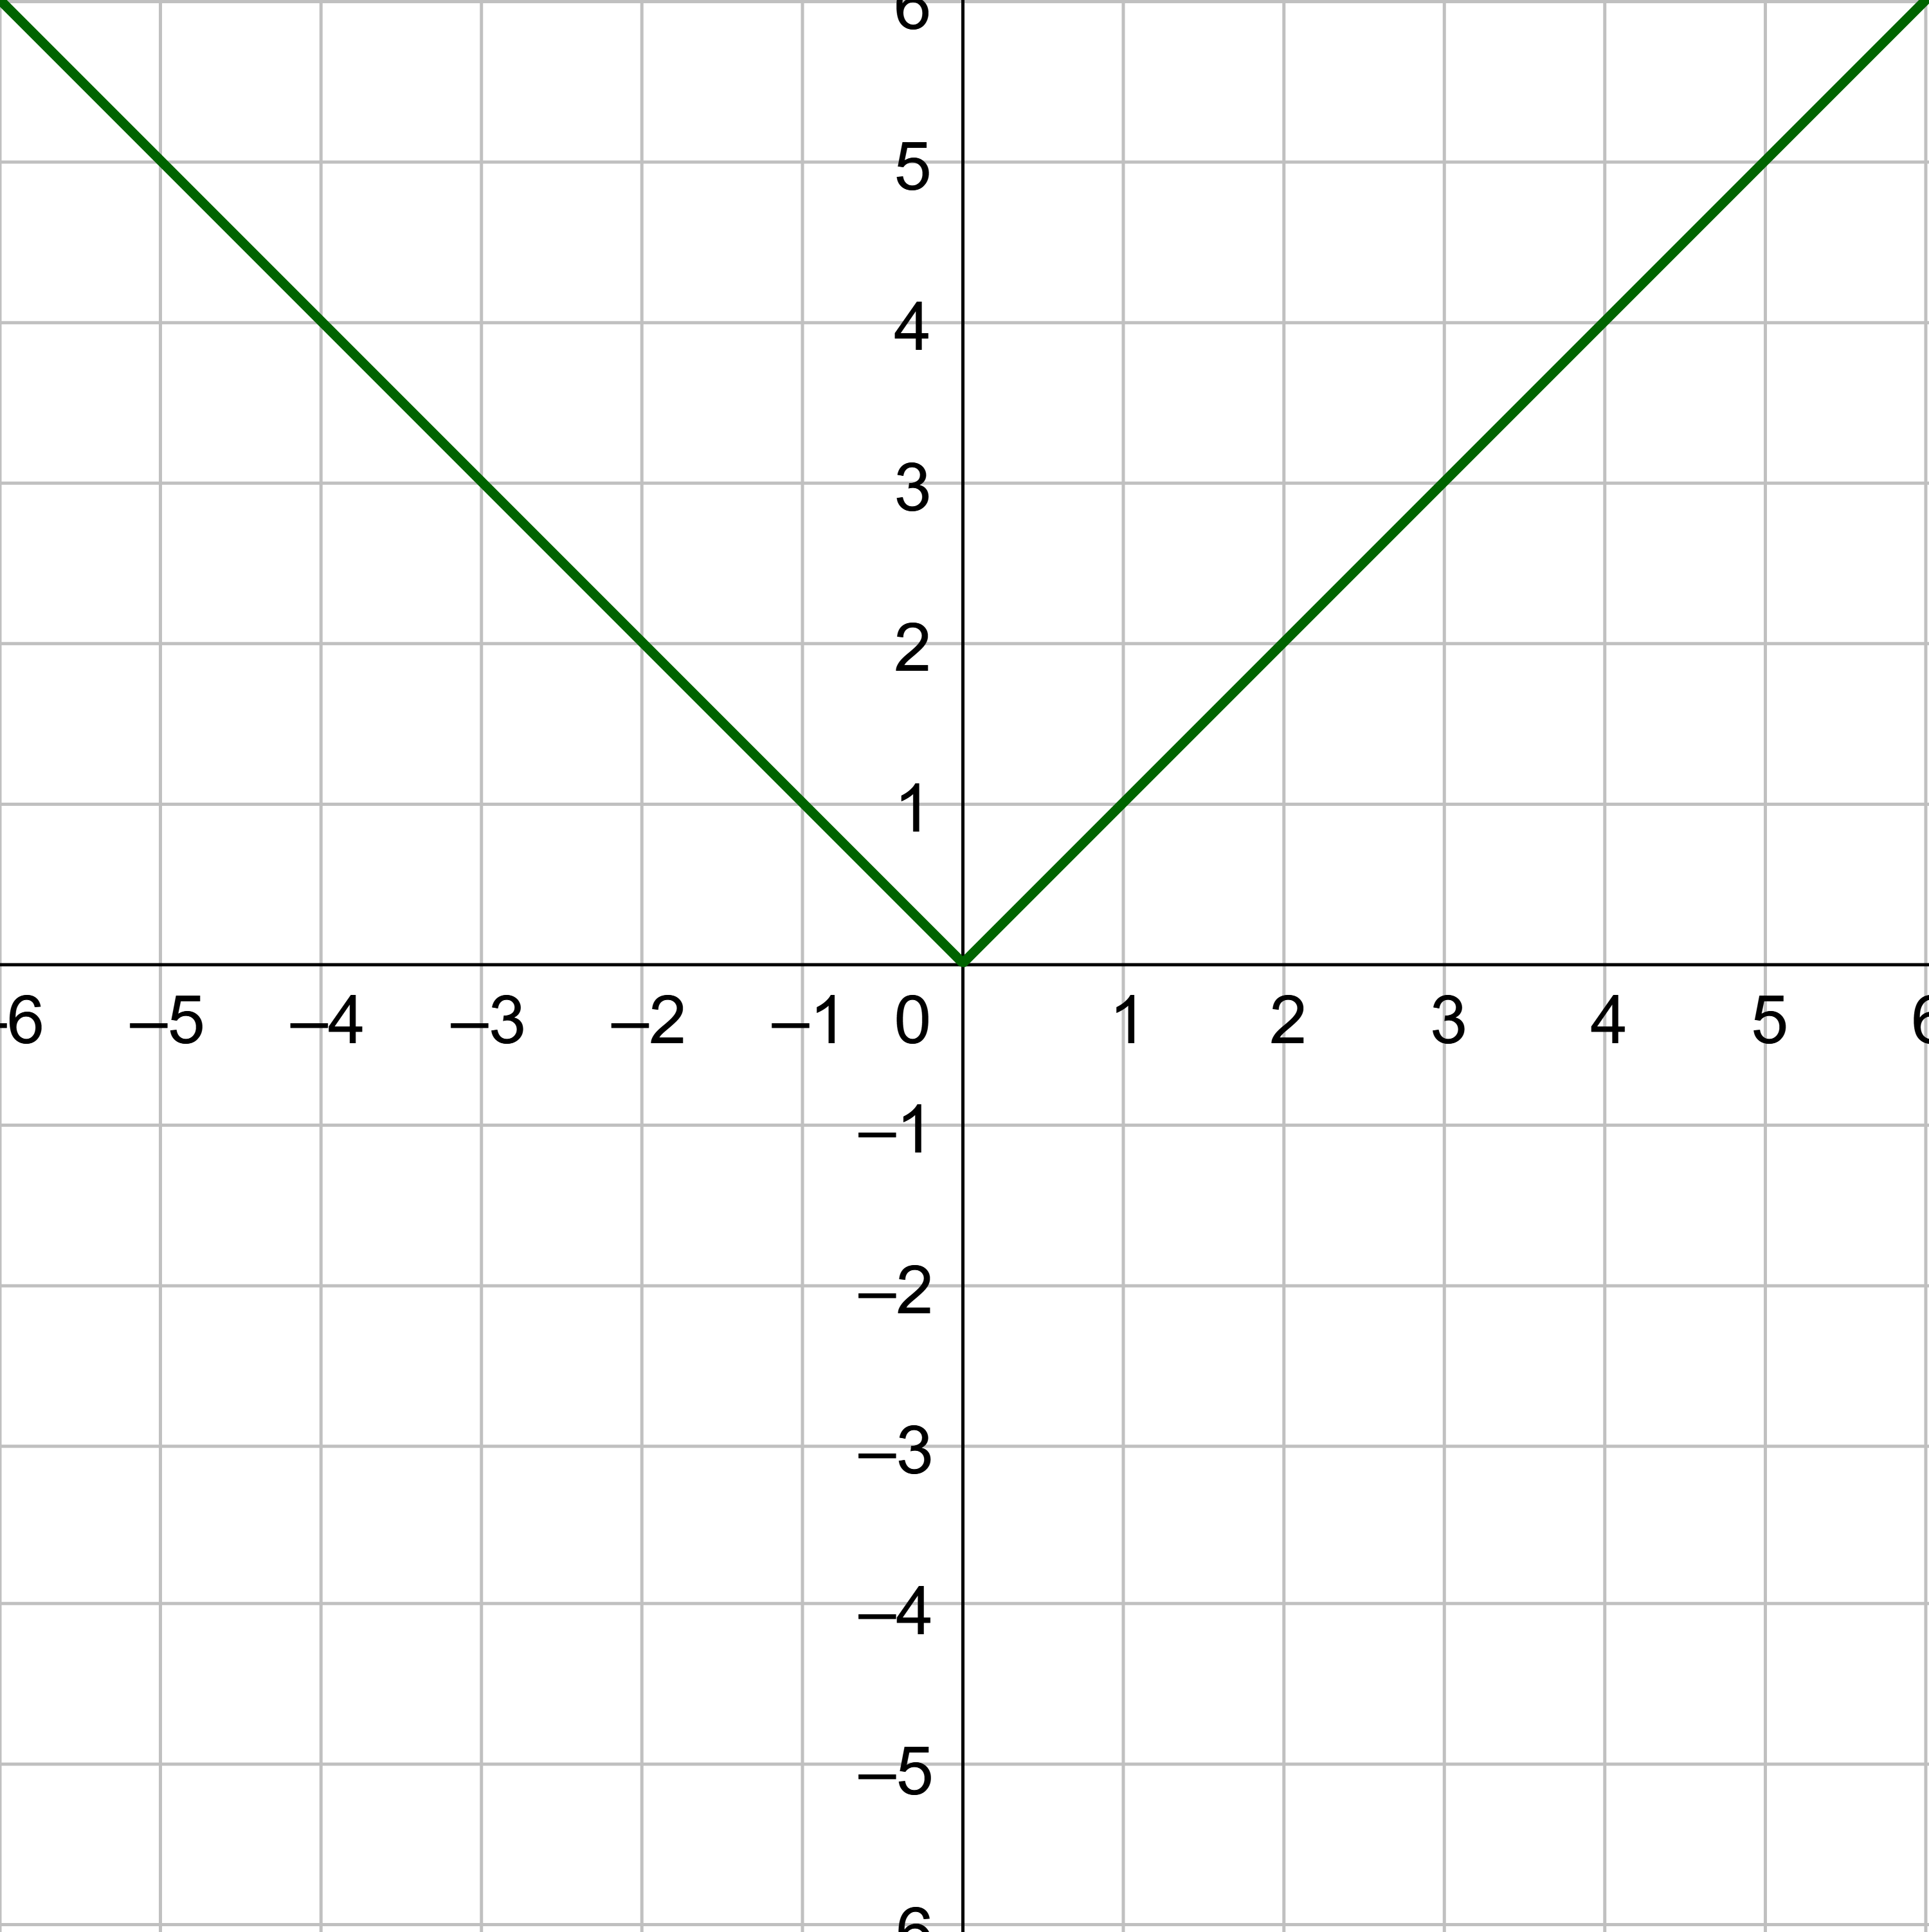
Absolute value functionf(x) = |x|
Absolute value function f(x) = |x|
Domain is all real numbers.
Range is [0, ∞).
Decreasing on (−∞, 0) and increasing on (0, ∞).
Symmetric over the y-axis
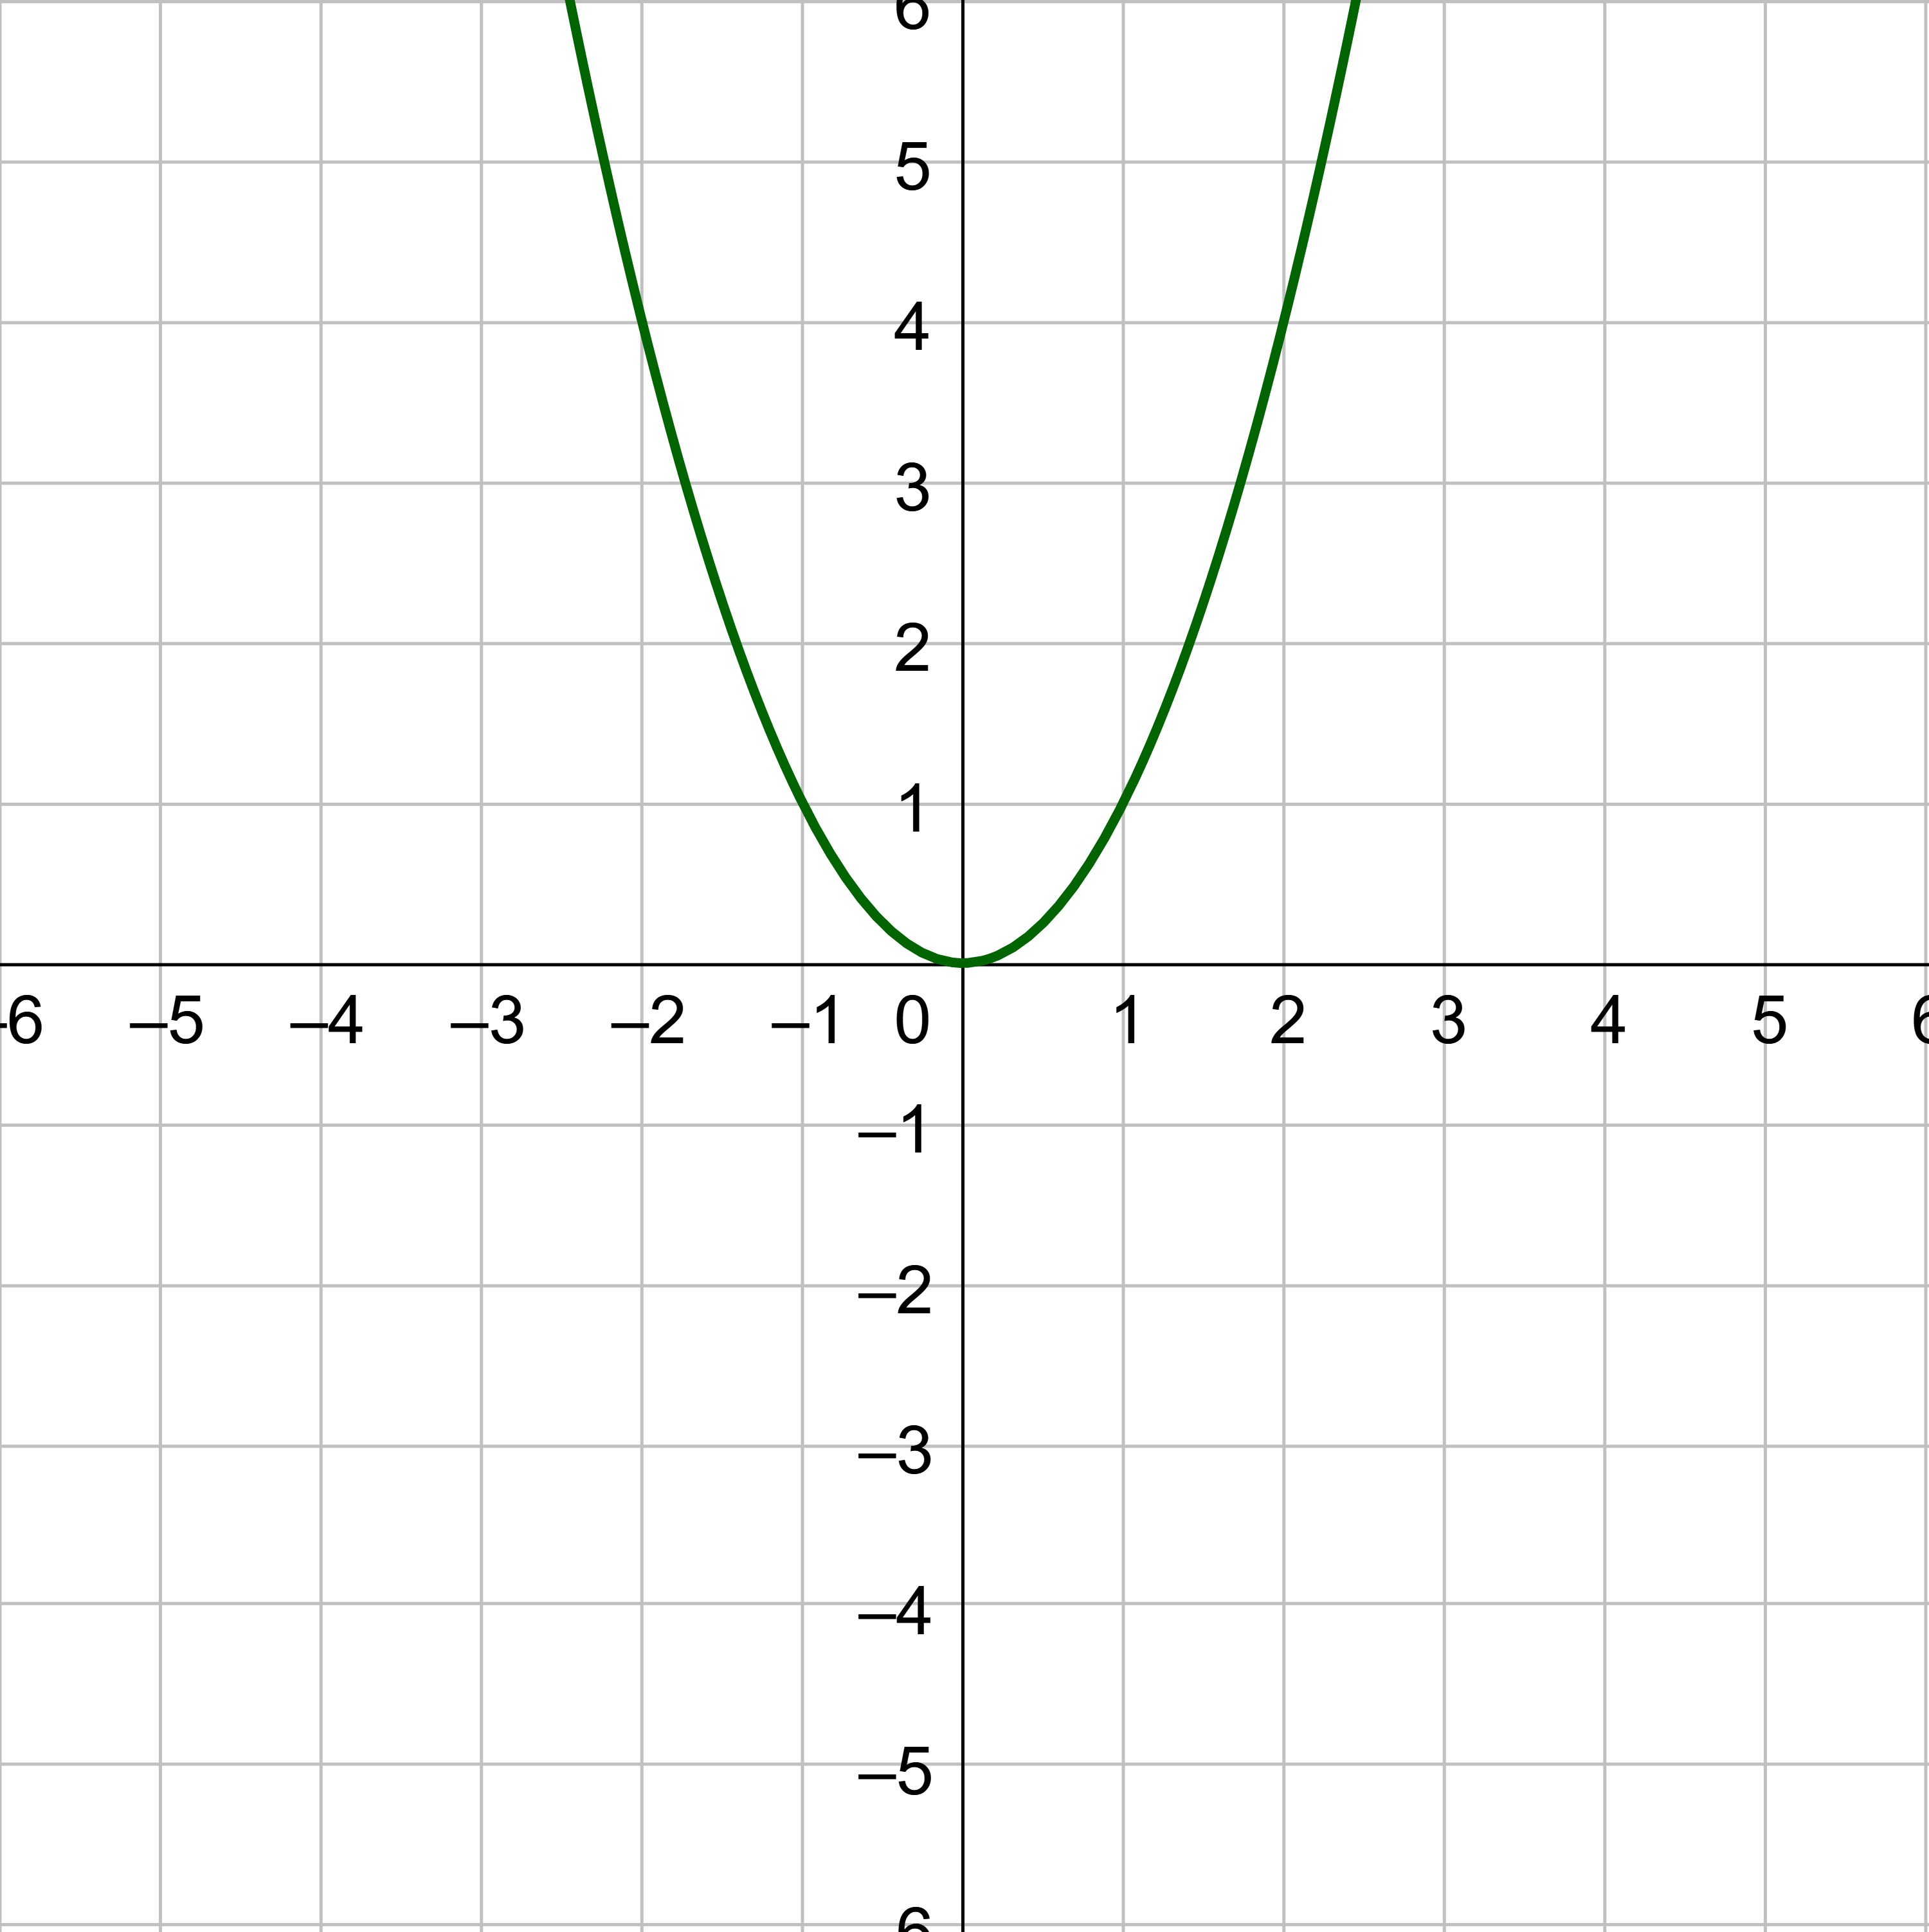
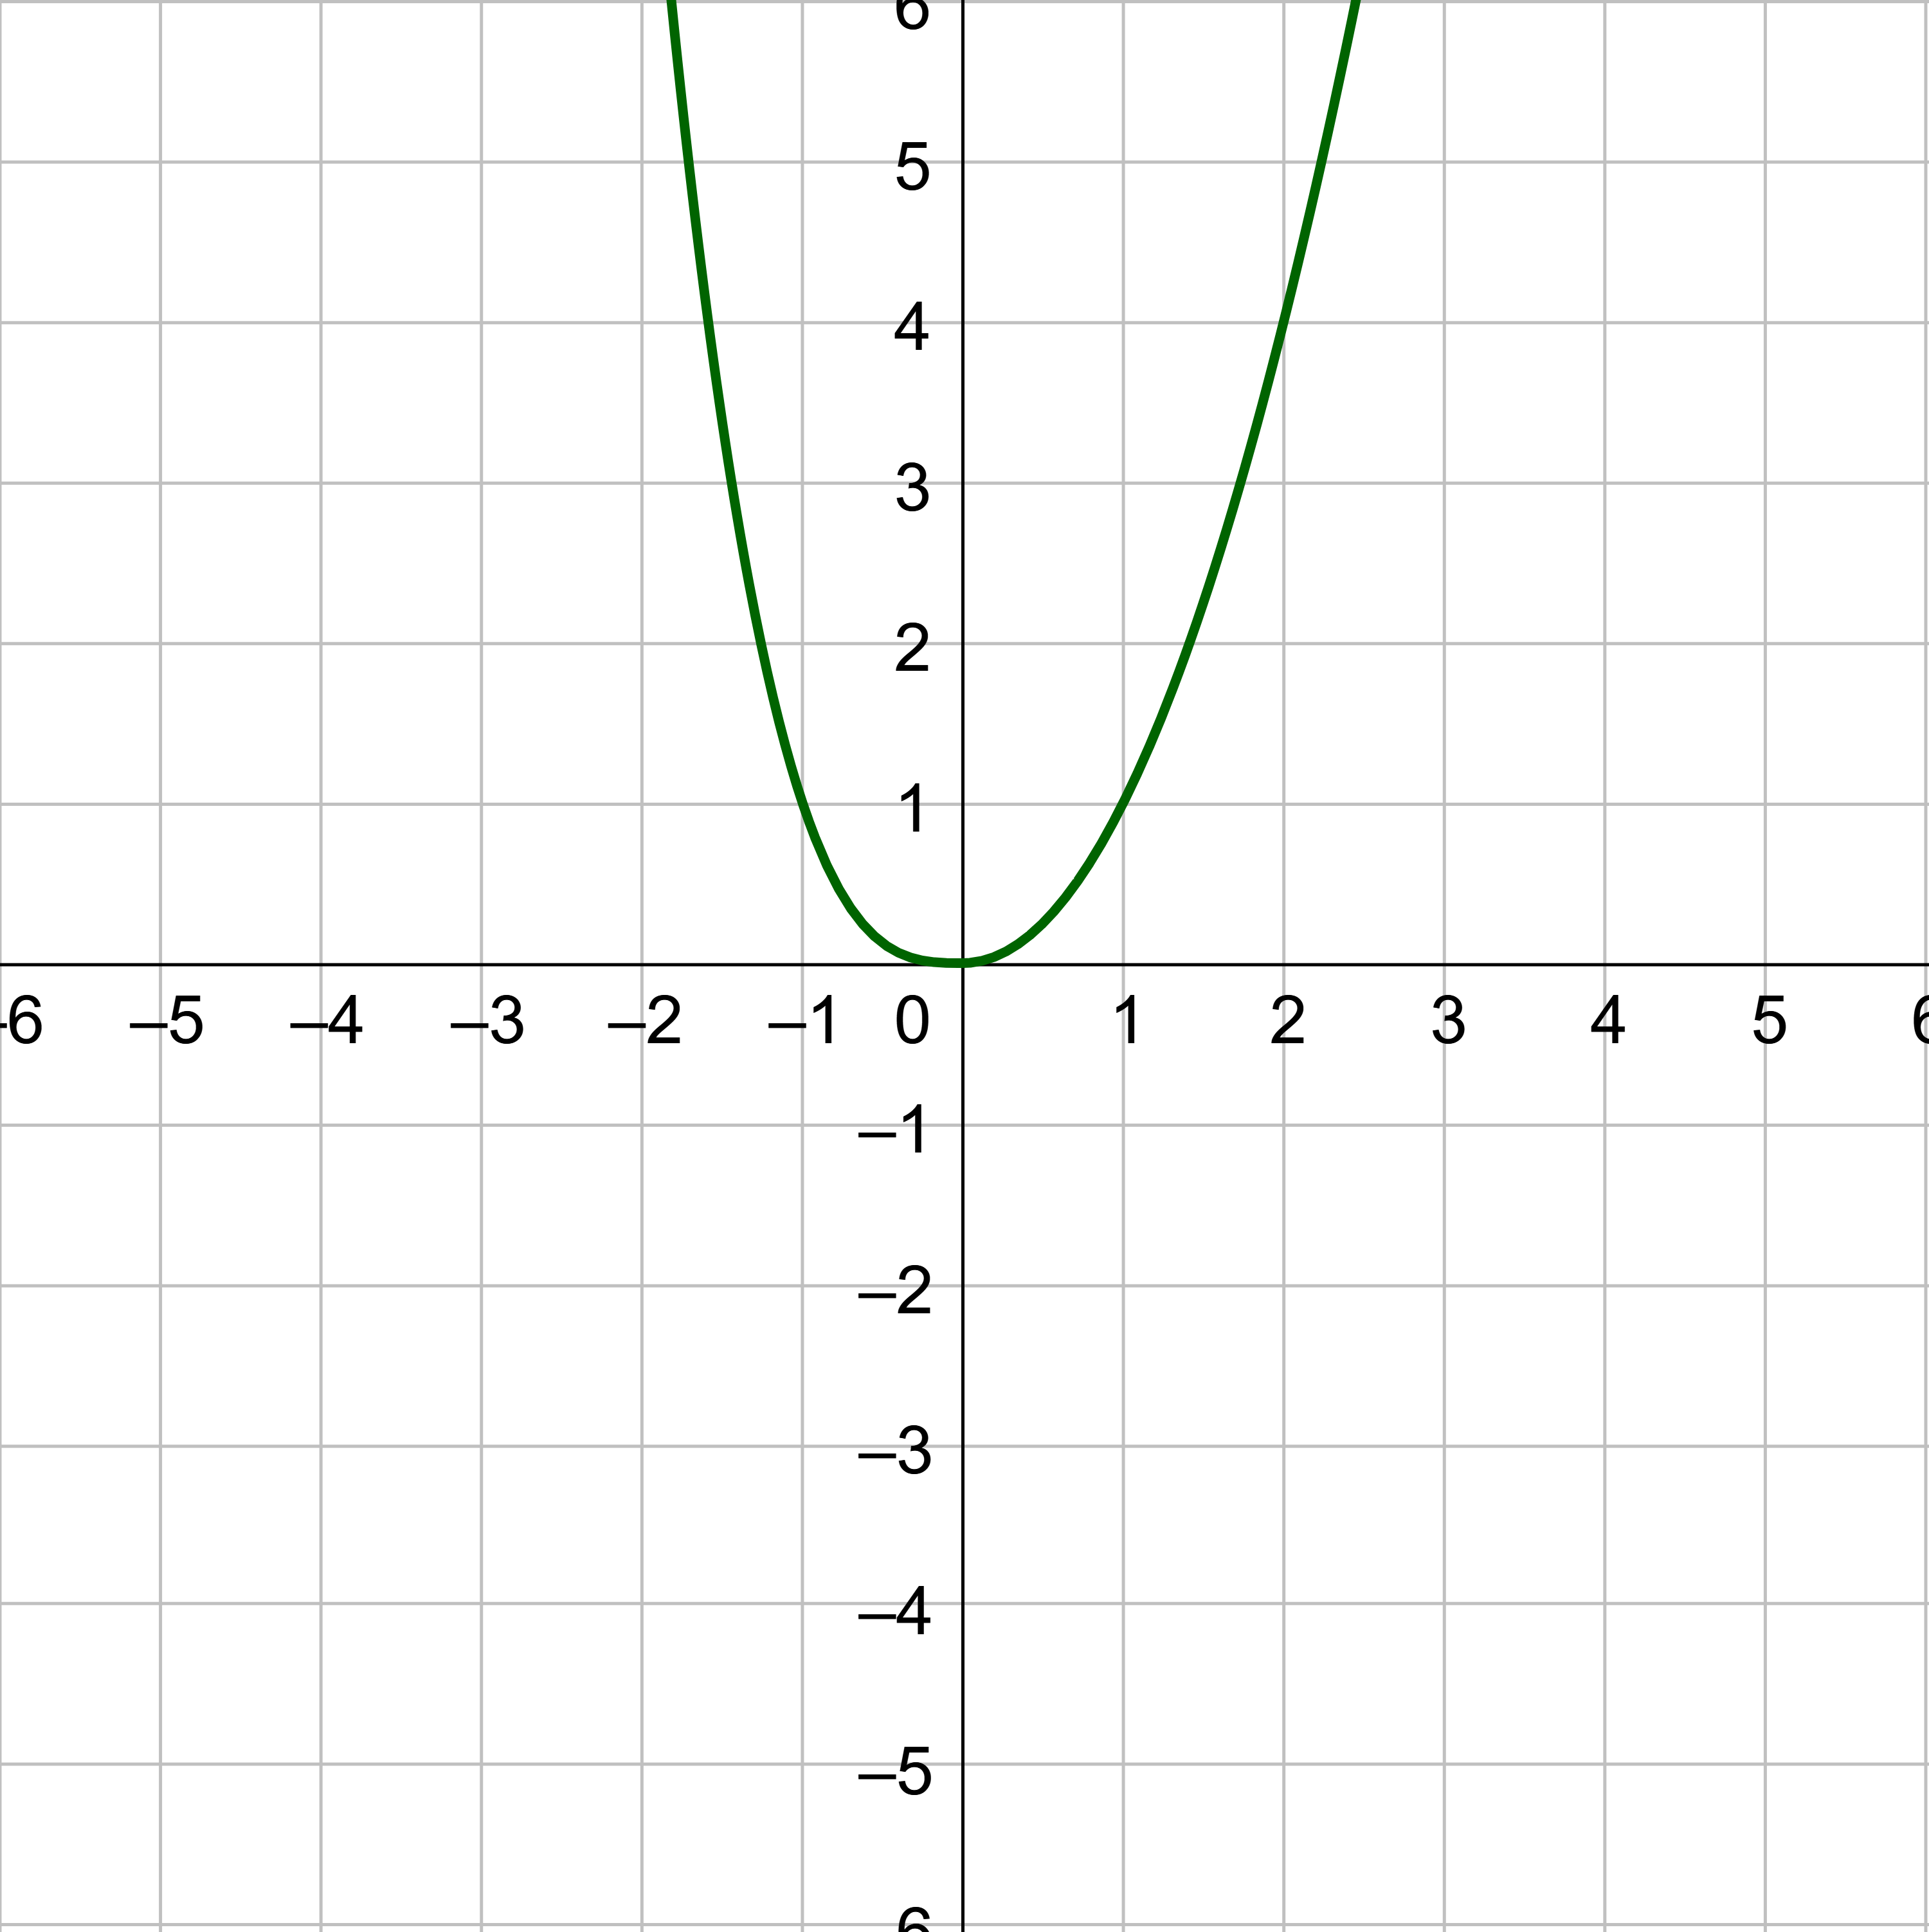
Quadratic functionf(x) = x2
Quadratic function f(x) = x2
Domain is all real numbers.
Range is only nonnegative real numbers, [0, ∞).
Decreasing over (−∞, 0) and increasing on (0, ∞).
Symmetric over the y-axis.
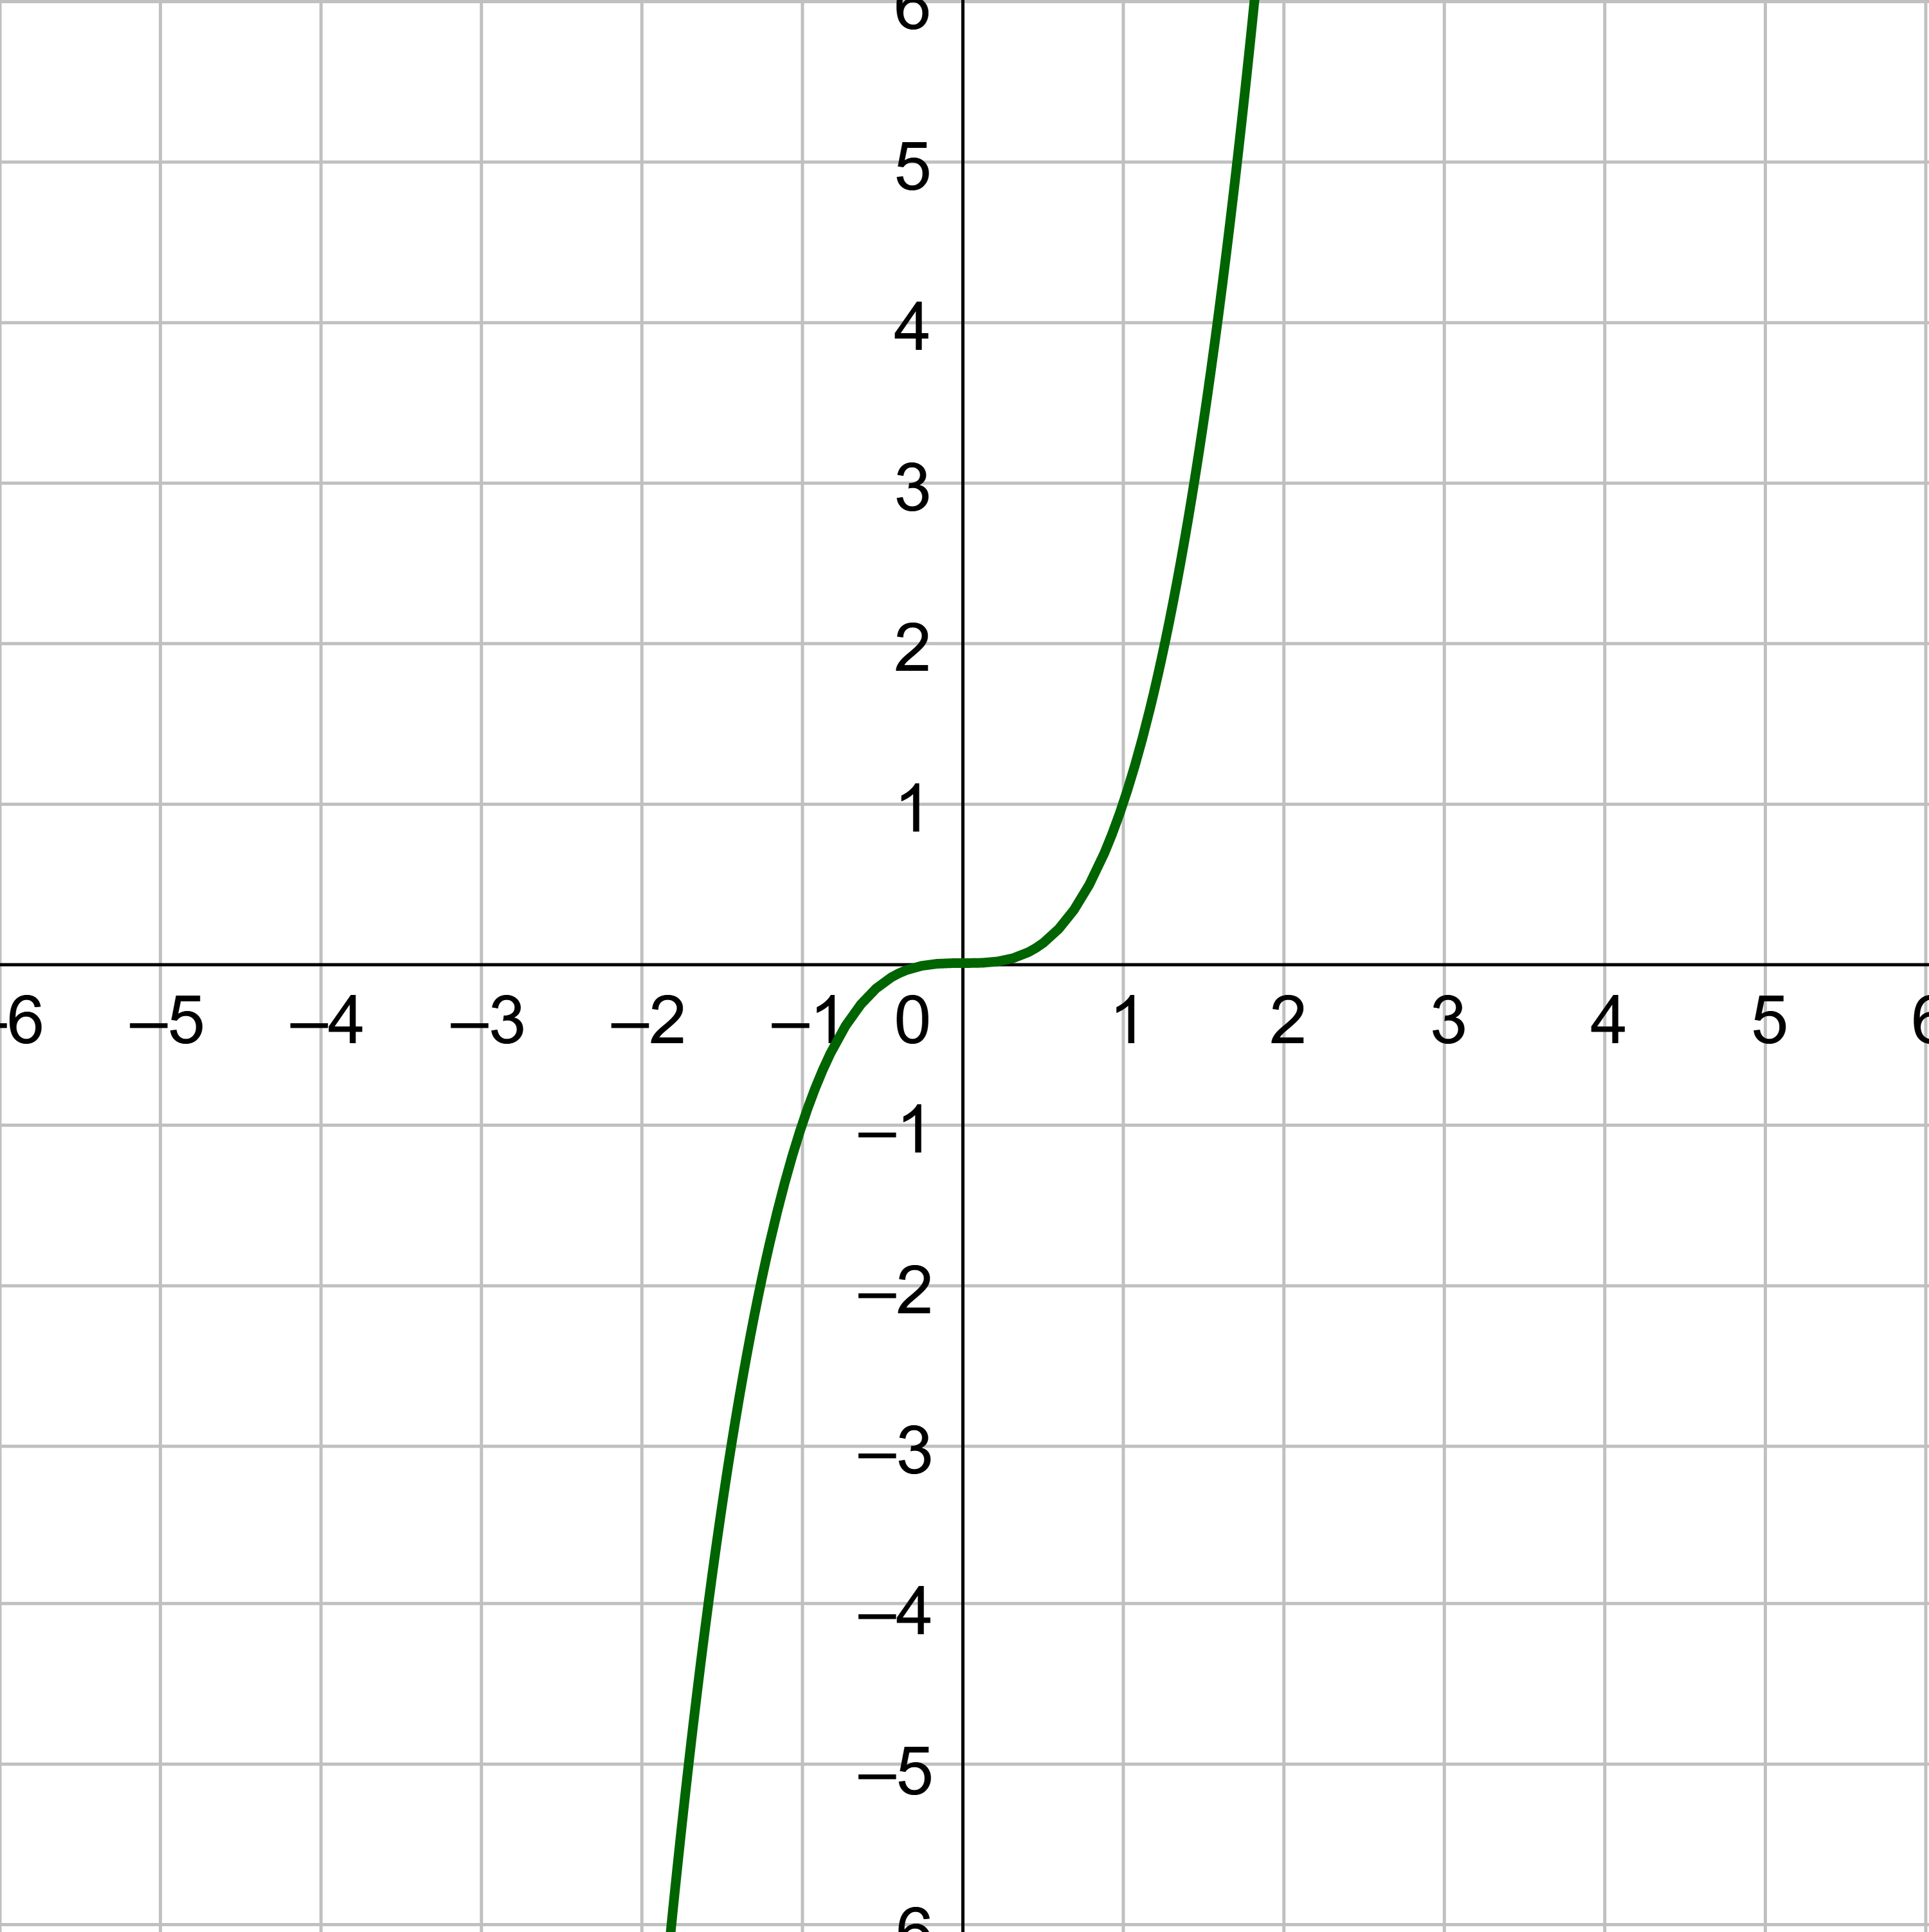
Cubic functionf(x) = x3
Cubic function f(x) = x3
Domain is all real numbers.
Range is all real numbers.
Increasing on (−∞, ∞).
Symmetric about the origin.
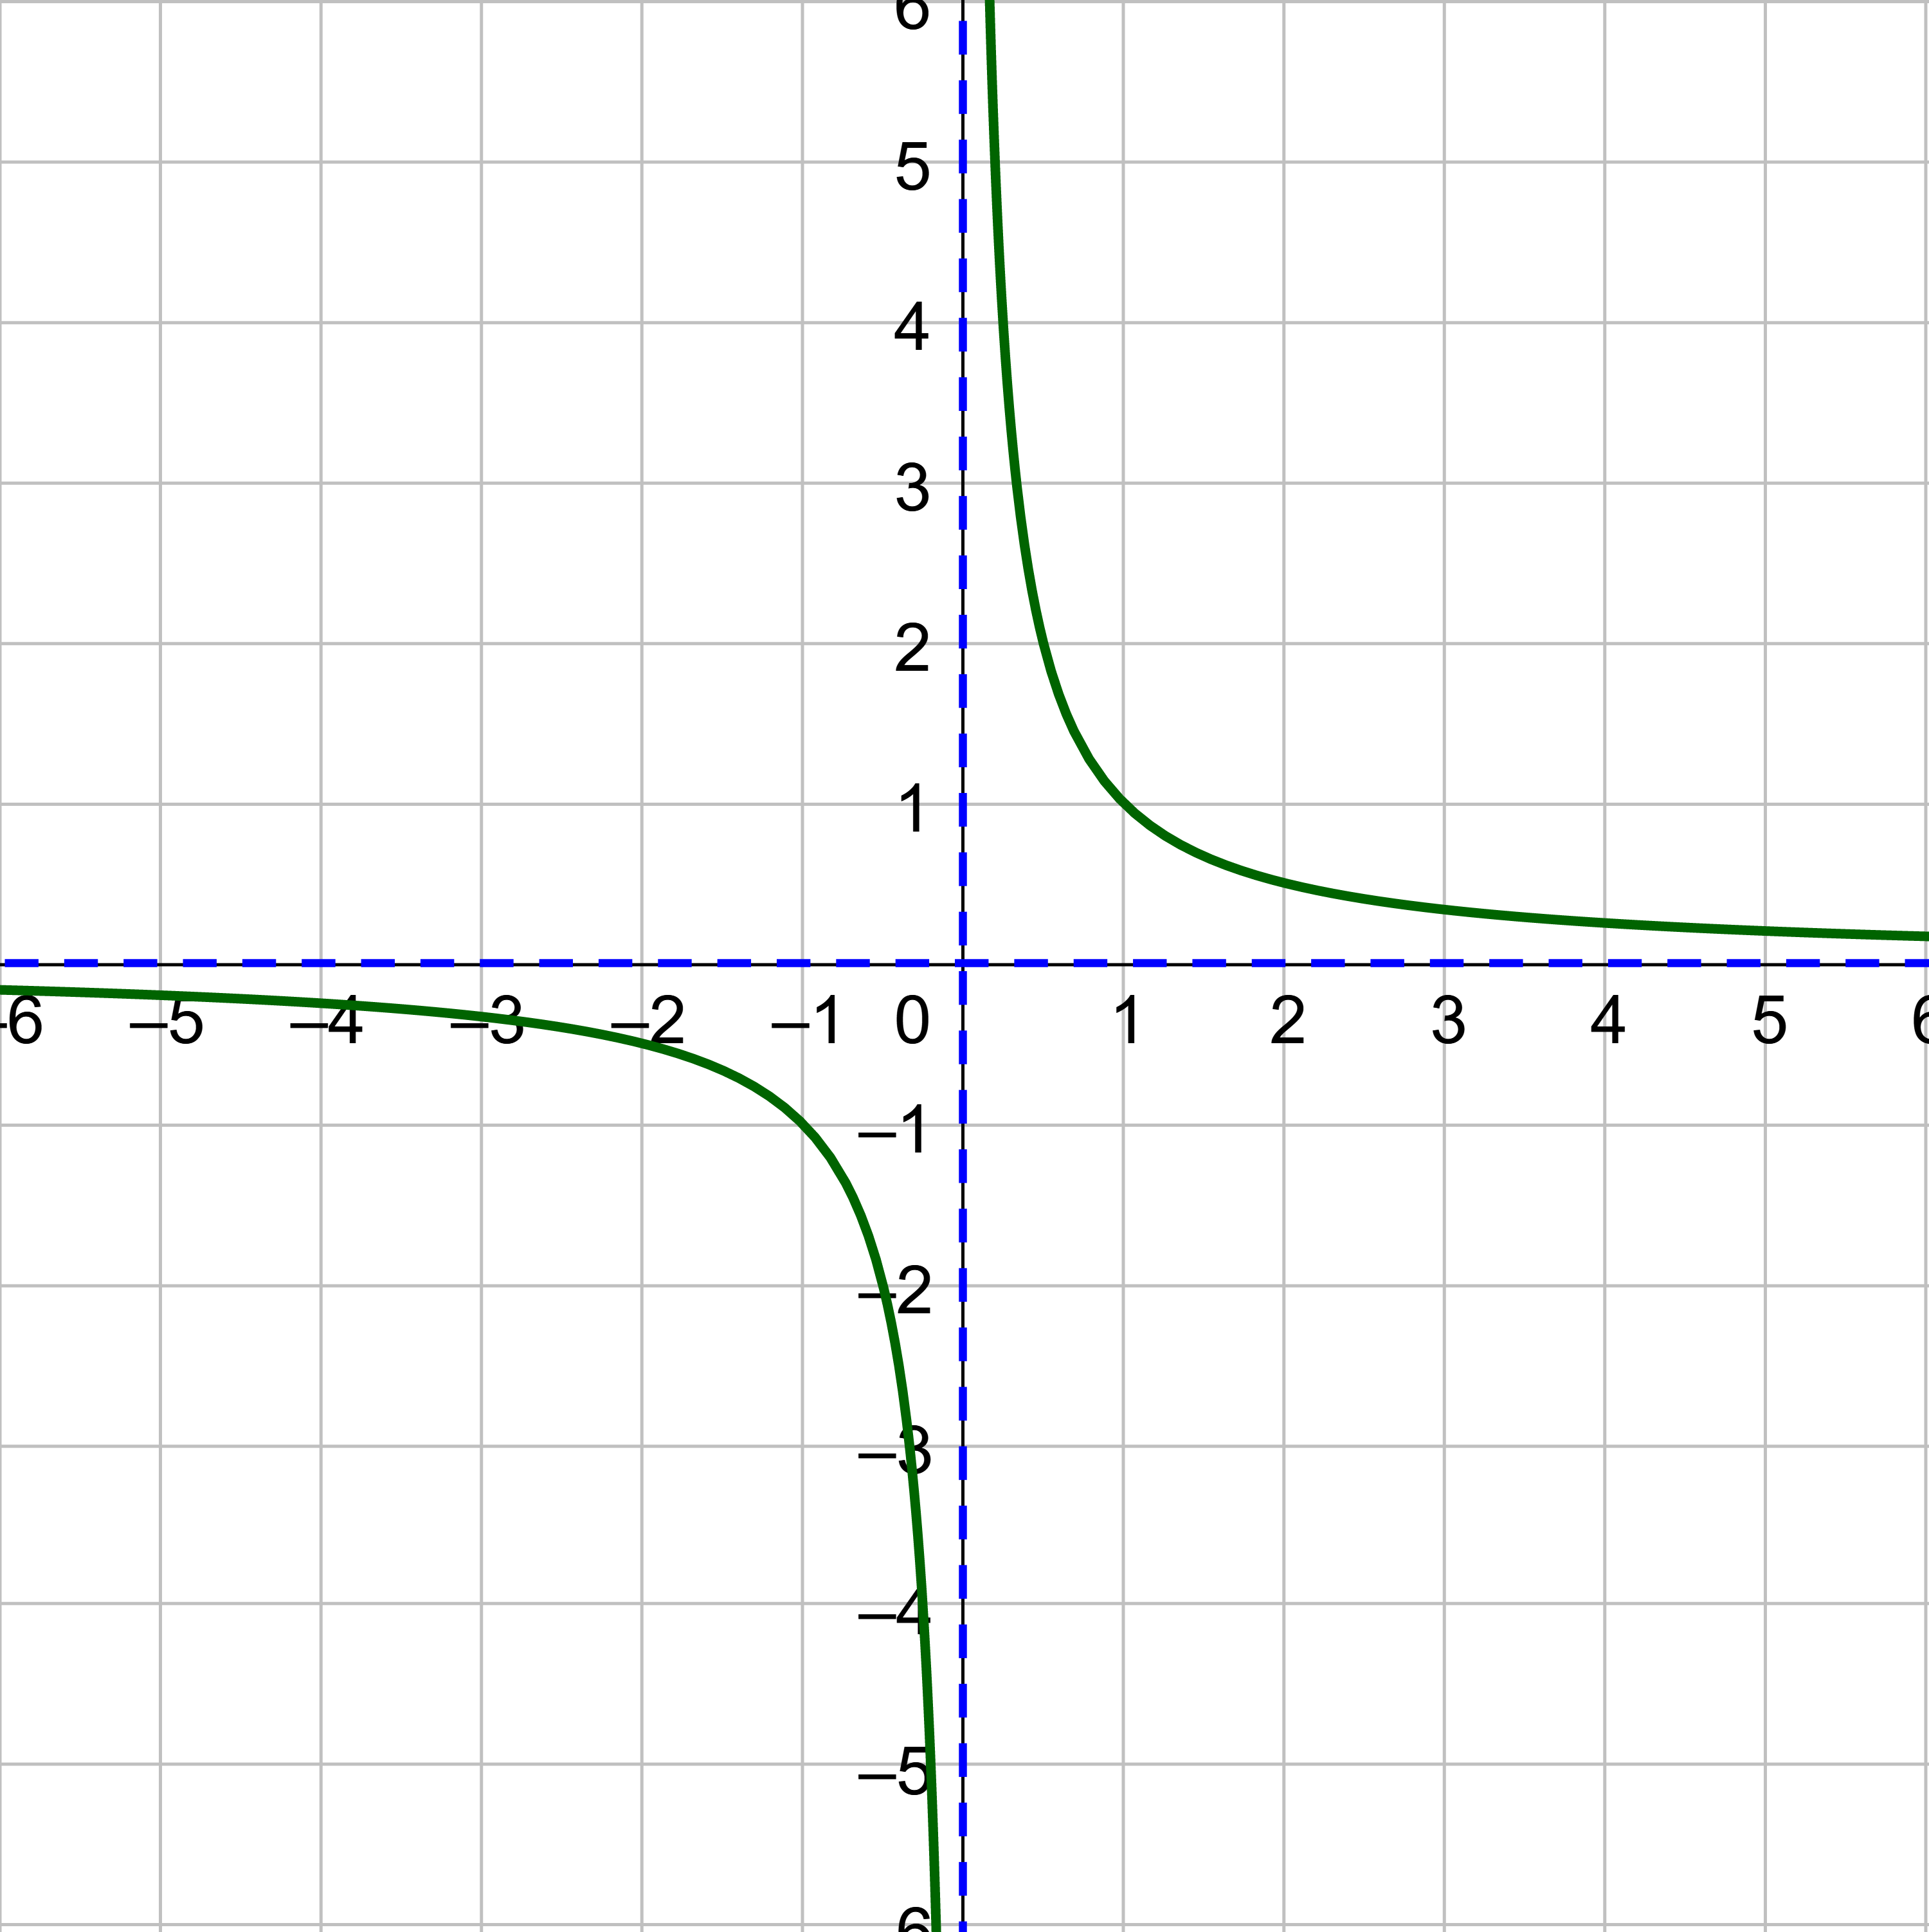
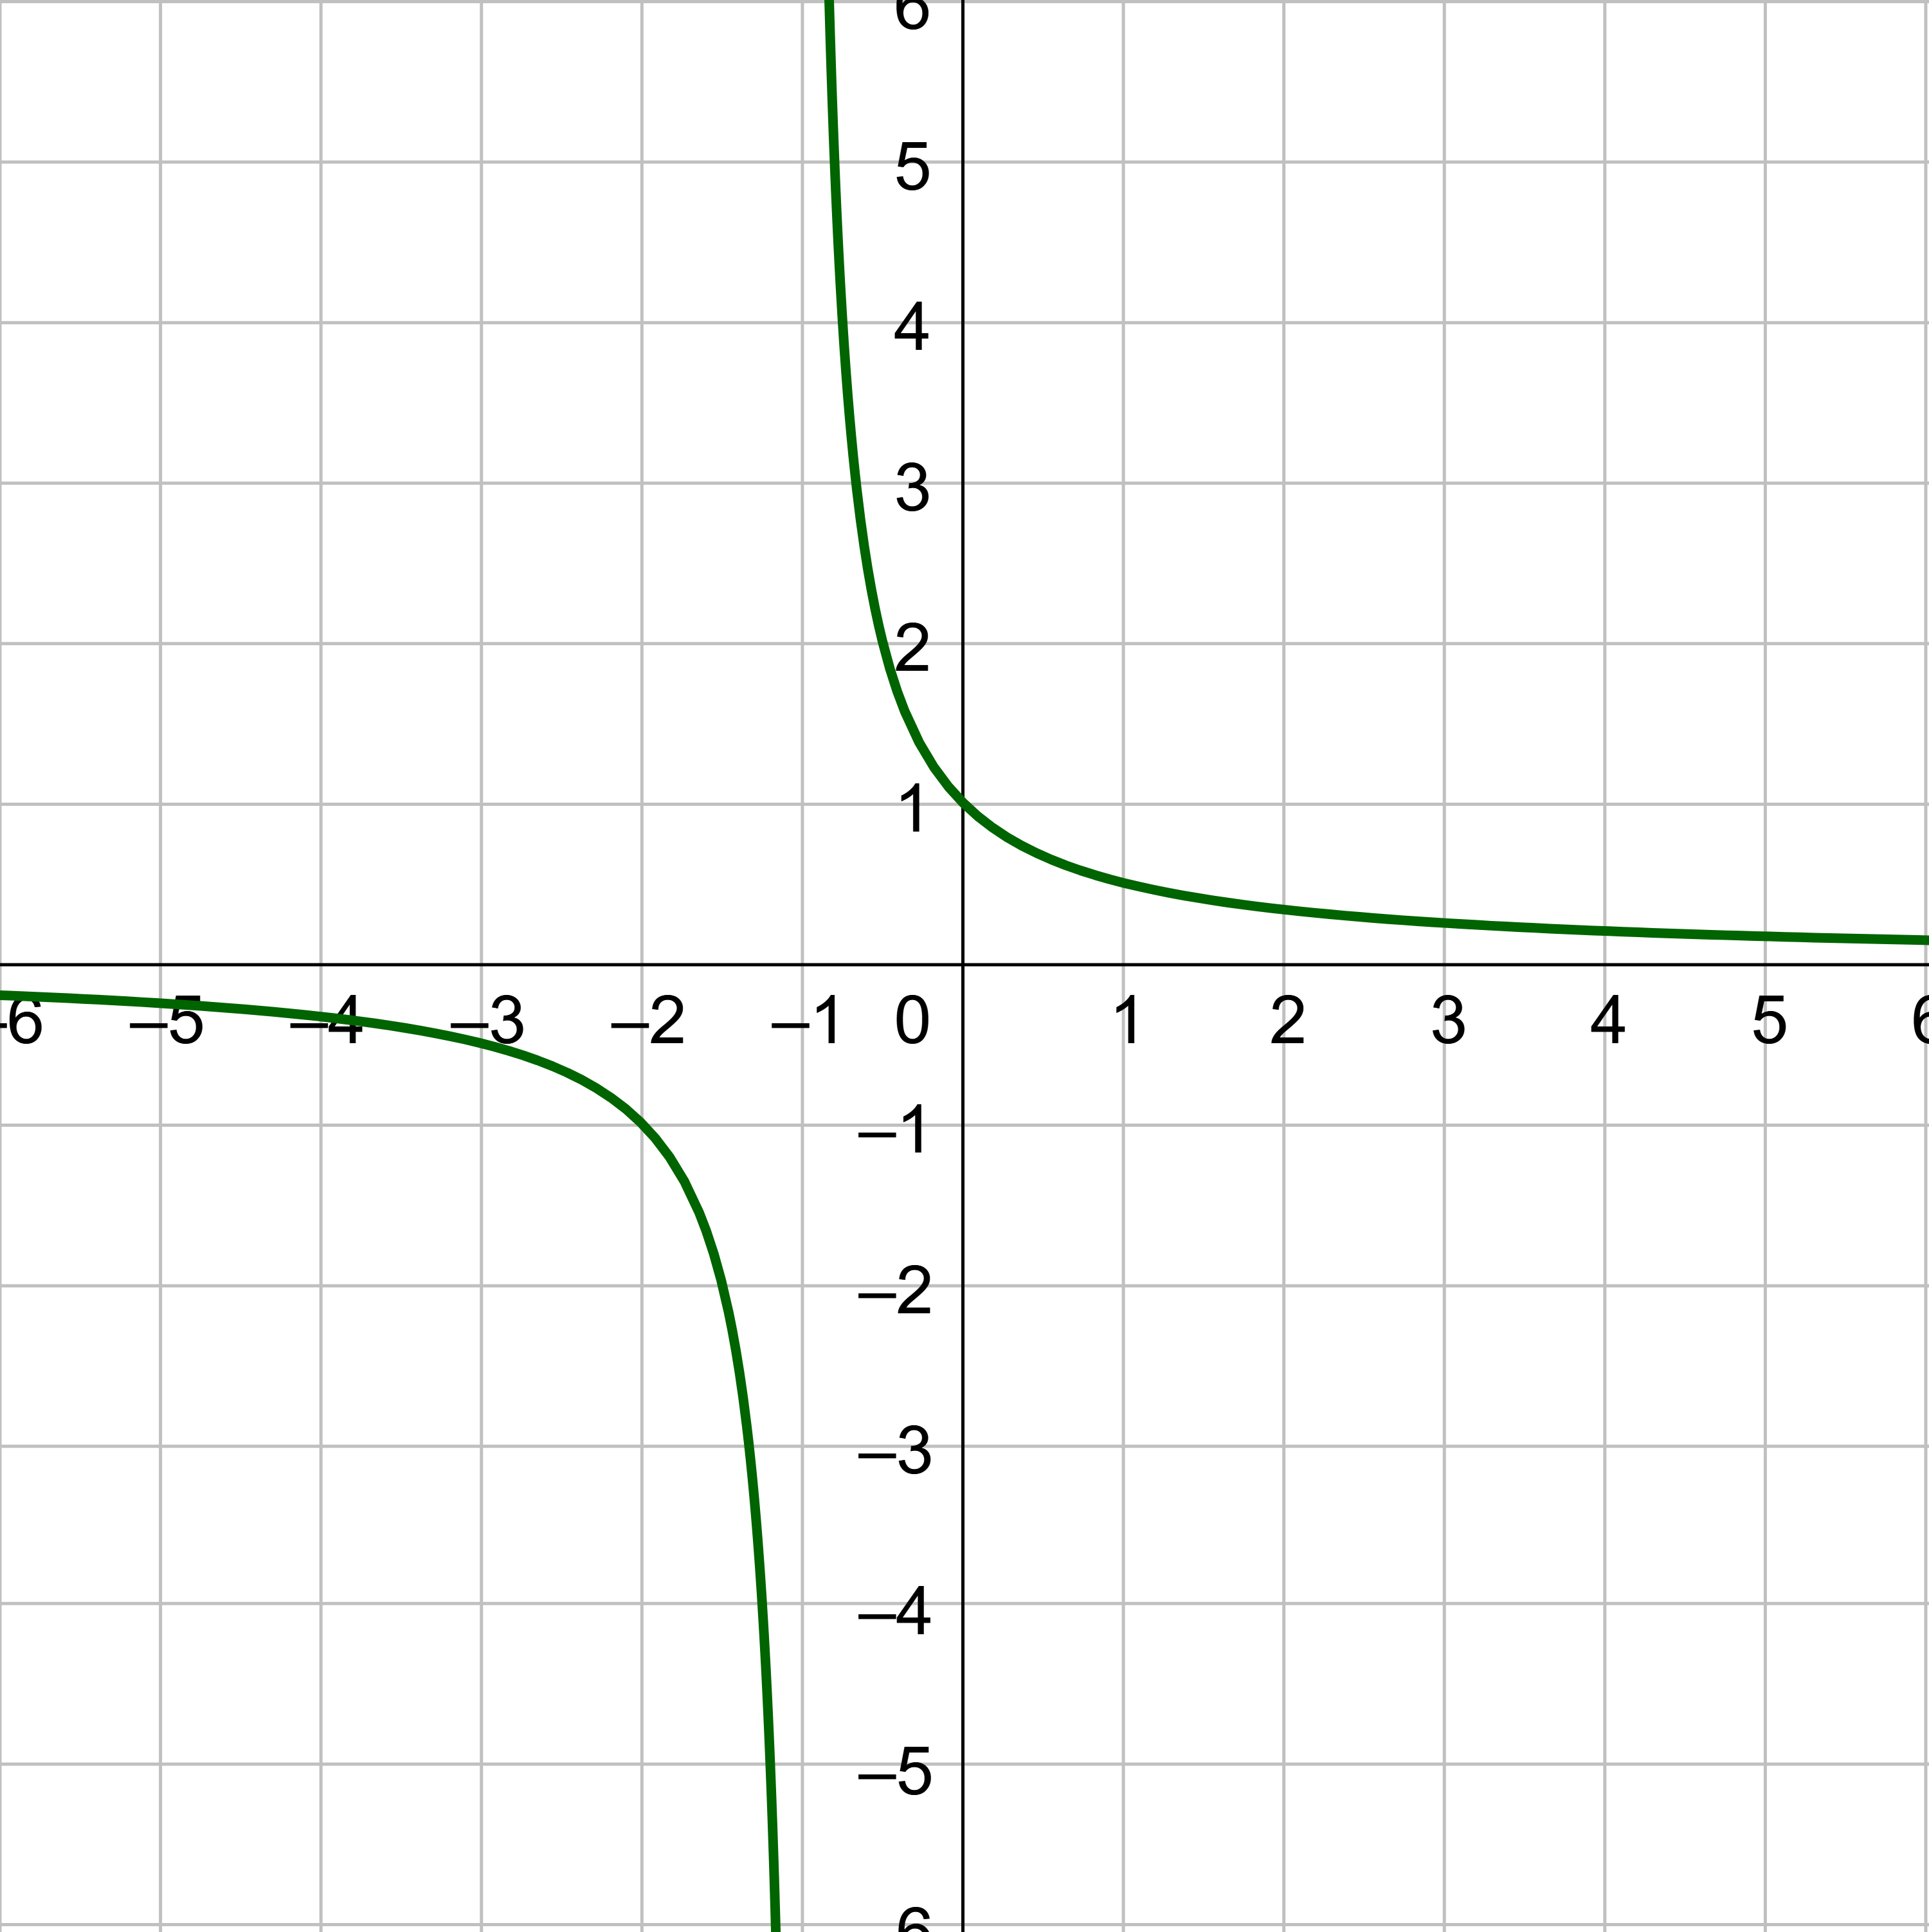
Reciprocal function \(f(x) = \frac{1}{x}\)
Reciprocal function \(f(x) = \frac{1}{x}\)
Domain is all real numbers except 0, {x|x ≠ 0}.
Range is all real numbers except 0, {y|y ≠ 0}.
Decreasing on (−∞, 0) and (0, ∞).
Symmetric about the origin and over the lines y = x and y = −x.
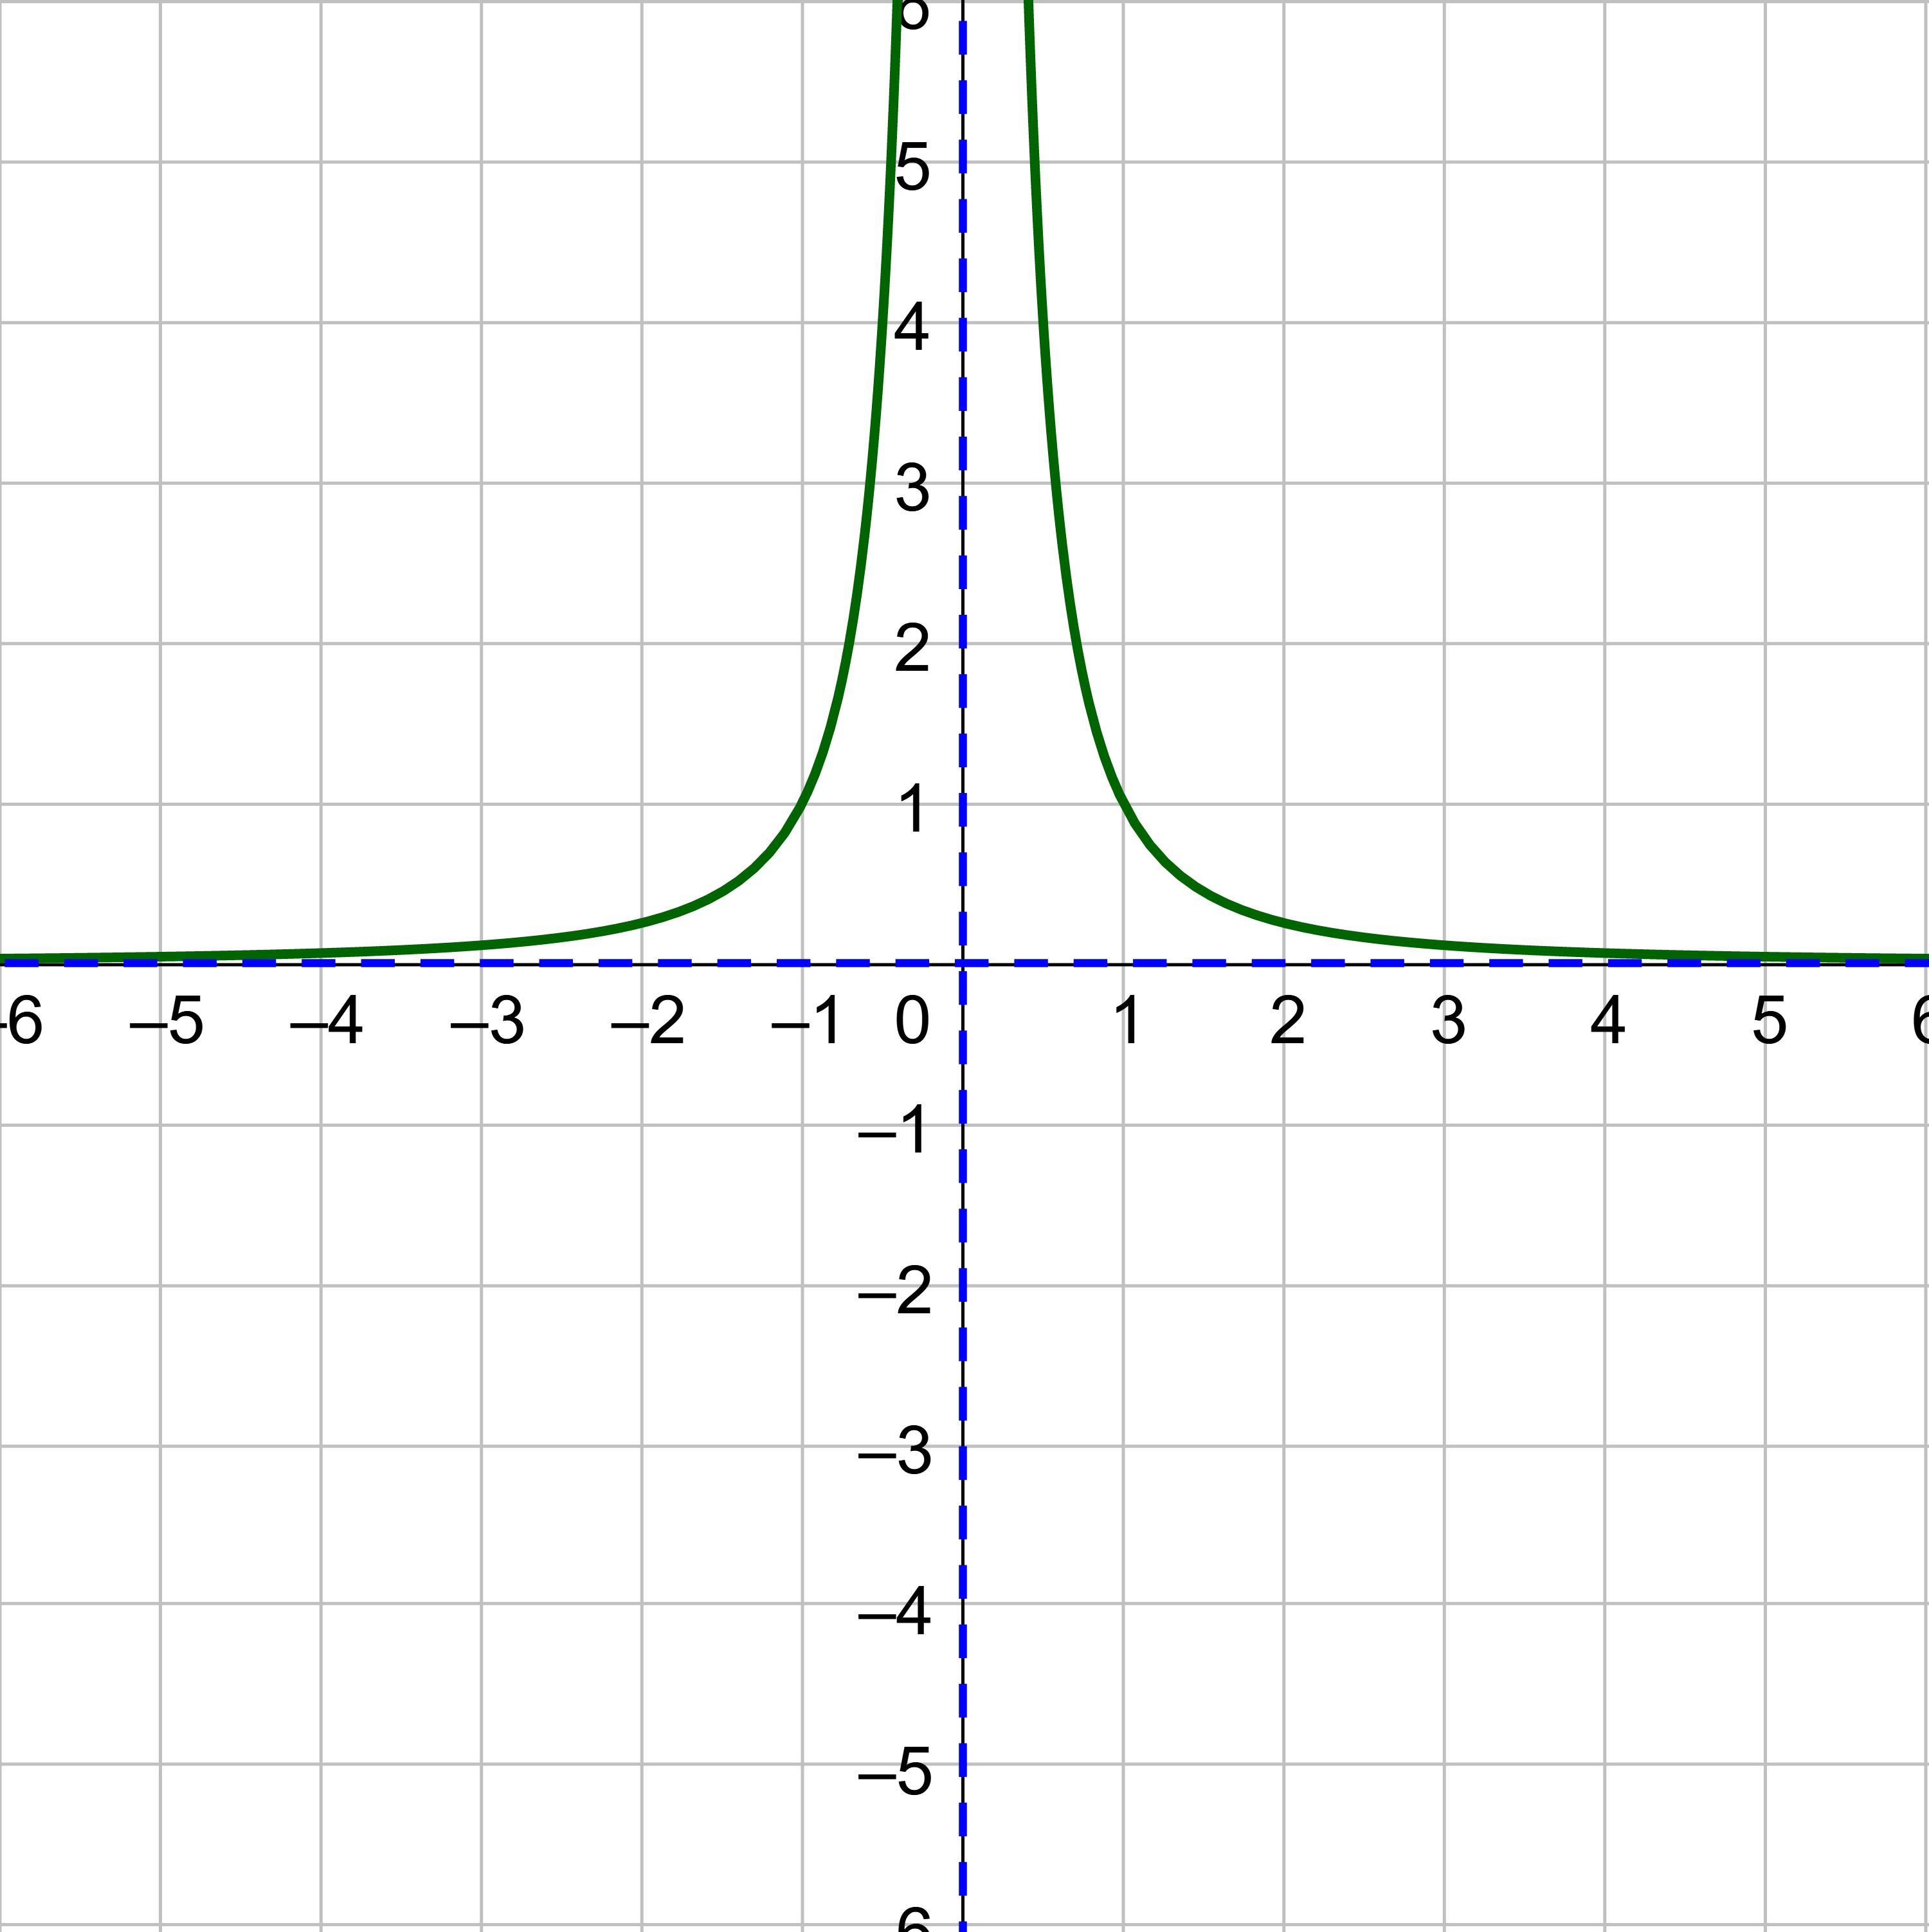
Reciprocal squared function \(f(x) = \frac{1}{x^2}\)
Reciprocal squared function \(f(x) = \frac{1}{x^2}\)
Domain is all real numbers except 0, {x|x ≠ 0}.
Range is only positive real numbers, (0, ∞).
Increasing on (−∞, 0) and decreasing on (0, ∞).
Symmetric over the y-axis.
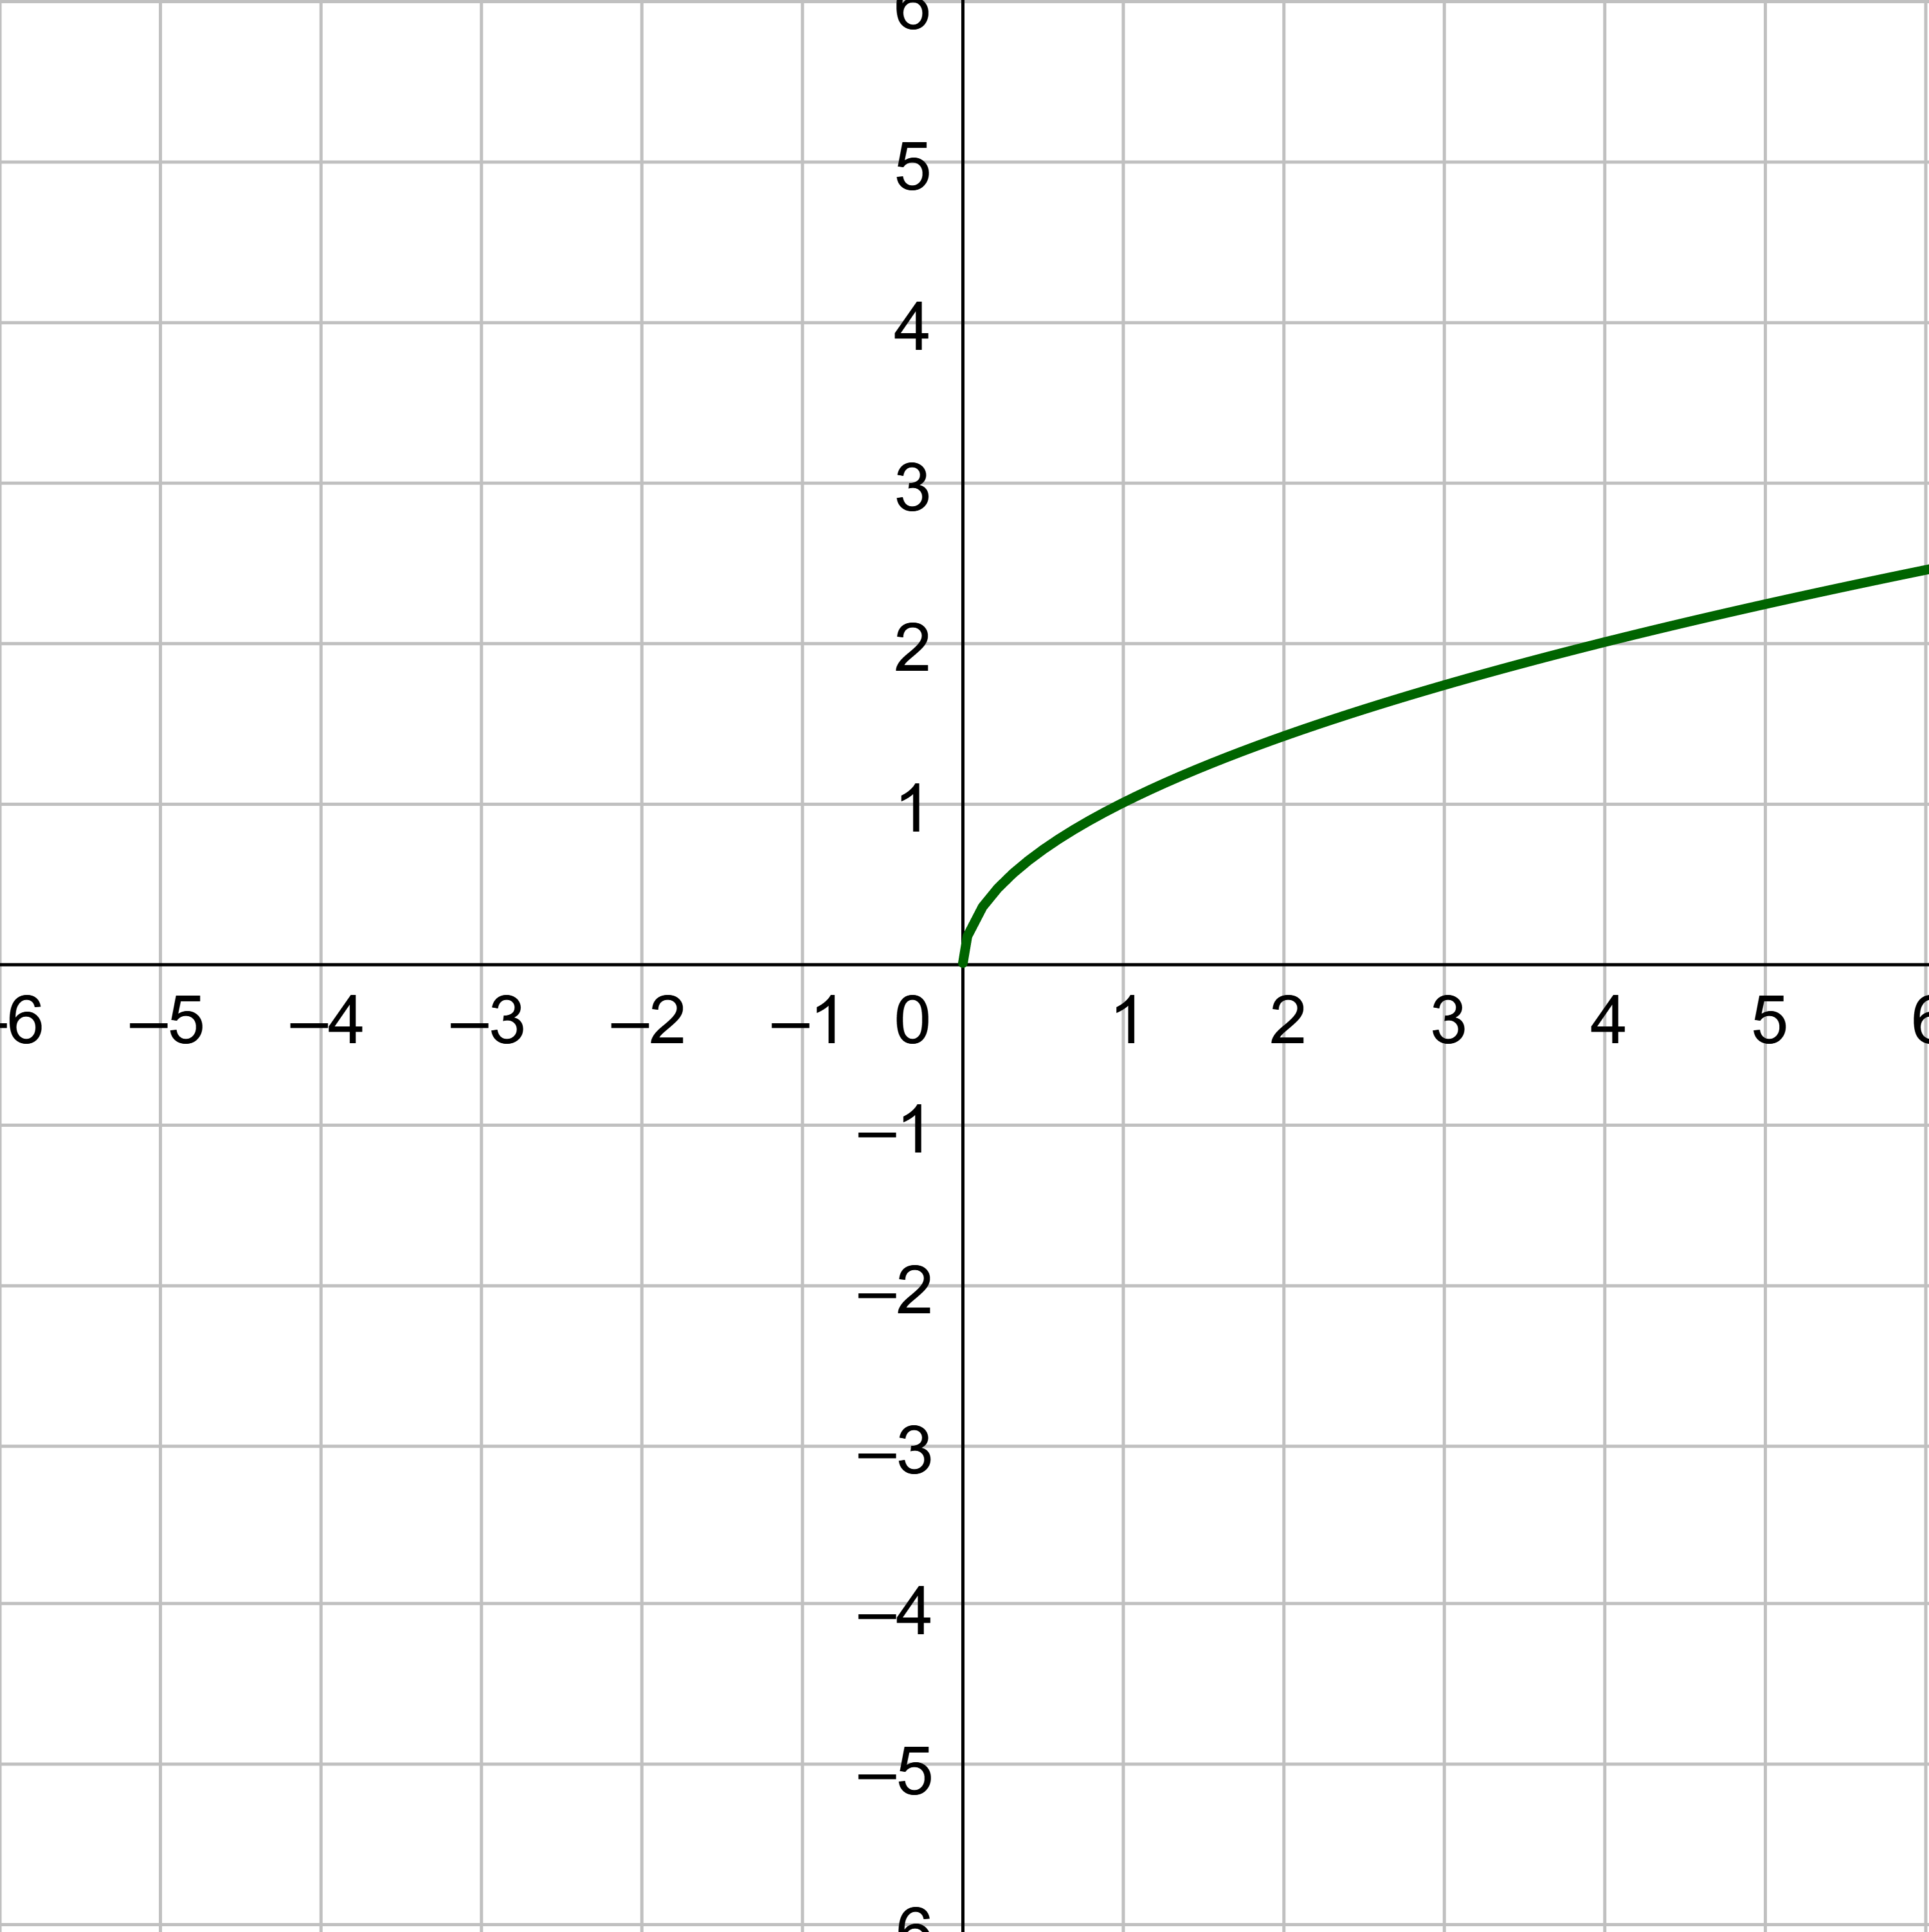
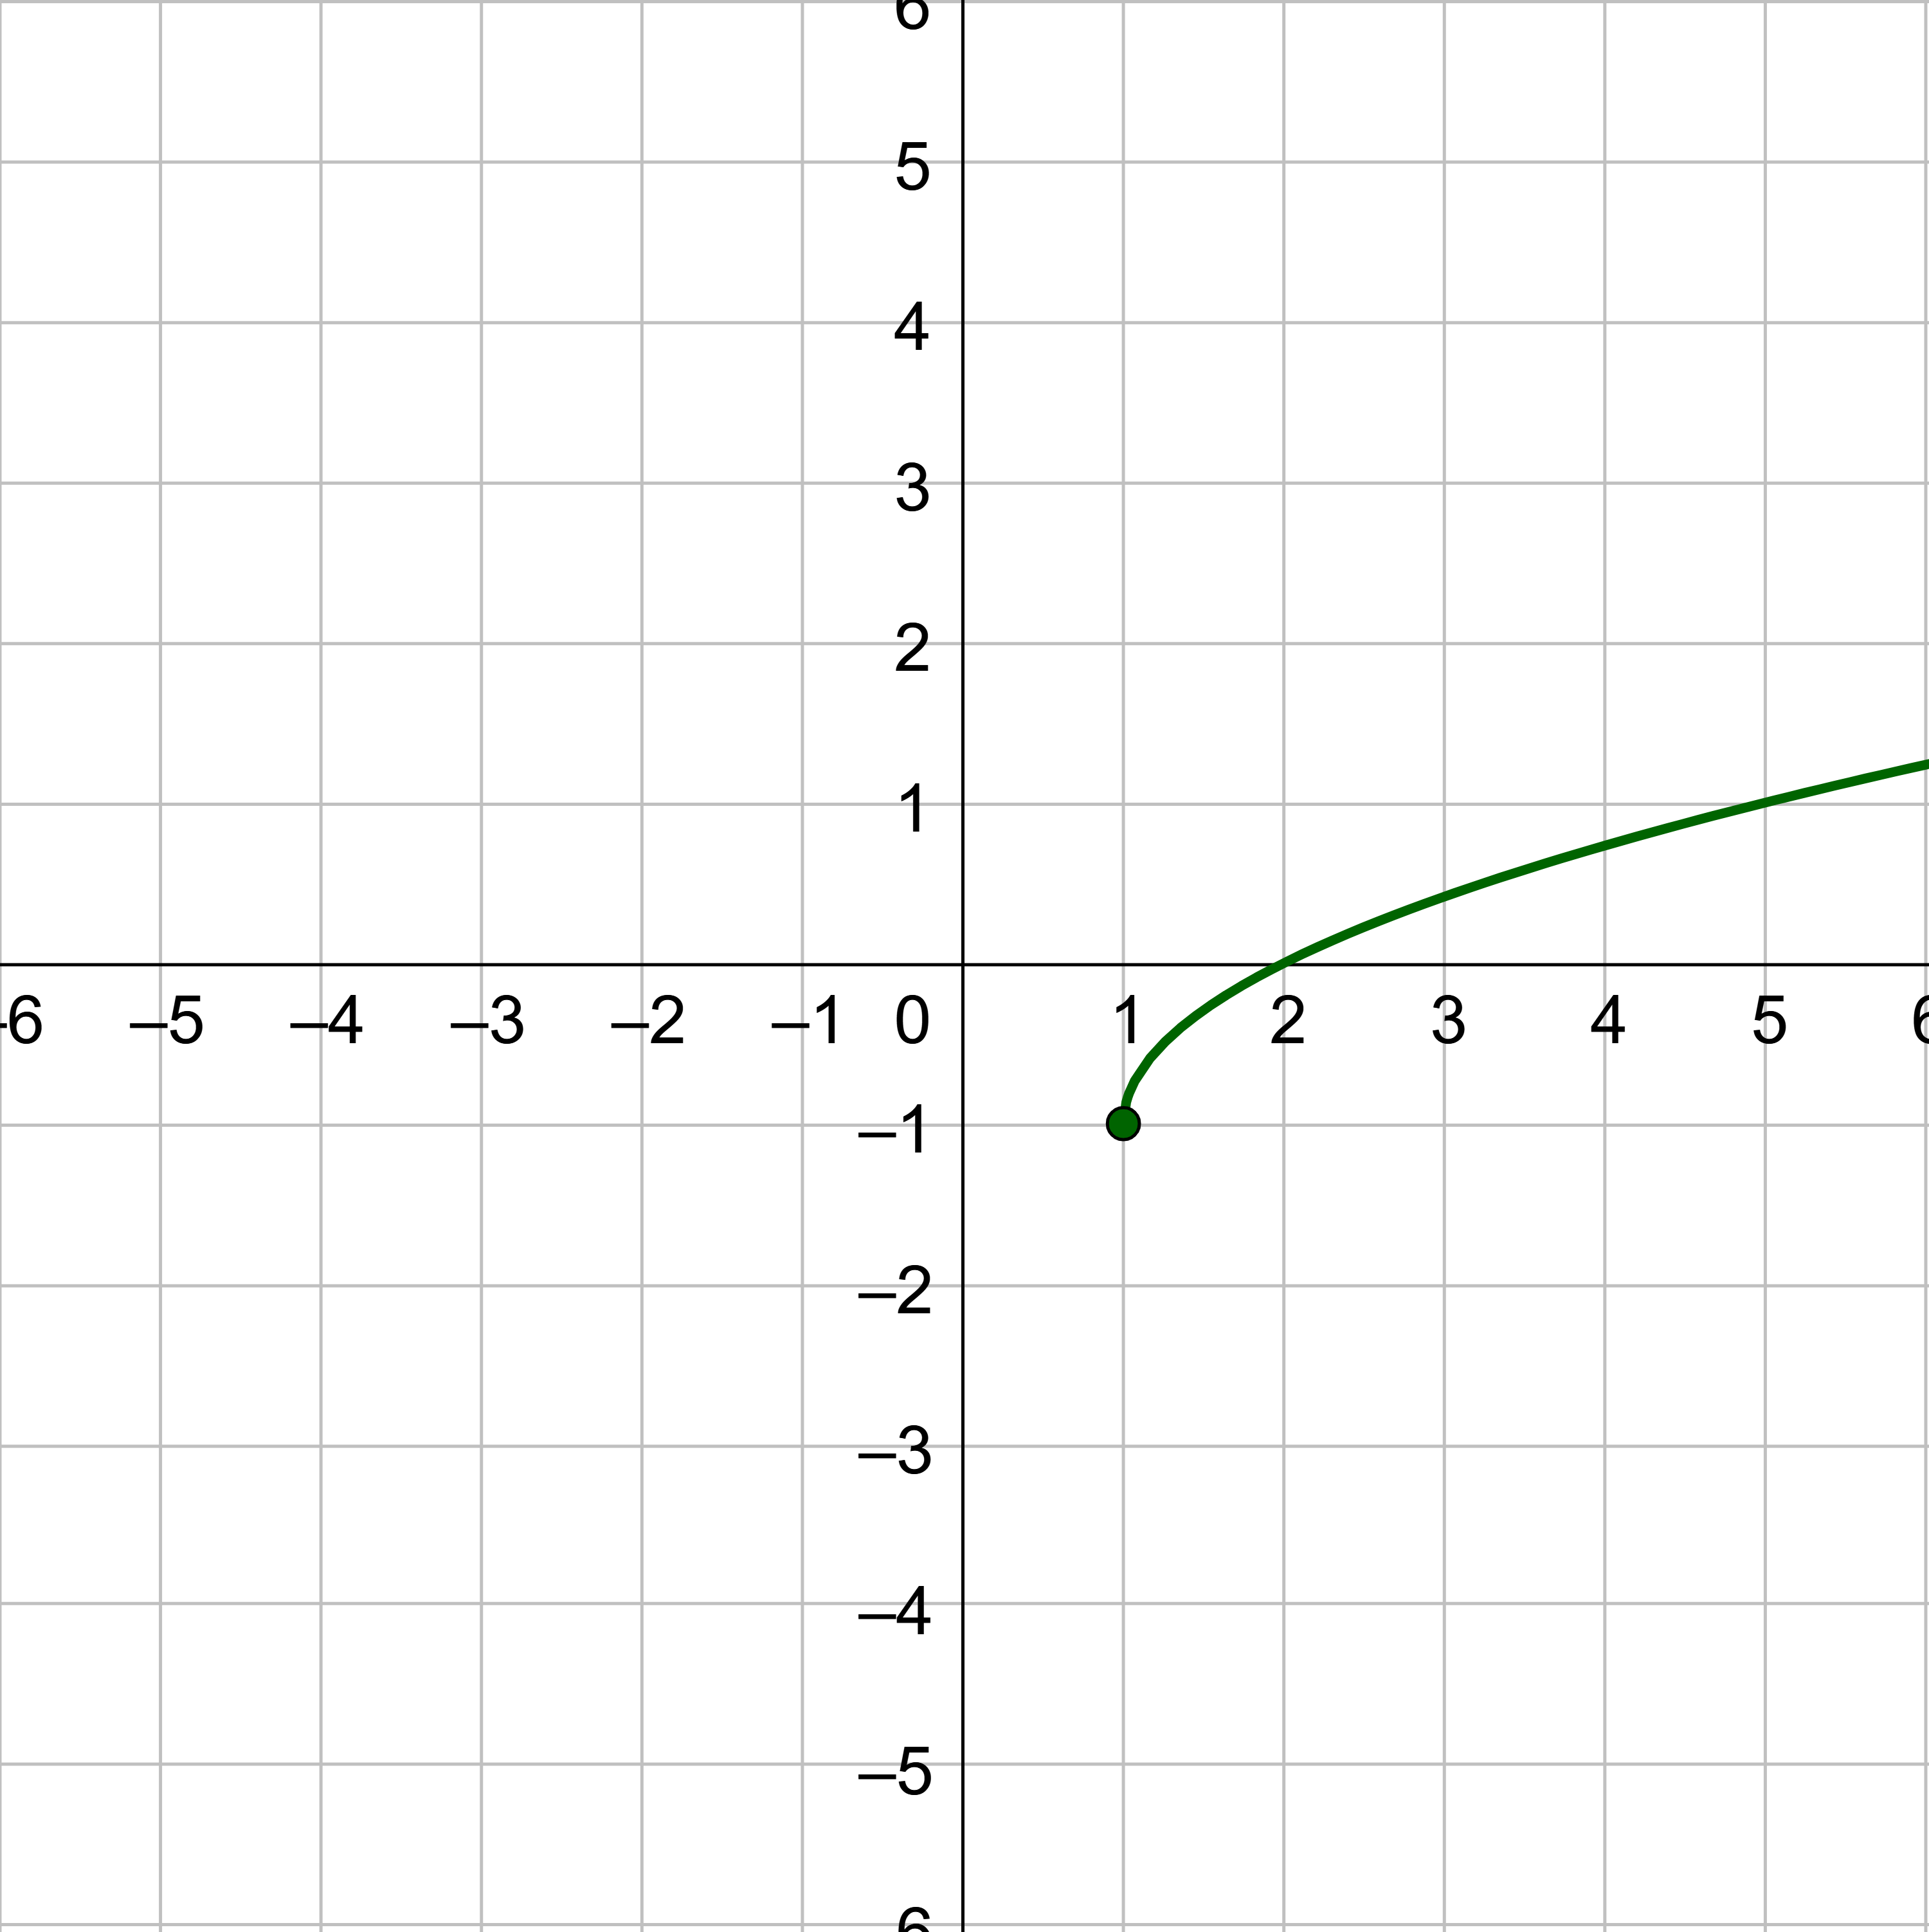
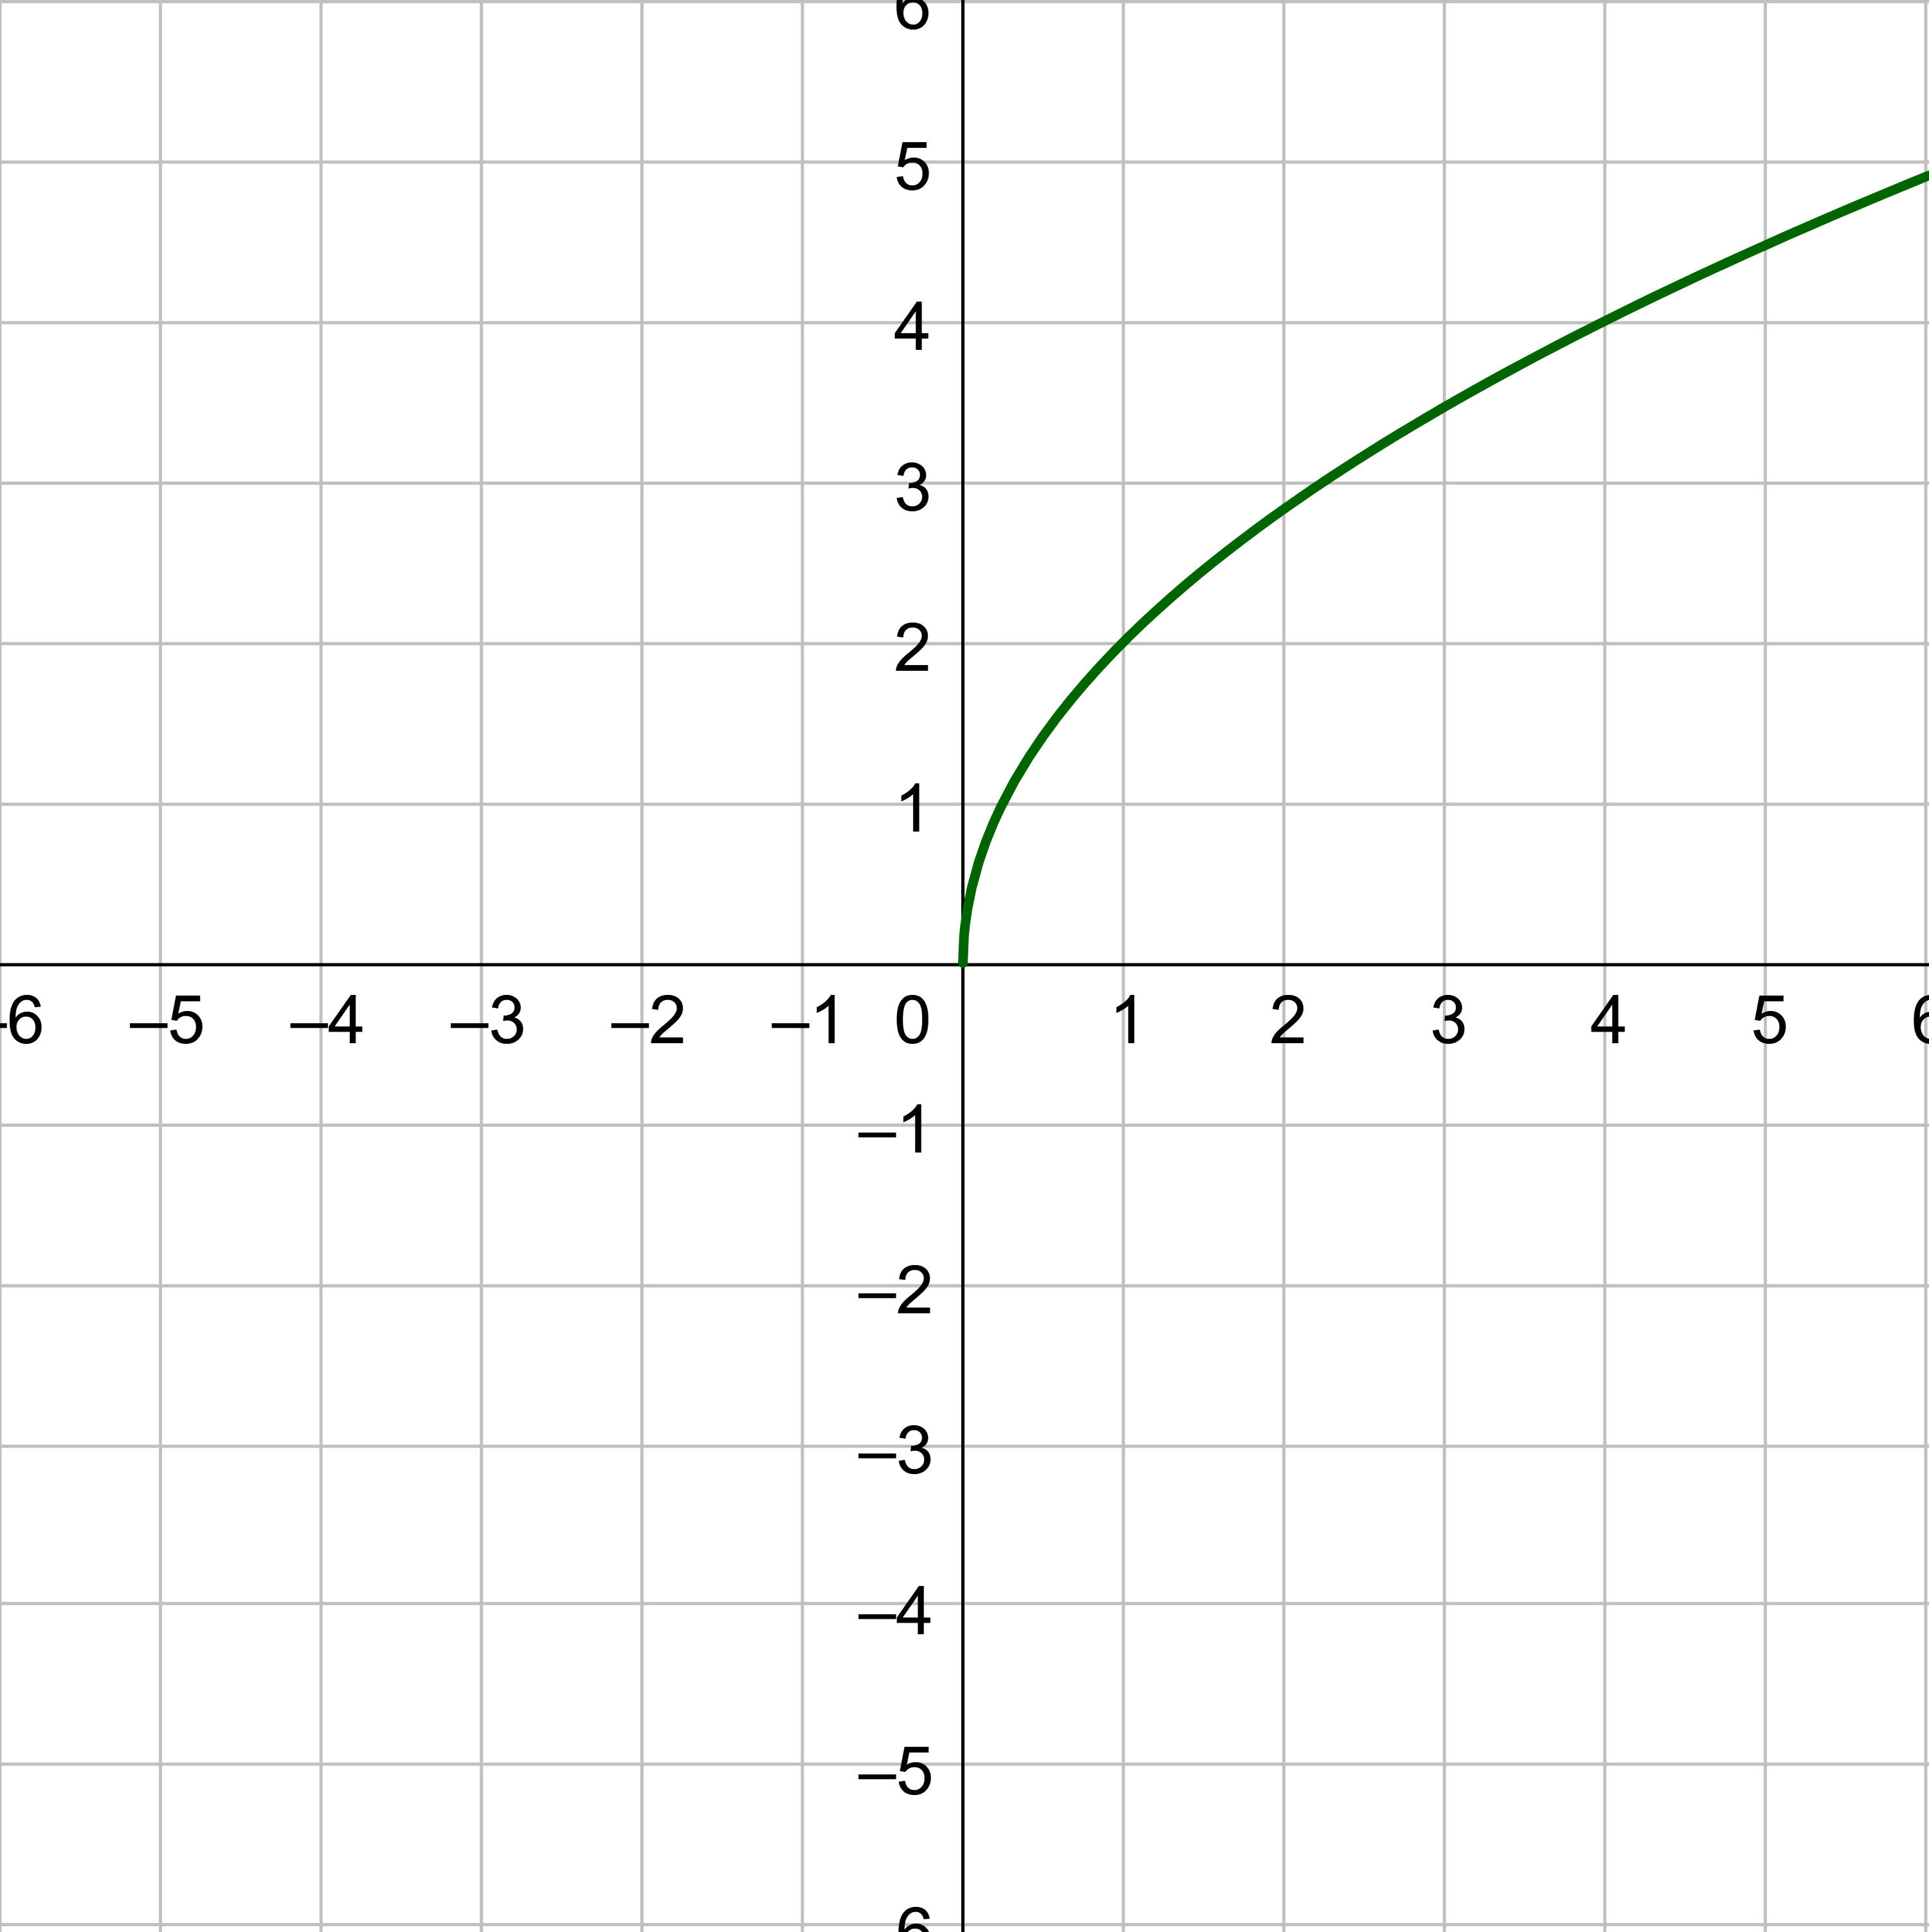
Square root function \(f(x) = \sqrt{x}\)
Square root function \(f(x) = \sqrt{x}\)
Domain is 0 or greater, [0, ∞).
Range is 0 or greater, [0, ∞).
Increasing on (0, ∞).
No symmetry.
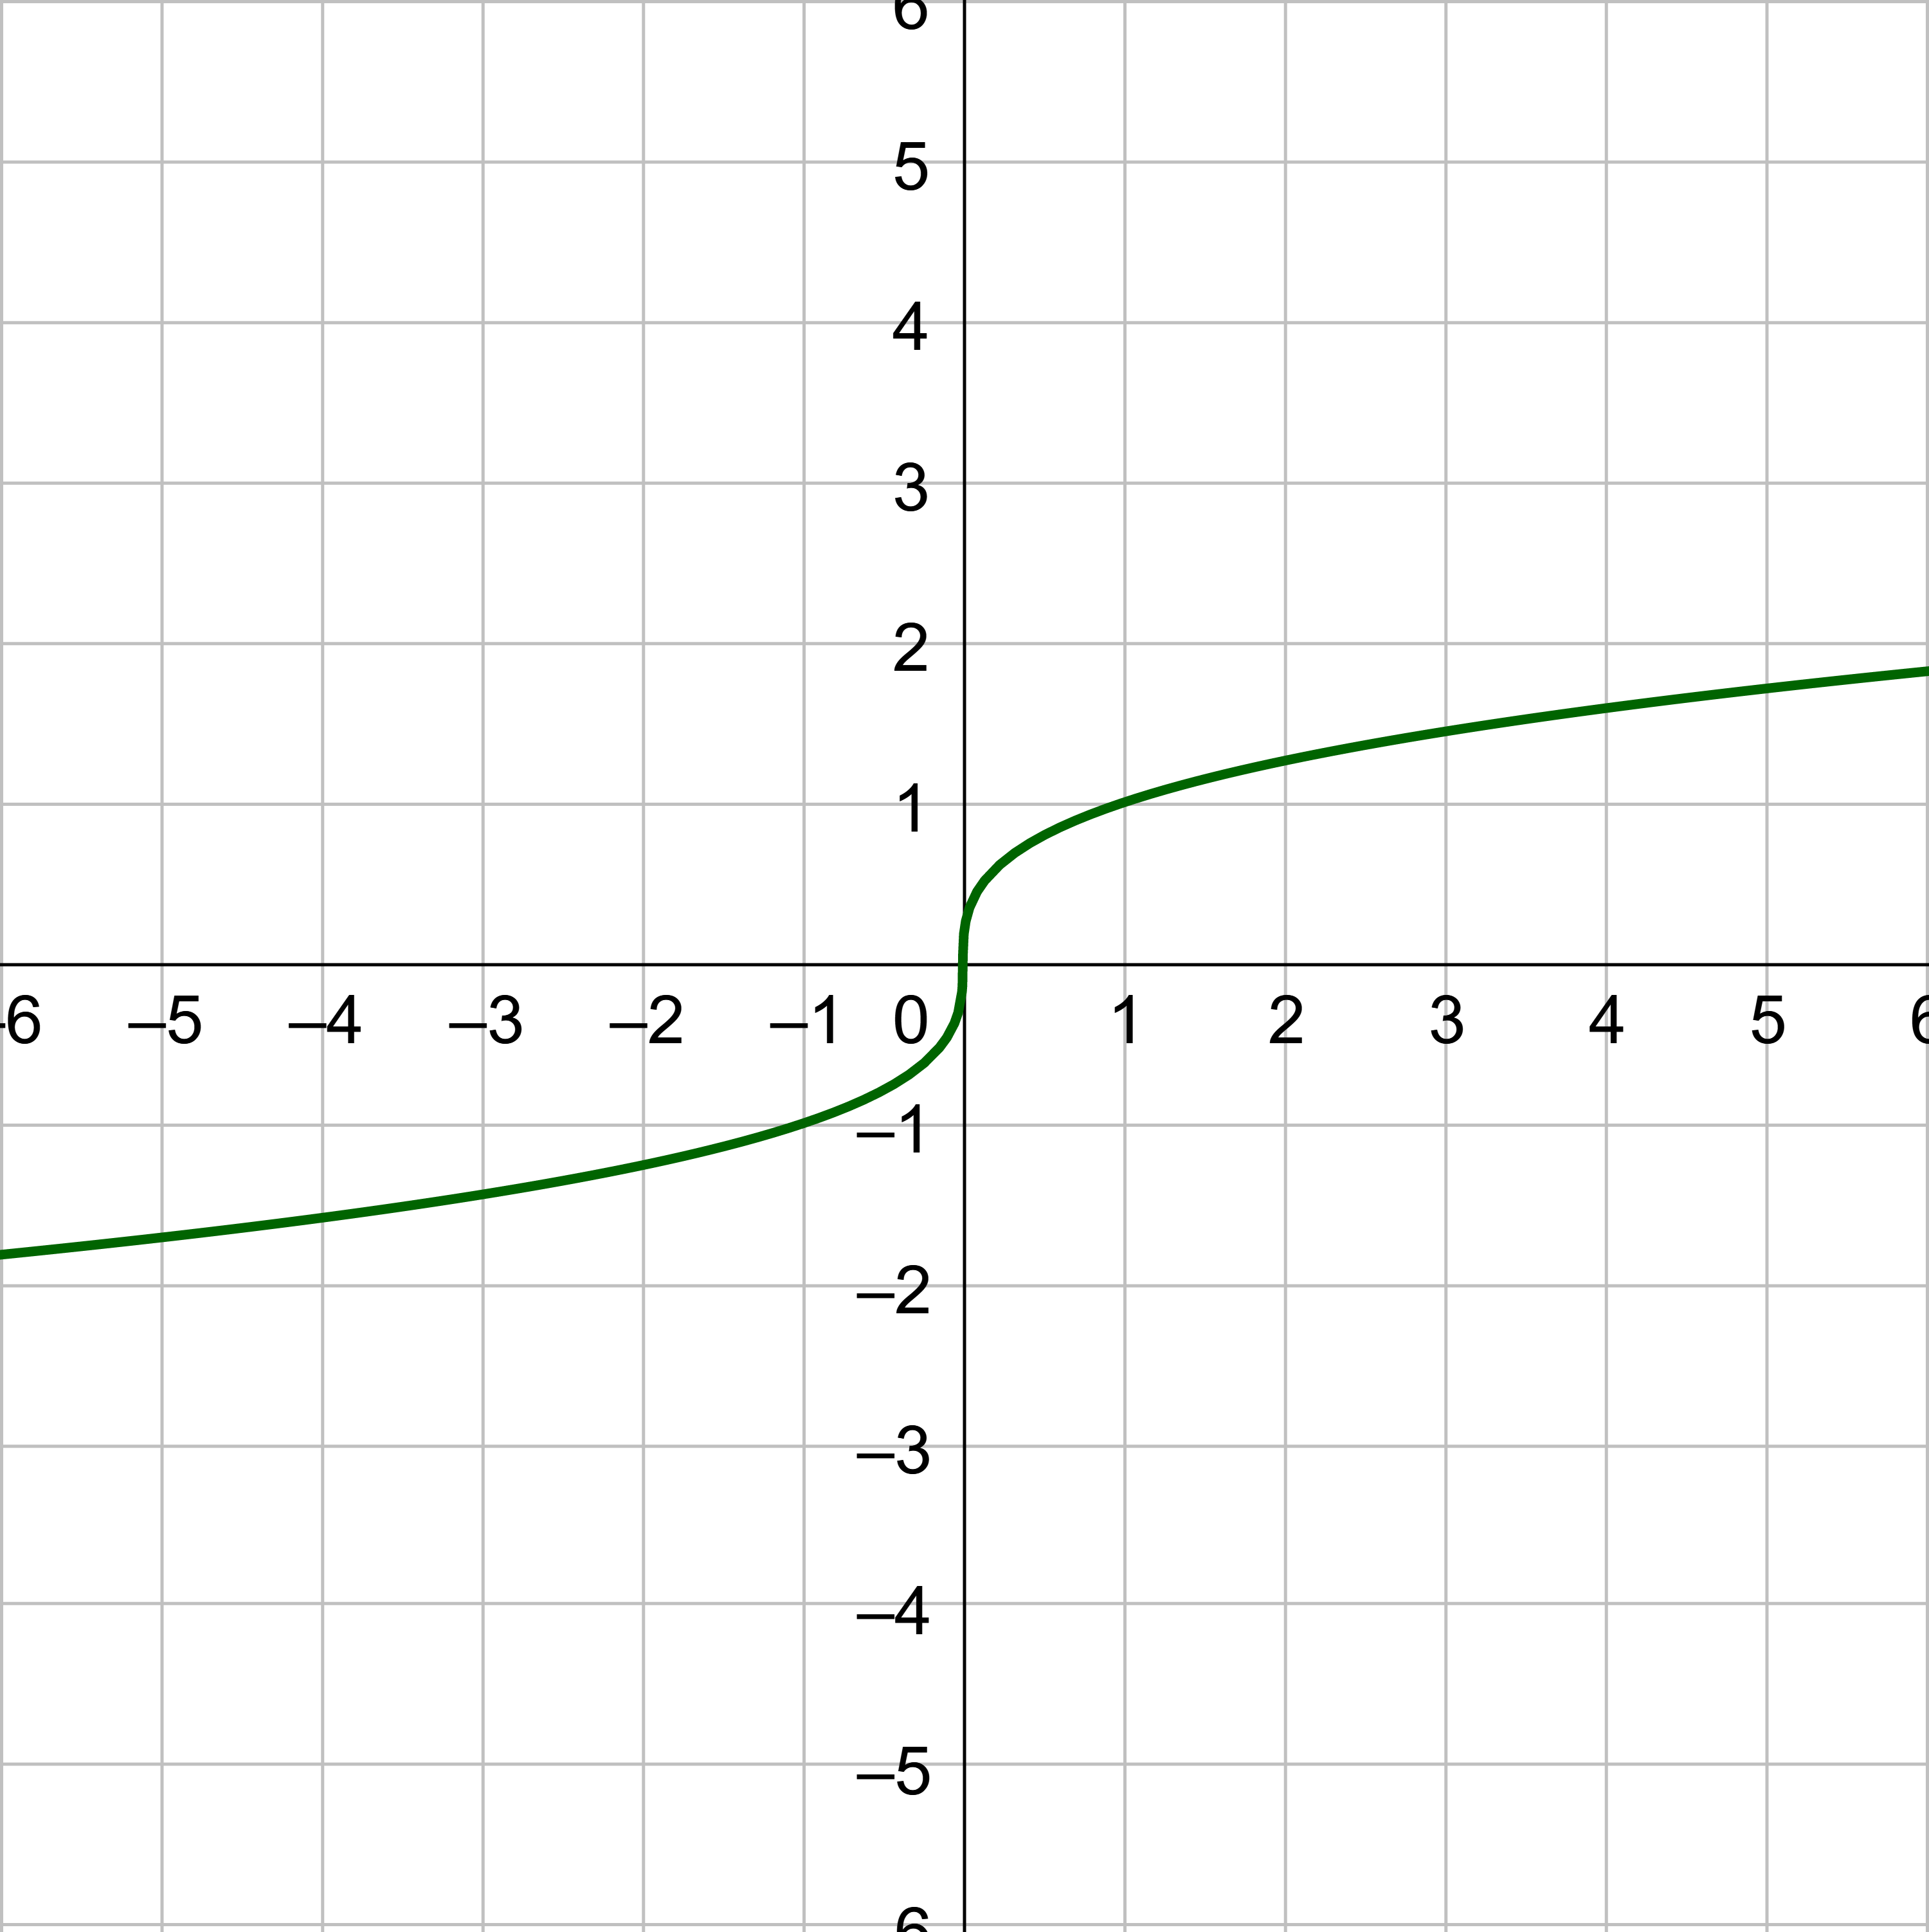
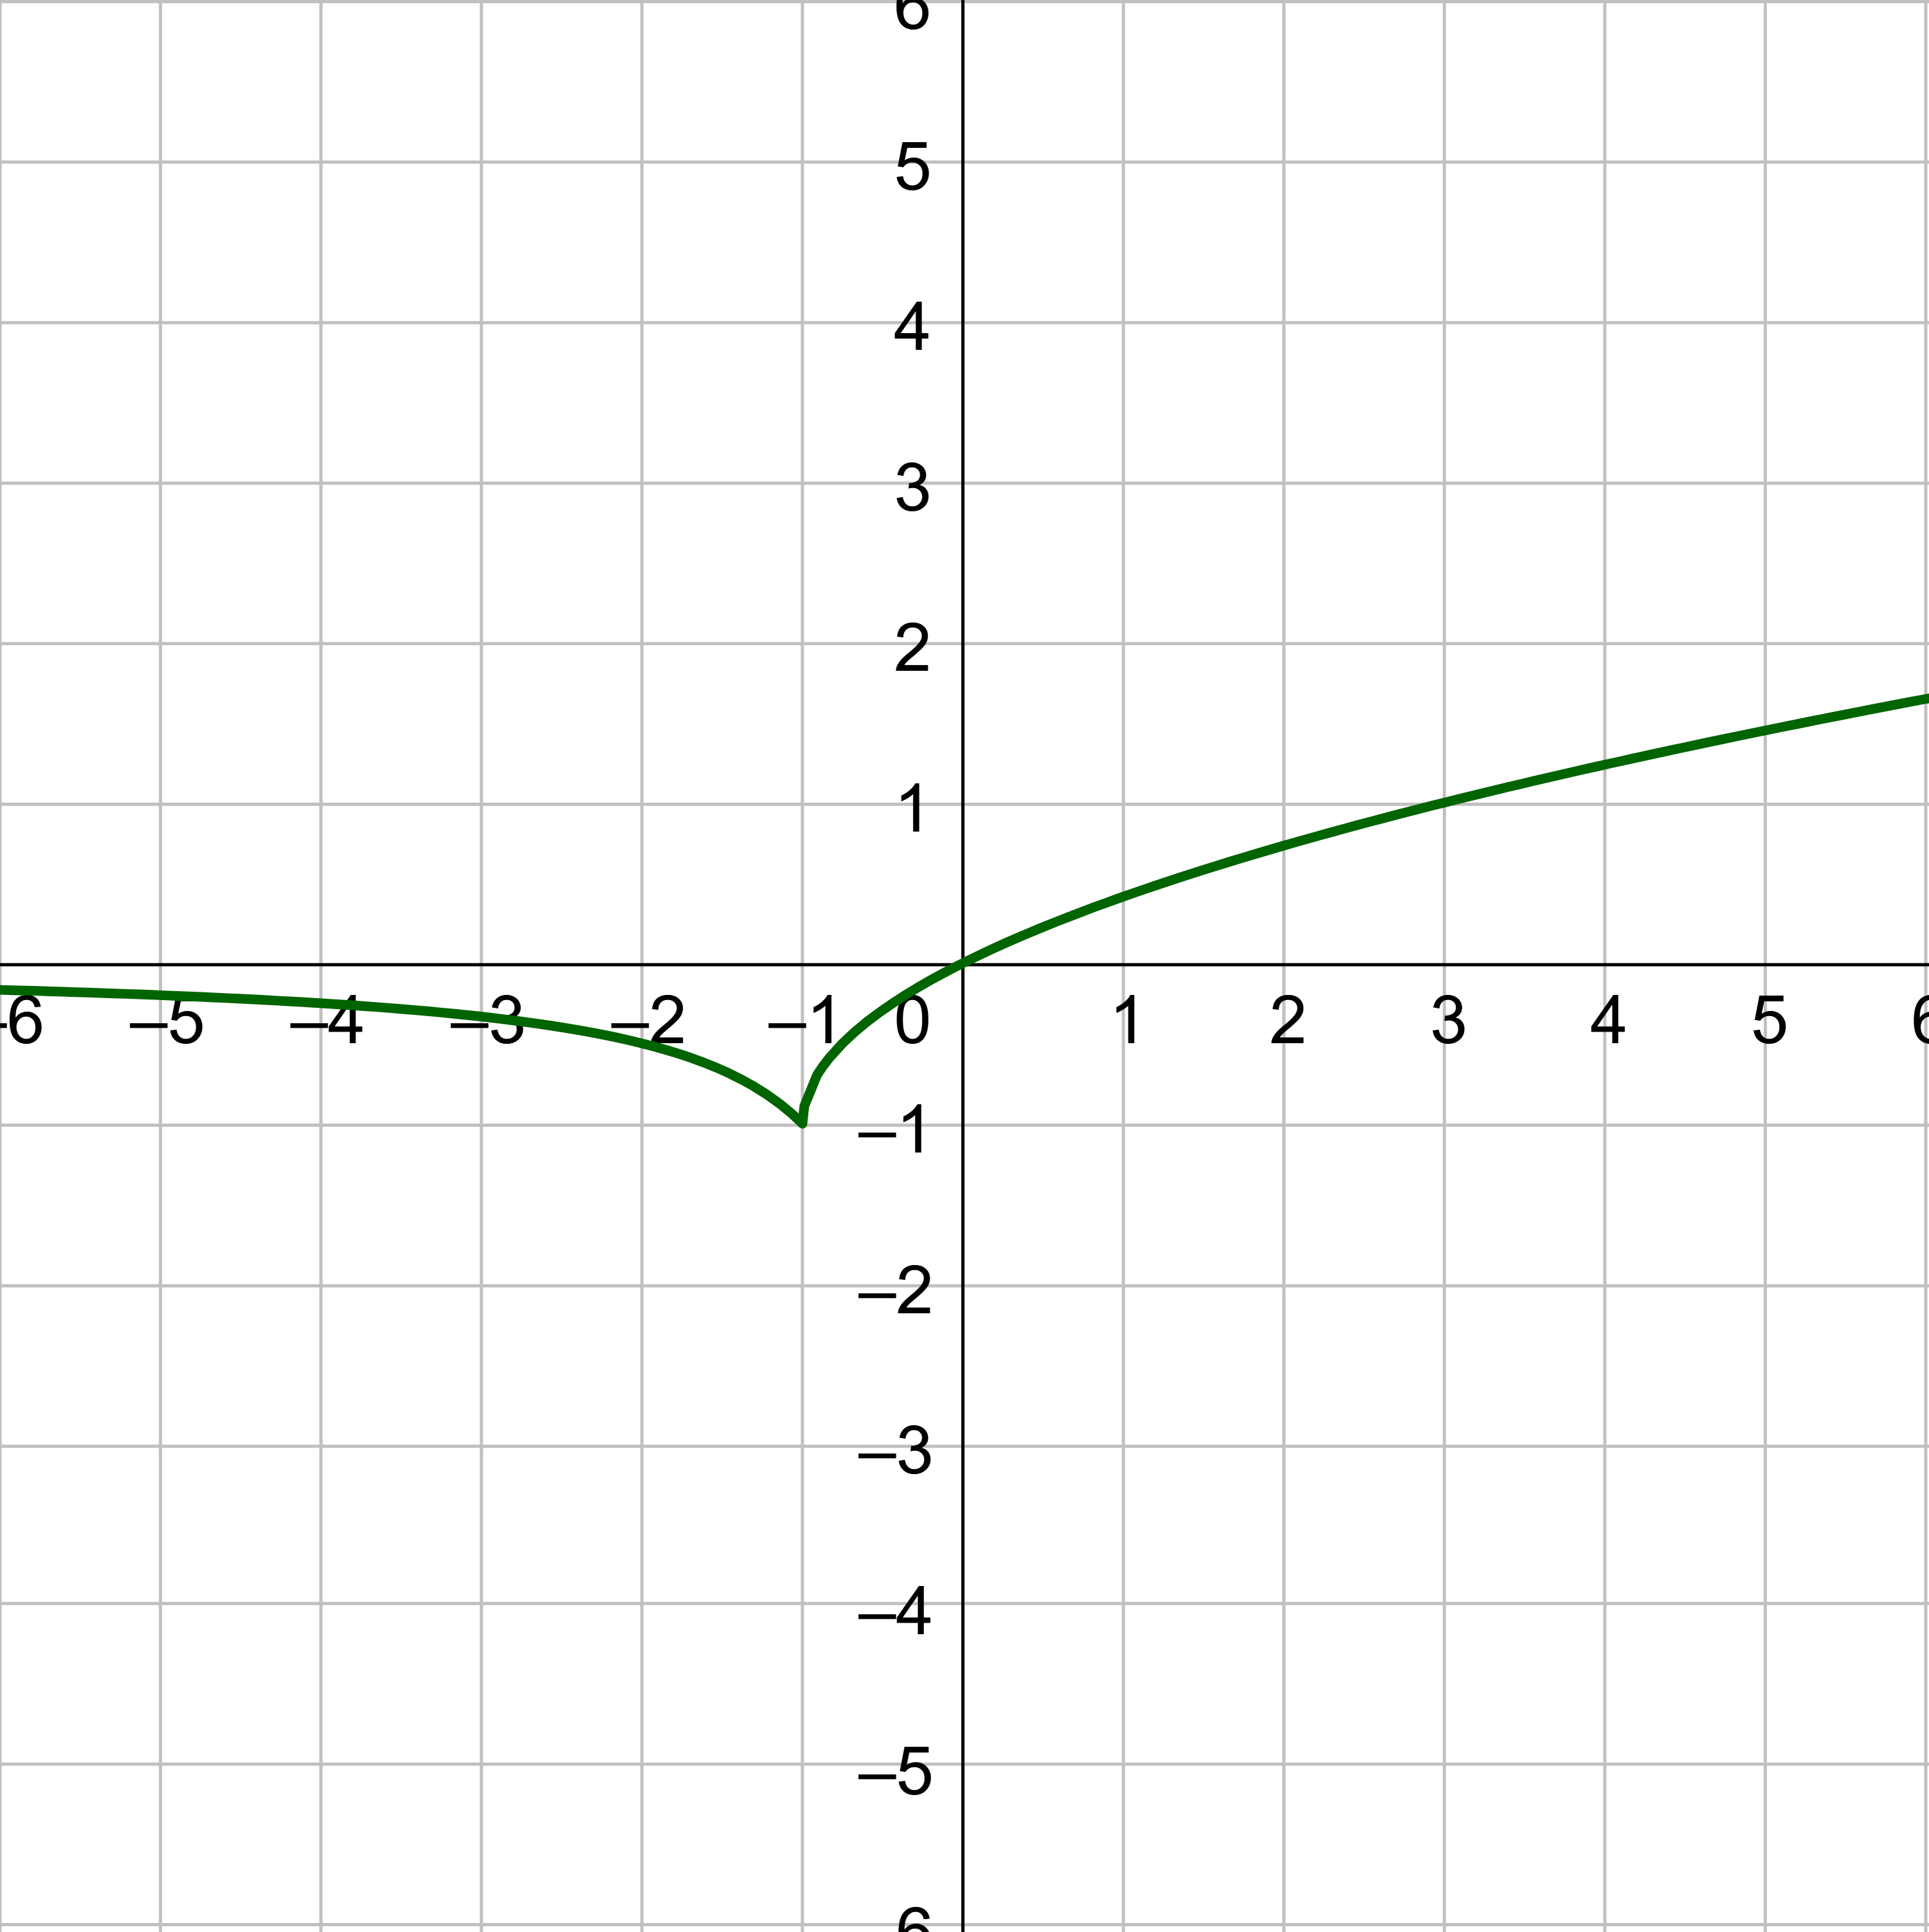
Cube root function \(f(x) = \sqrt[3]{x}\)
Cube root function \(f(x) = \sqrt[3]{x}\)
Domain is all real numbers.
Range is all real numbers.
Increasing over (−∞, ∞).
Symmetric about the origin.
Graph on a Graphing Calculator
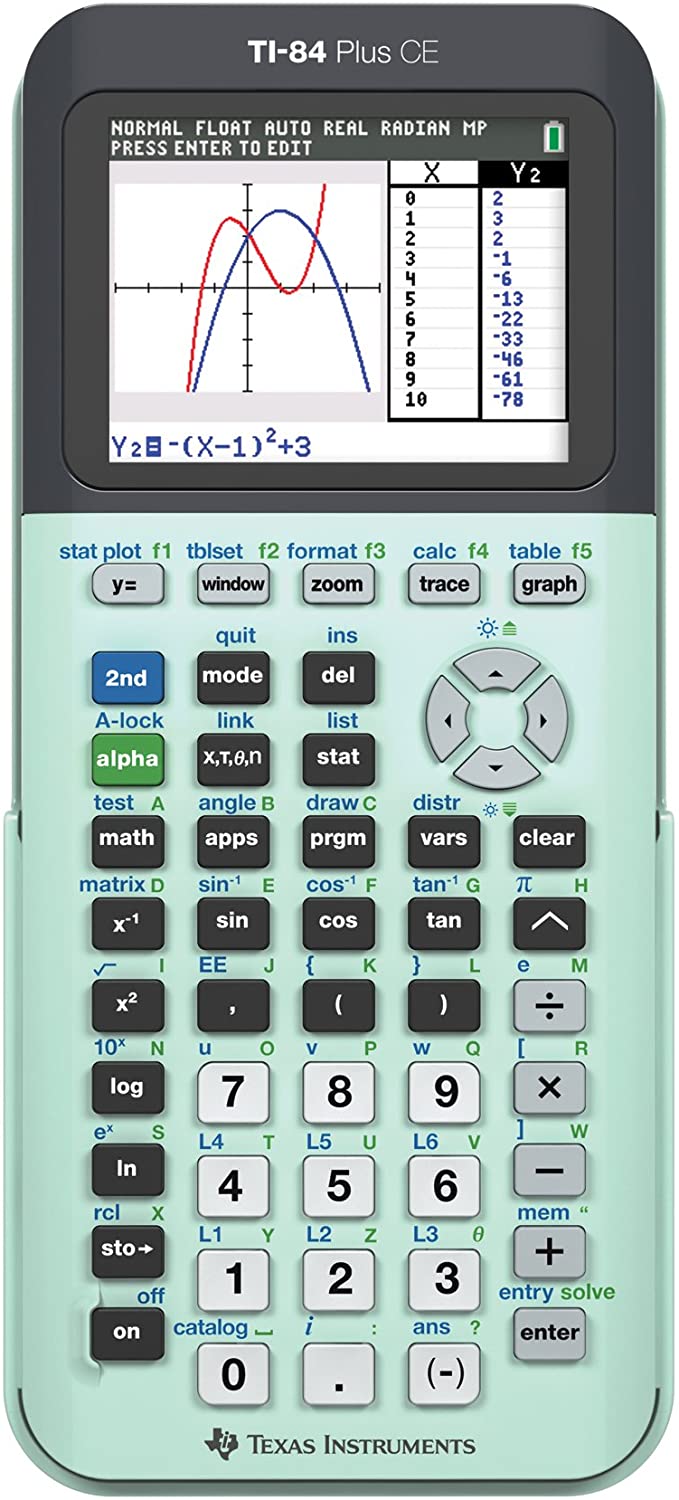
All graphing calculators are different but have similar commands. The following instructions are for the TI-84.
TI-83/84
TI-84
Press the o button
Enter the equation
Press the s button
If the axes are not centered, press q, then choose zStandard.
If the graph is not visible, press q, then choose ZoomFit
The window range can also be set by pressing p
To copy the graph to your paper, press y0 and plot the points on your paper
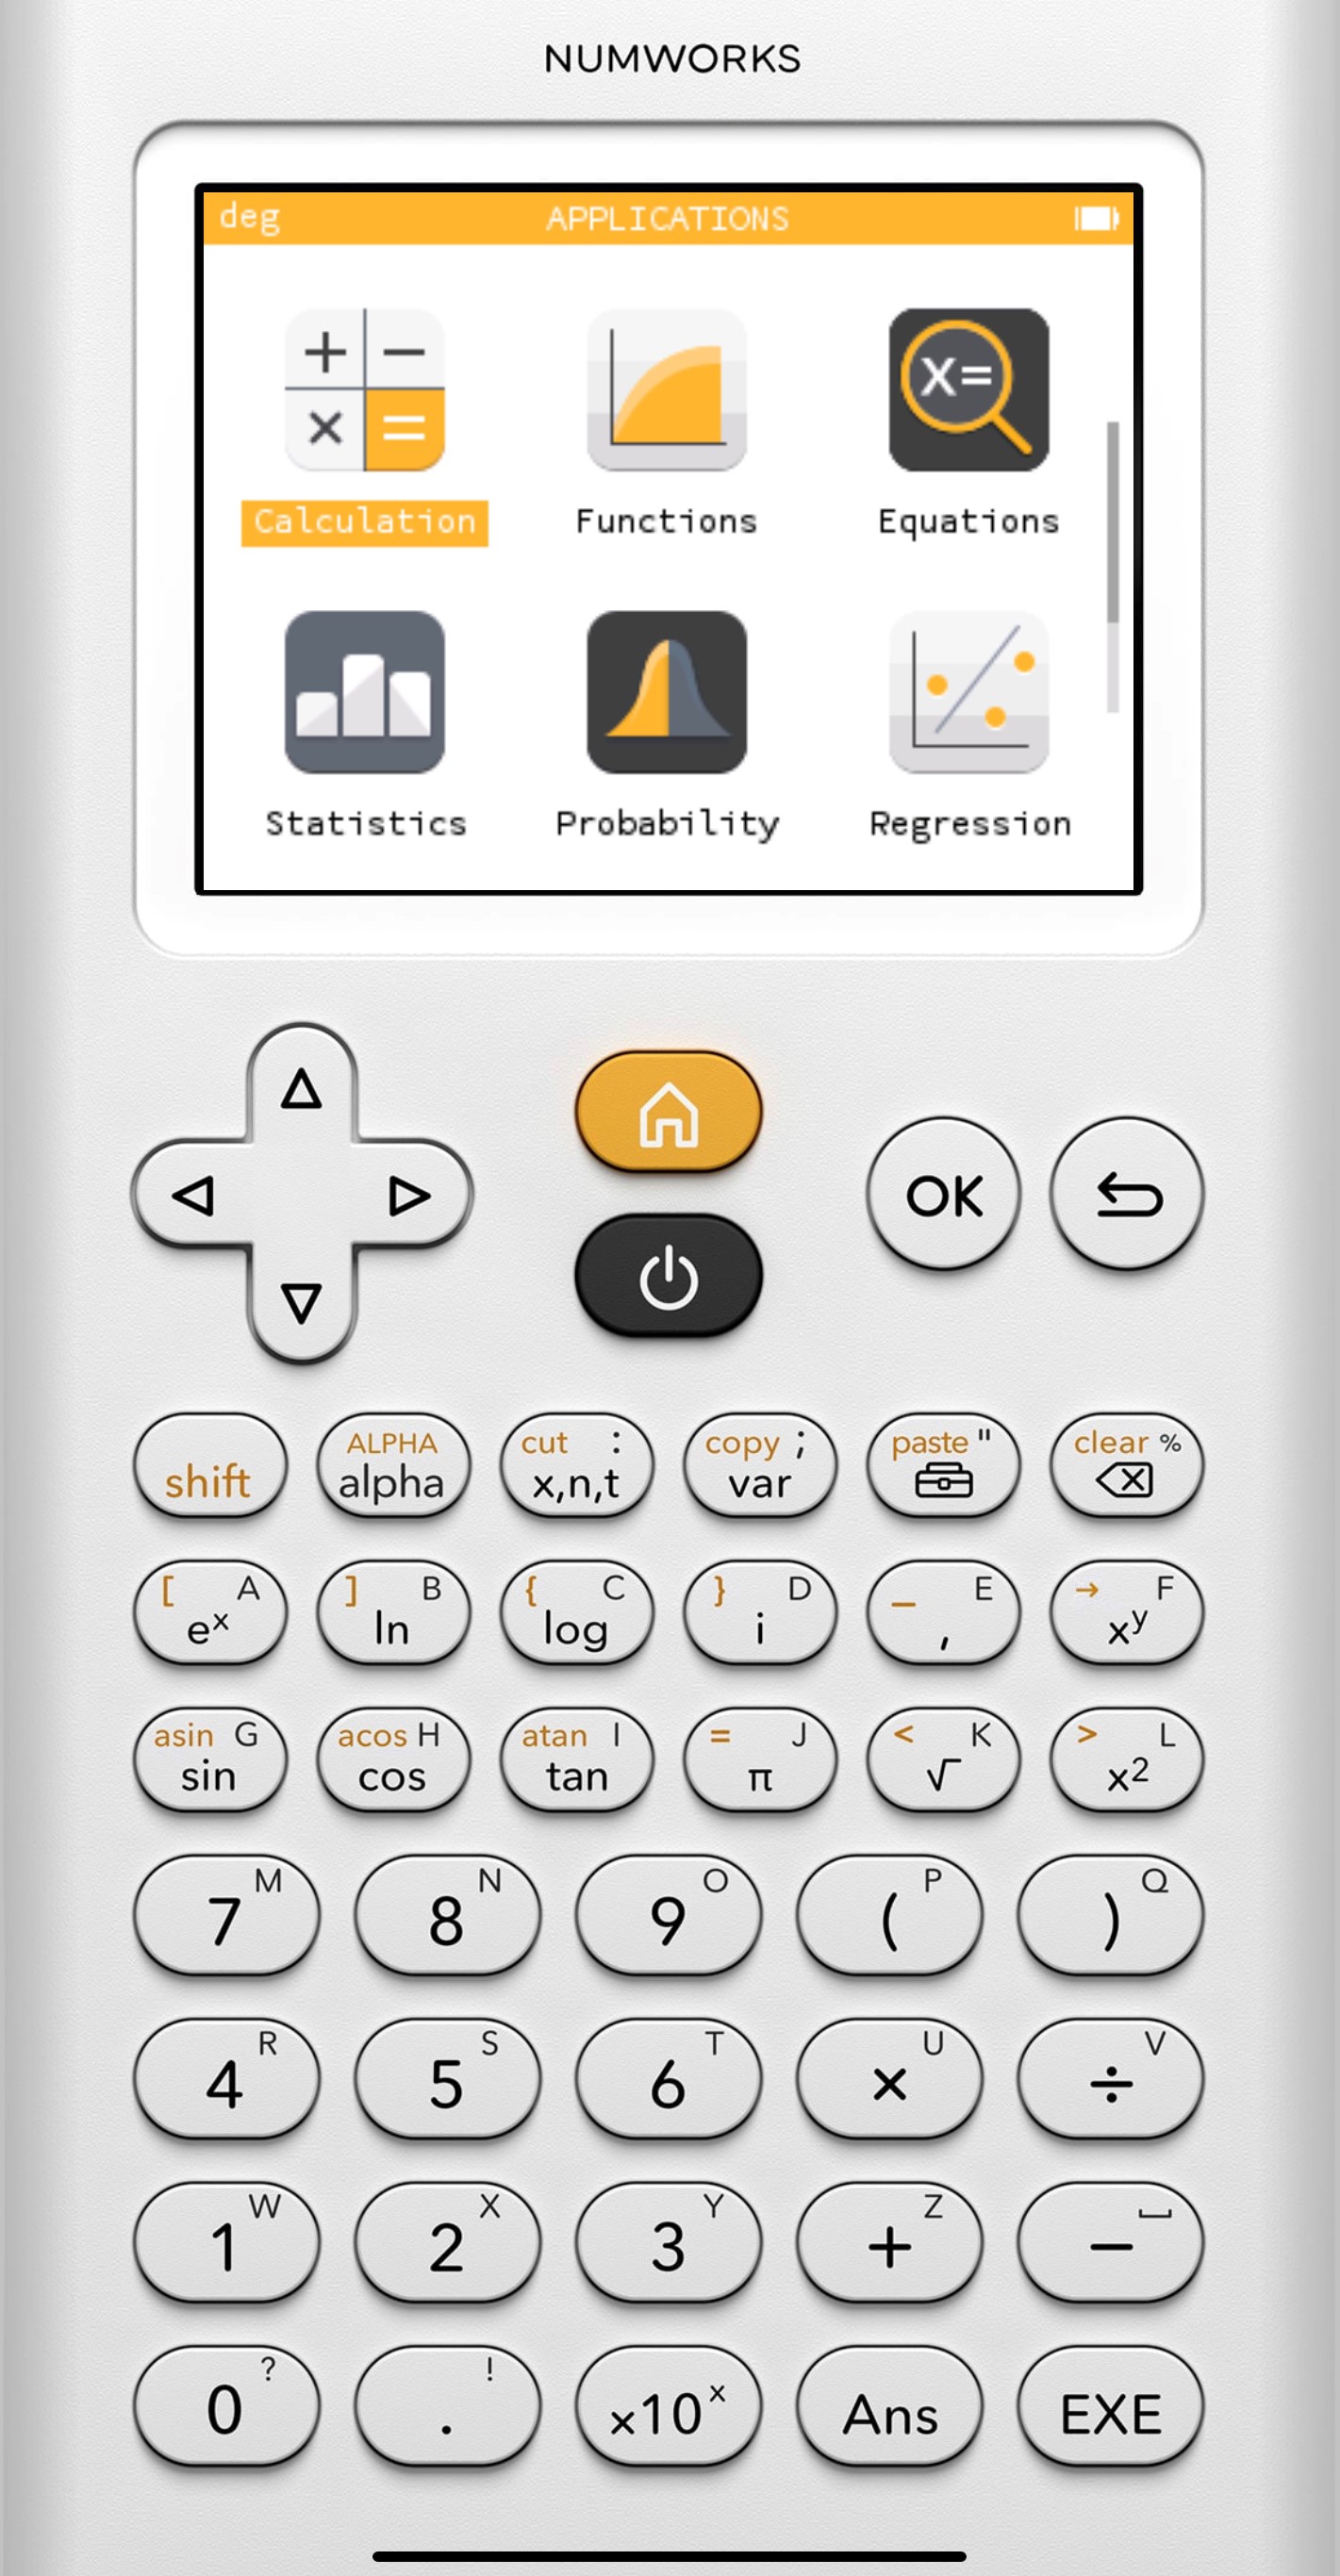
NumWorks
NumWorks
Press the home button and select Grapher
Select the Expressions tab at the top
Add or edit the function
Select the Graph tab at the top
The zoom options are at the top
Auto: should show most of the graph
Axes: lets you enter the values to set the visible window
Navigate: lets you use the arrows to move the graph around
Zoom with the + and - keys.
To copy the graph to your paper, select the Table tab at the top and plot the points on your paper
Identify the Parent Function
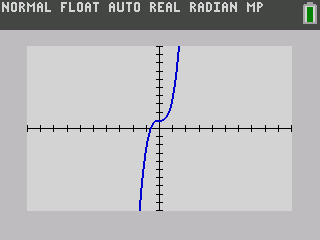
Identify the parent function of f(x) = 3x3 + 1. Then graph it on a graphing calculator.
Solution
Because the function f(x) = 3x3 + 1 has x3, its parent function is cubic.
f(x) = 3x3 + 1 on a TI-84
Identify the Parent Function
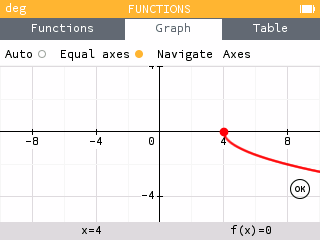
Identify the parent function of \(f(x) = -\sqrt{x - 4}\). Then graph it on a graphing calculator.
Solution
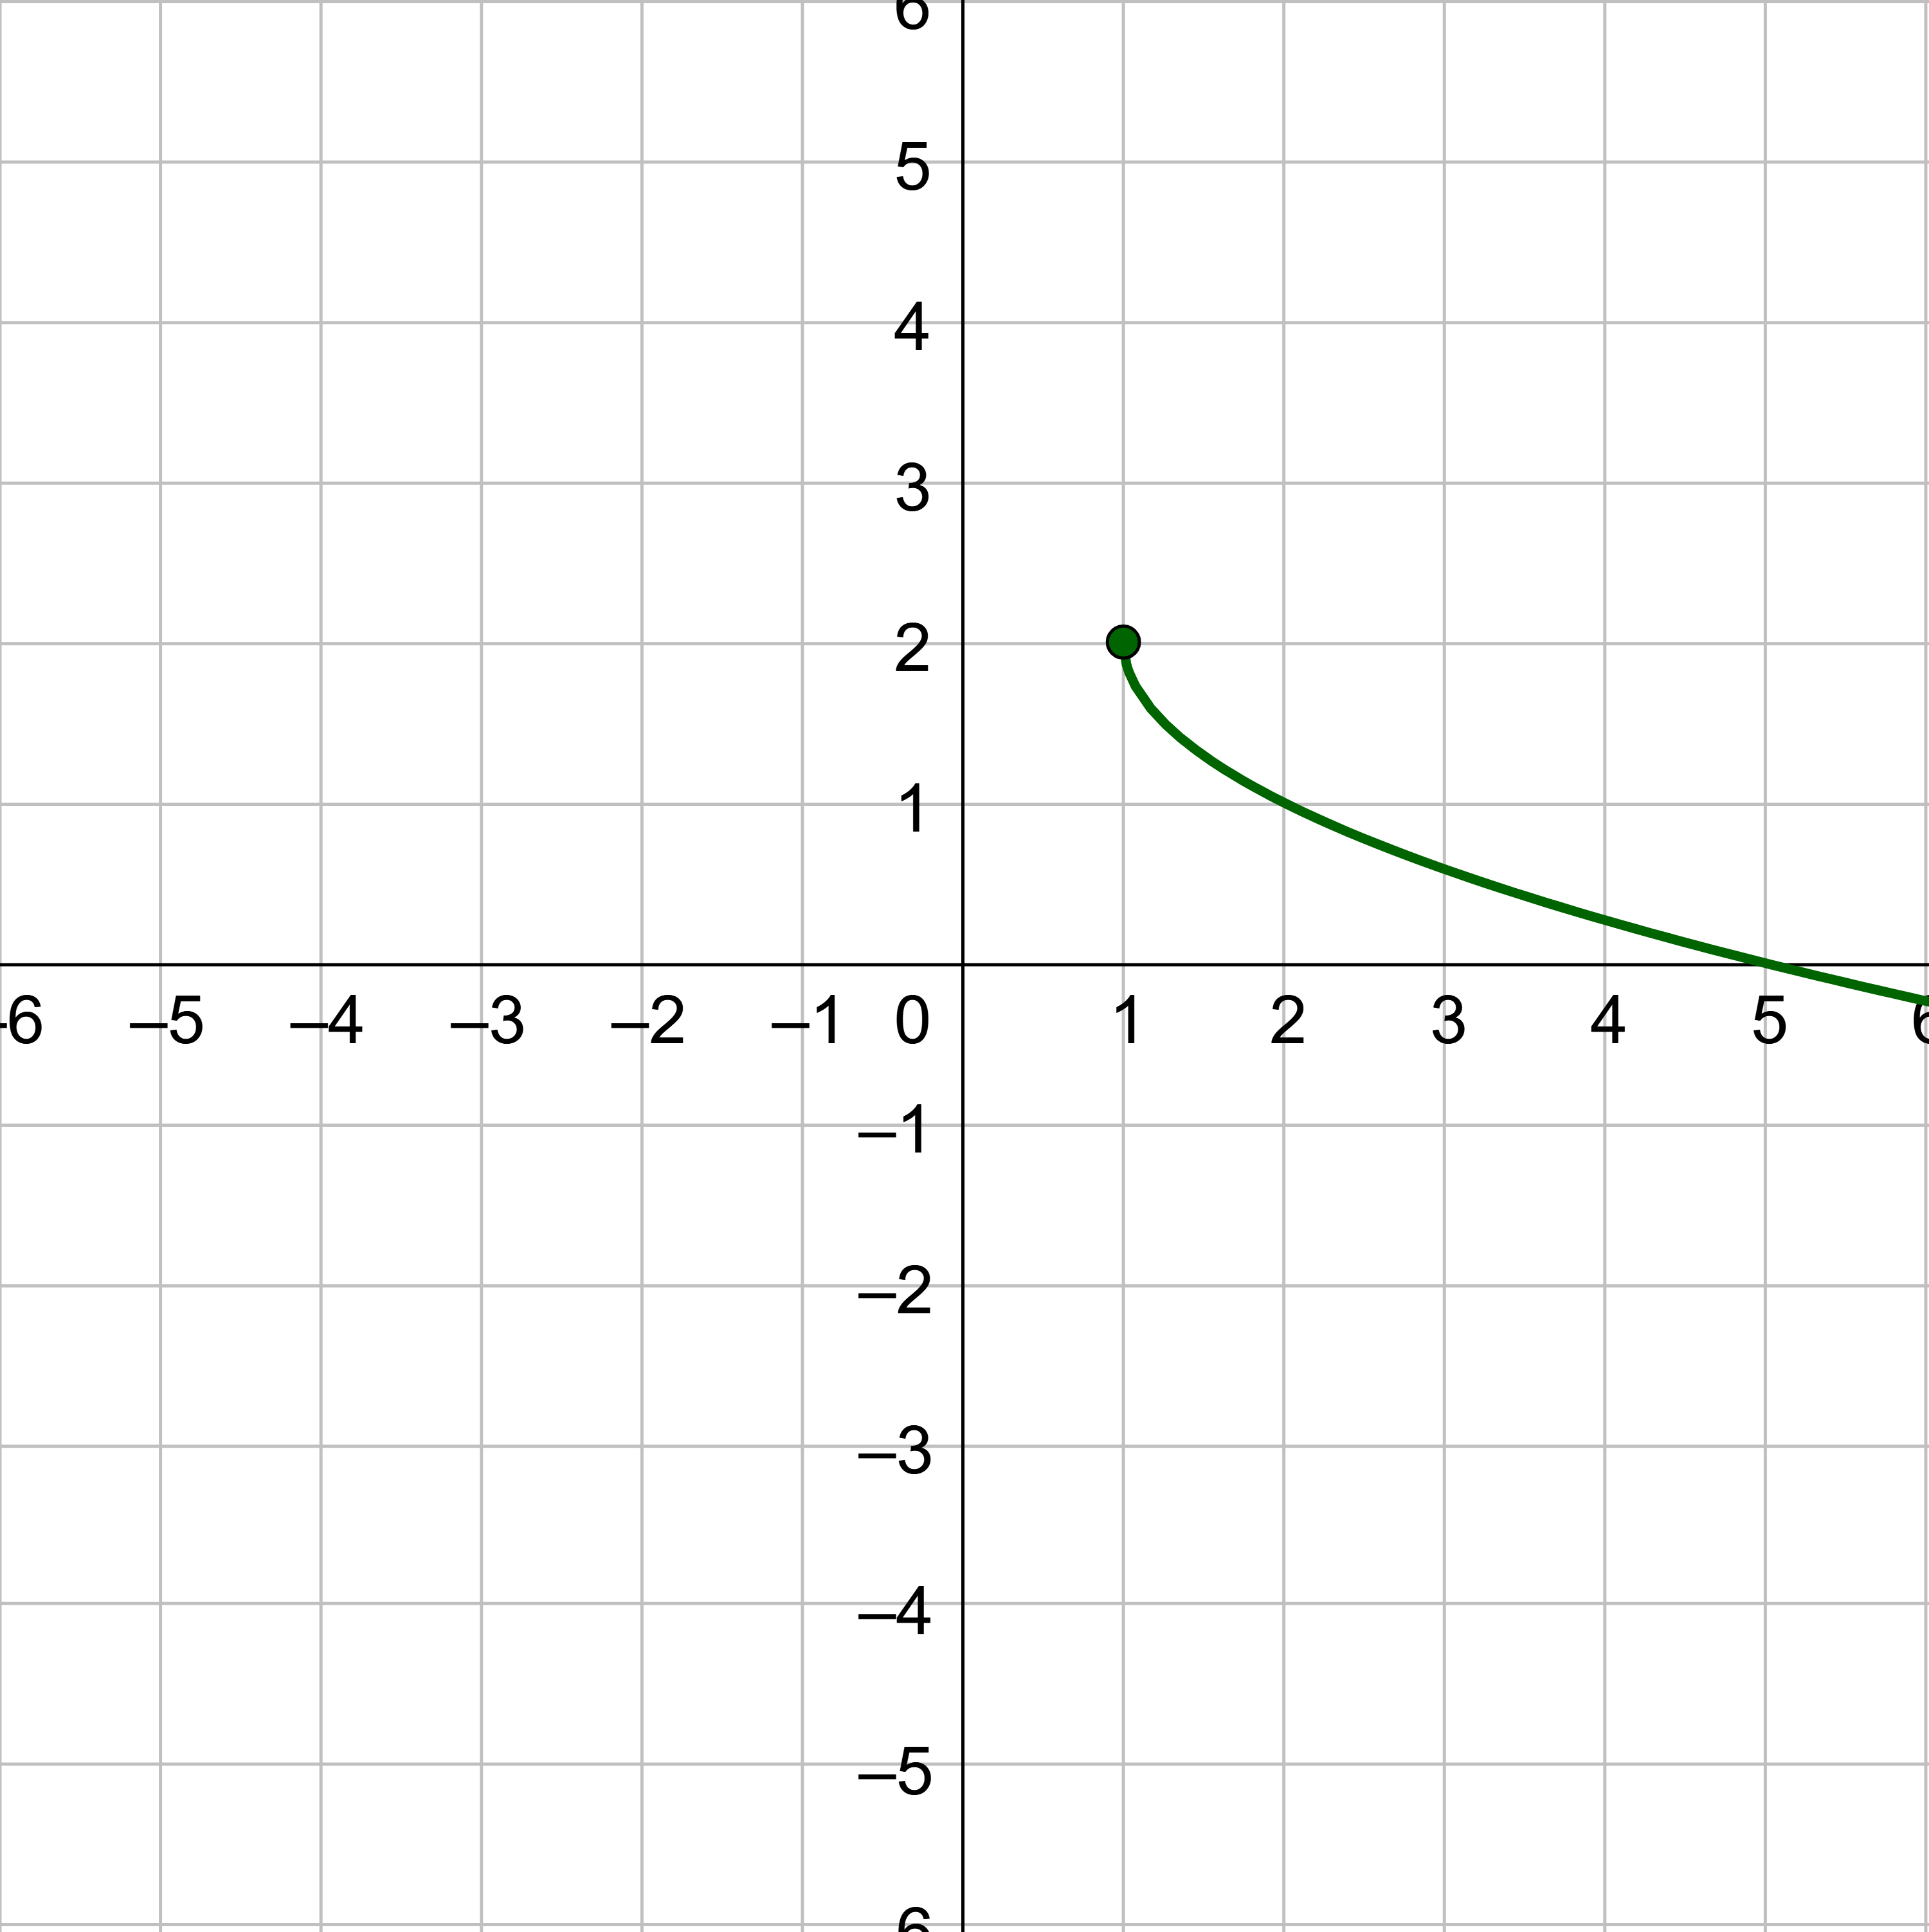
Because the function \(f(x) = -\sqrt{x - 4}\) has \(\sqrt{x}\), its parent function is square root.
\(f(x) = -\sqrt{x - 4}\) + 1 on a NumWorks calculator
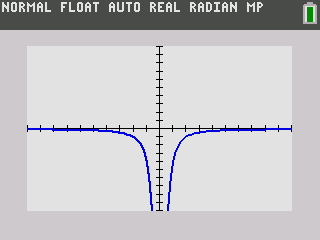
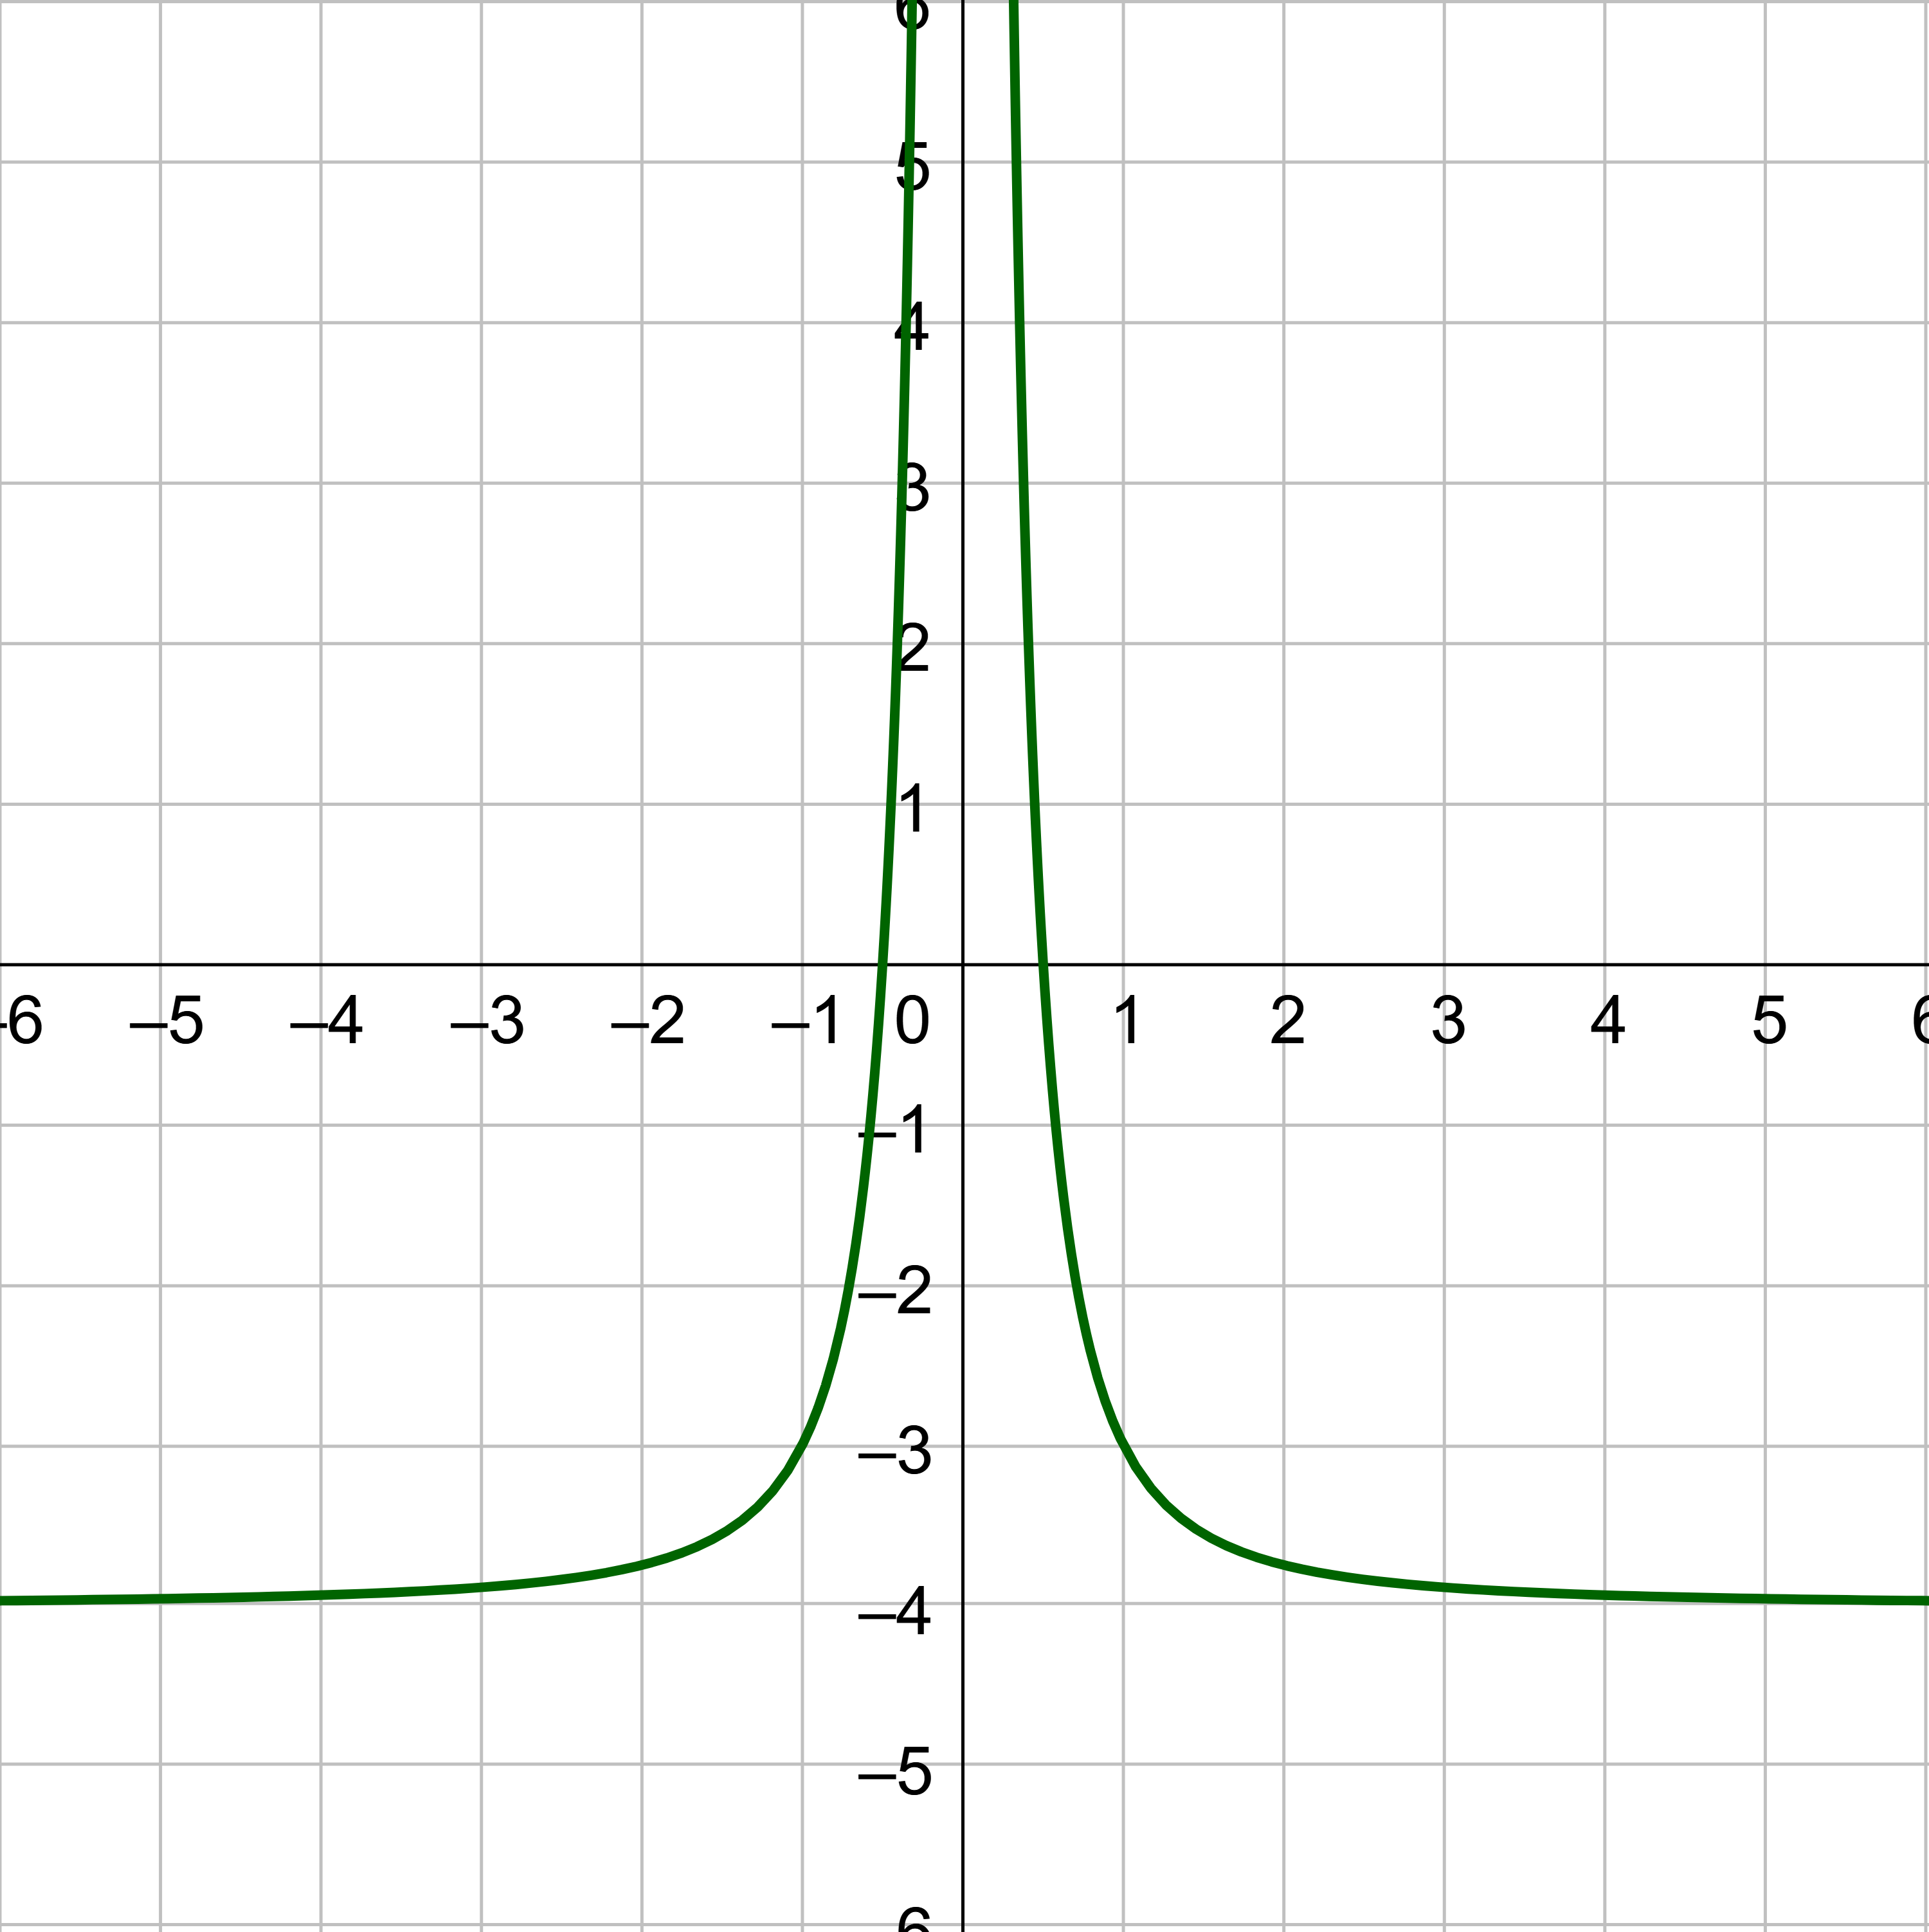
Identify the parent function of \(f(x) = -\frac{4}{x^2}\). Then graph it on a graphing calculator.
Answer
Reciprocal squared;
Graph Piecewise Functions
Piecewise functions were discussed and evaluated in lesson 01-04. Remember that they are made up of several different equations each with its own domain interval. They were evaluated by first deciding which domain the value of x was in and then evaluating that equation. Graphing piecewise functions is similar. Start by marking off each section of the domain on the x-axis. Then graph each equation only in its domain interval.
Graph a Piecewise Function
Mark the boundaries on the x-axis of the intervals for each piece of the domain.
For each piece of the domain, graph on the corresponding equation. Do not graph two functions over one interval because it would violate the criteria of a function.
Graph a Piecewise Function
Sketch a graph of the function.
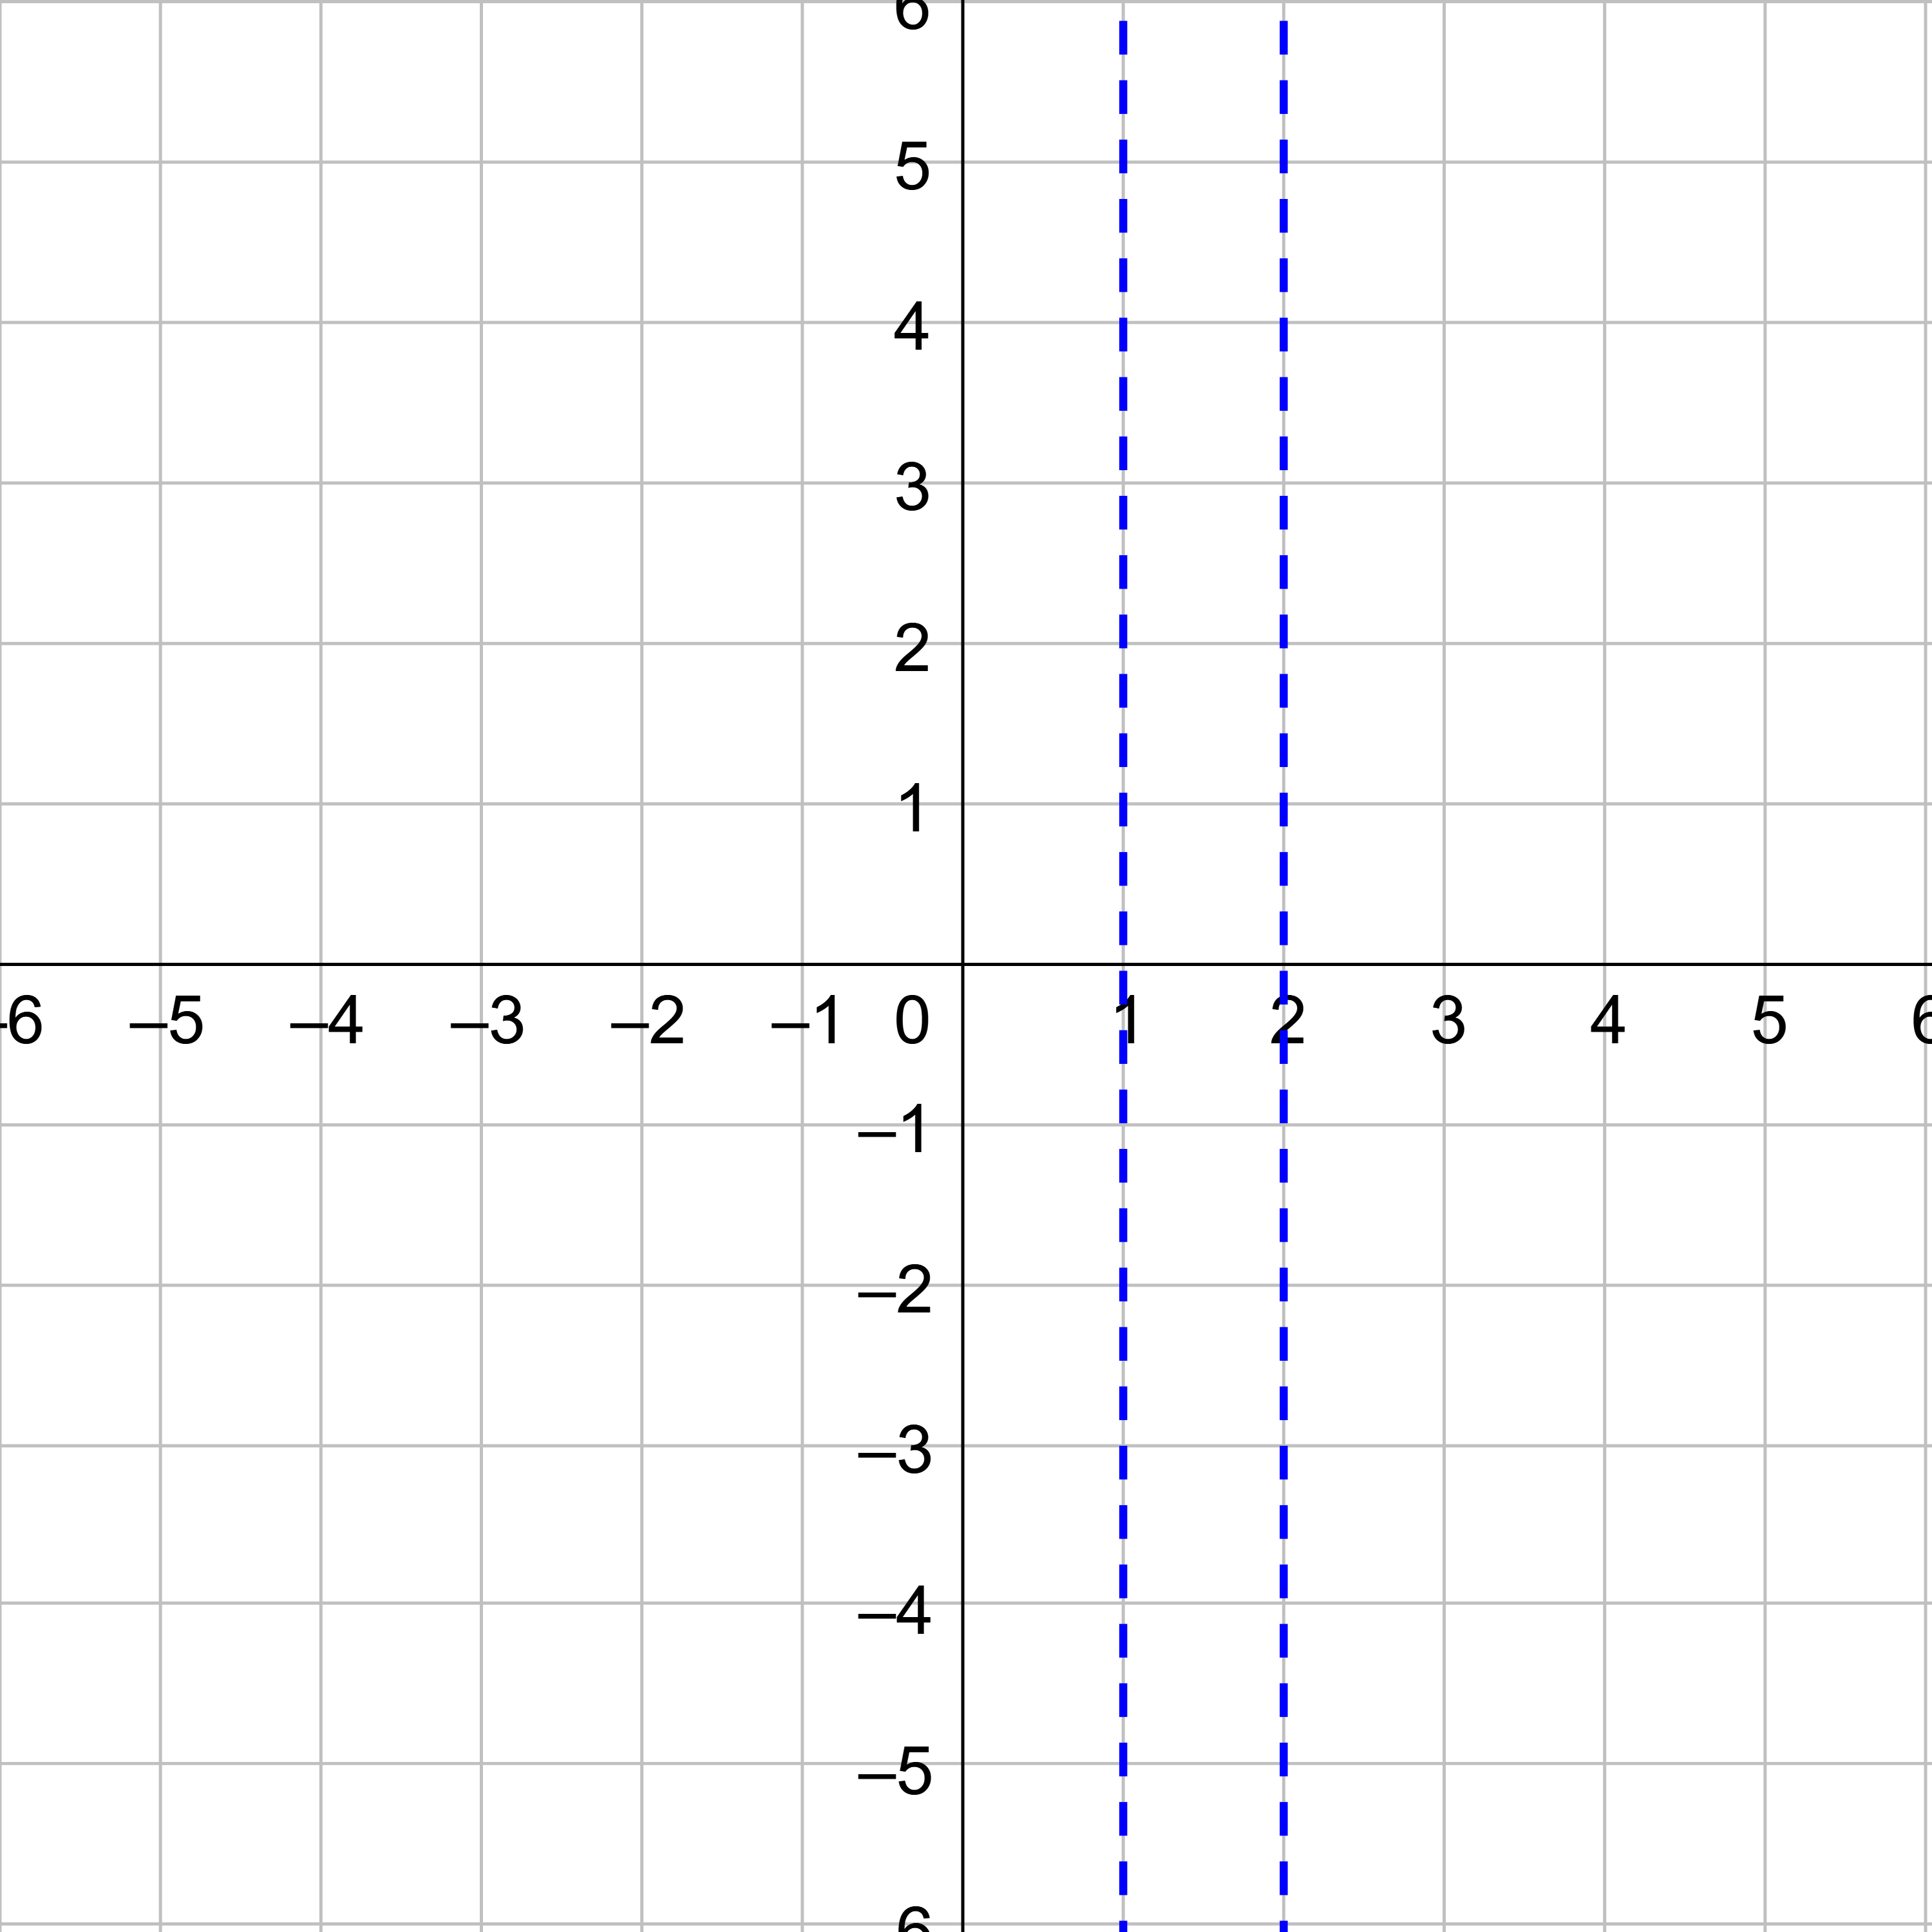
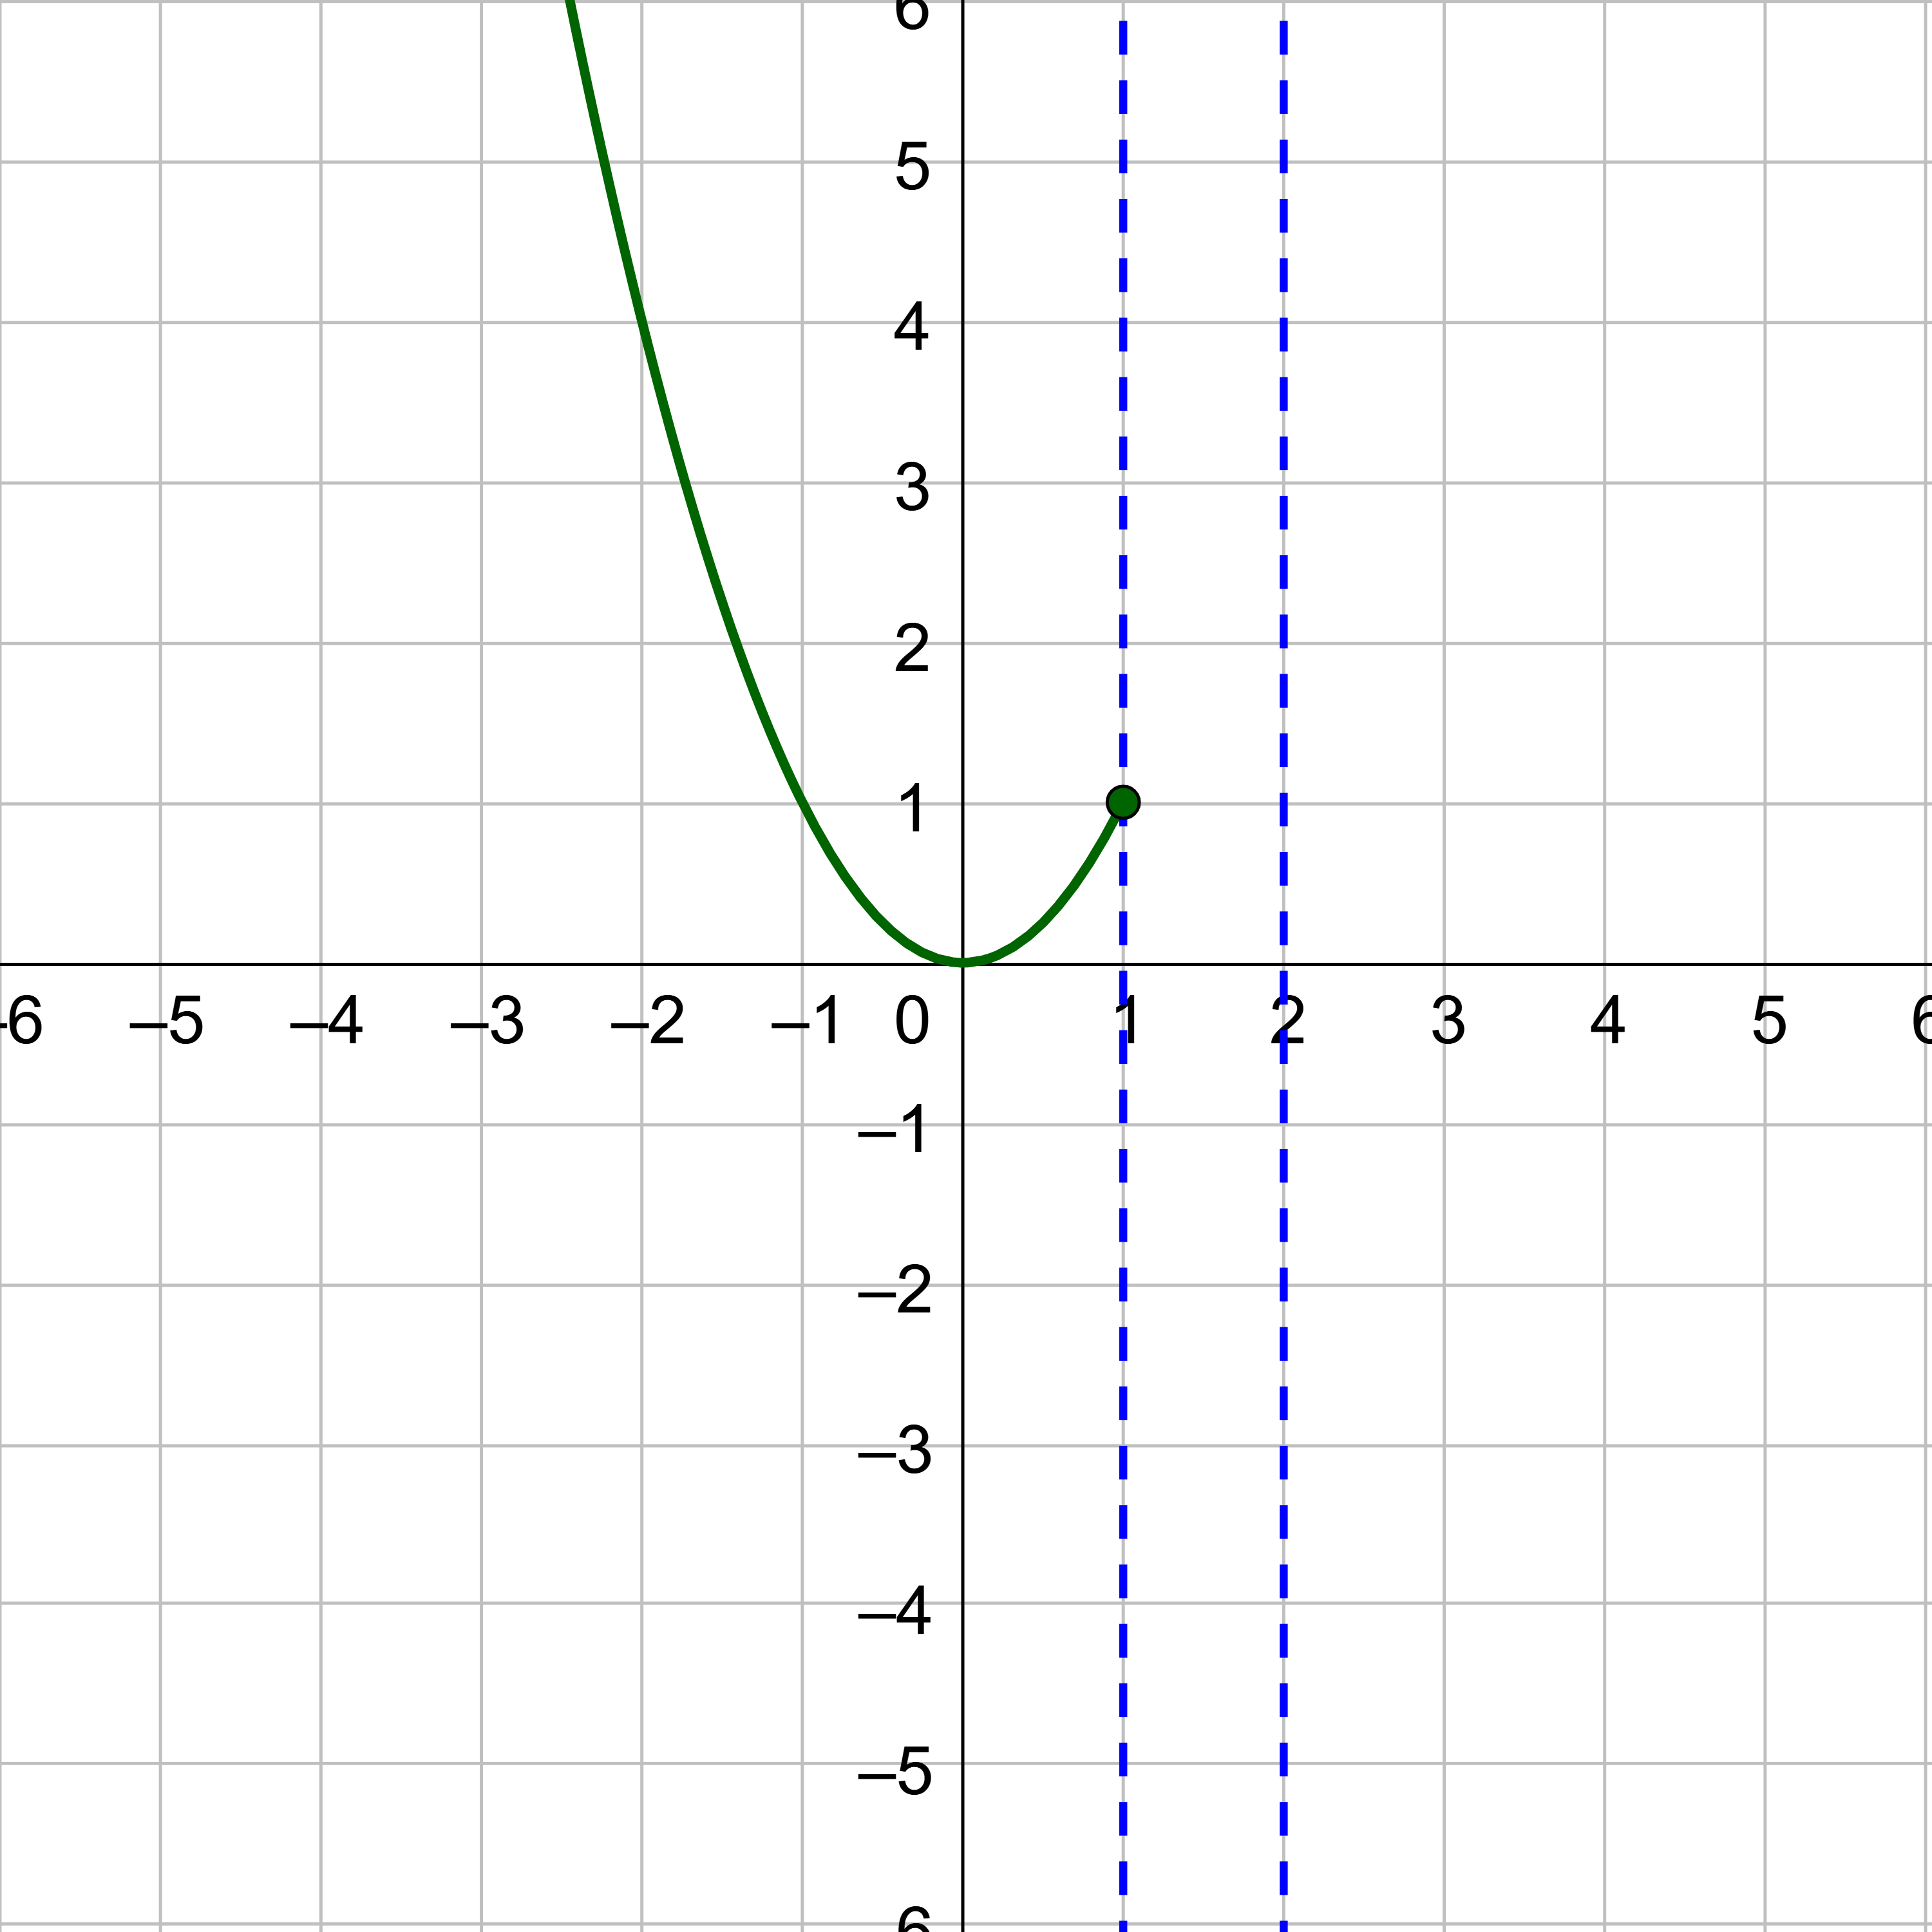
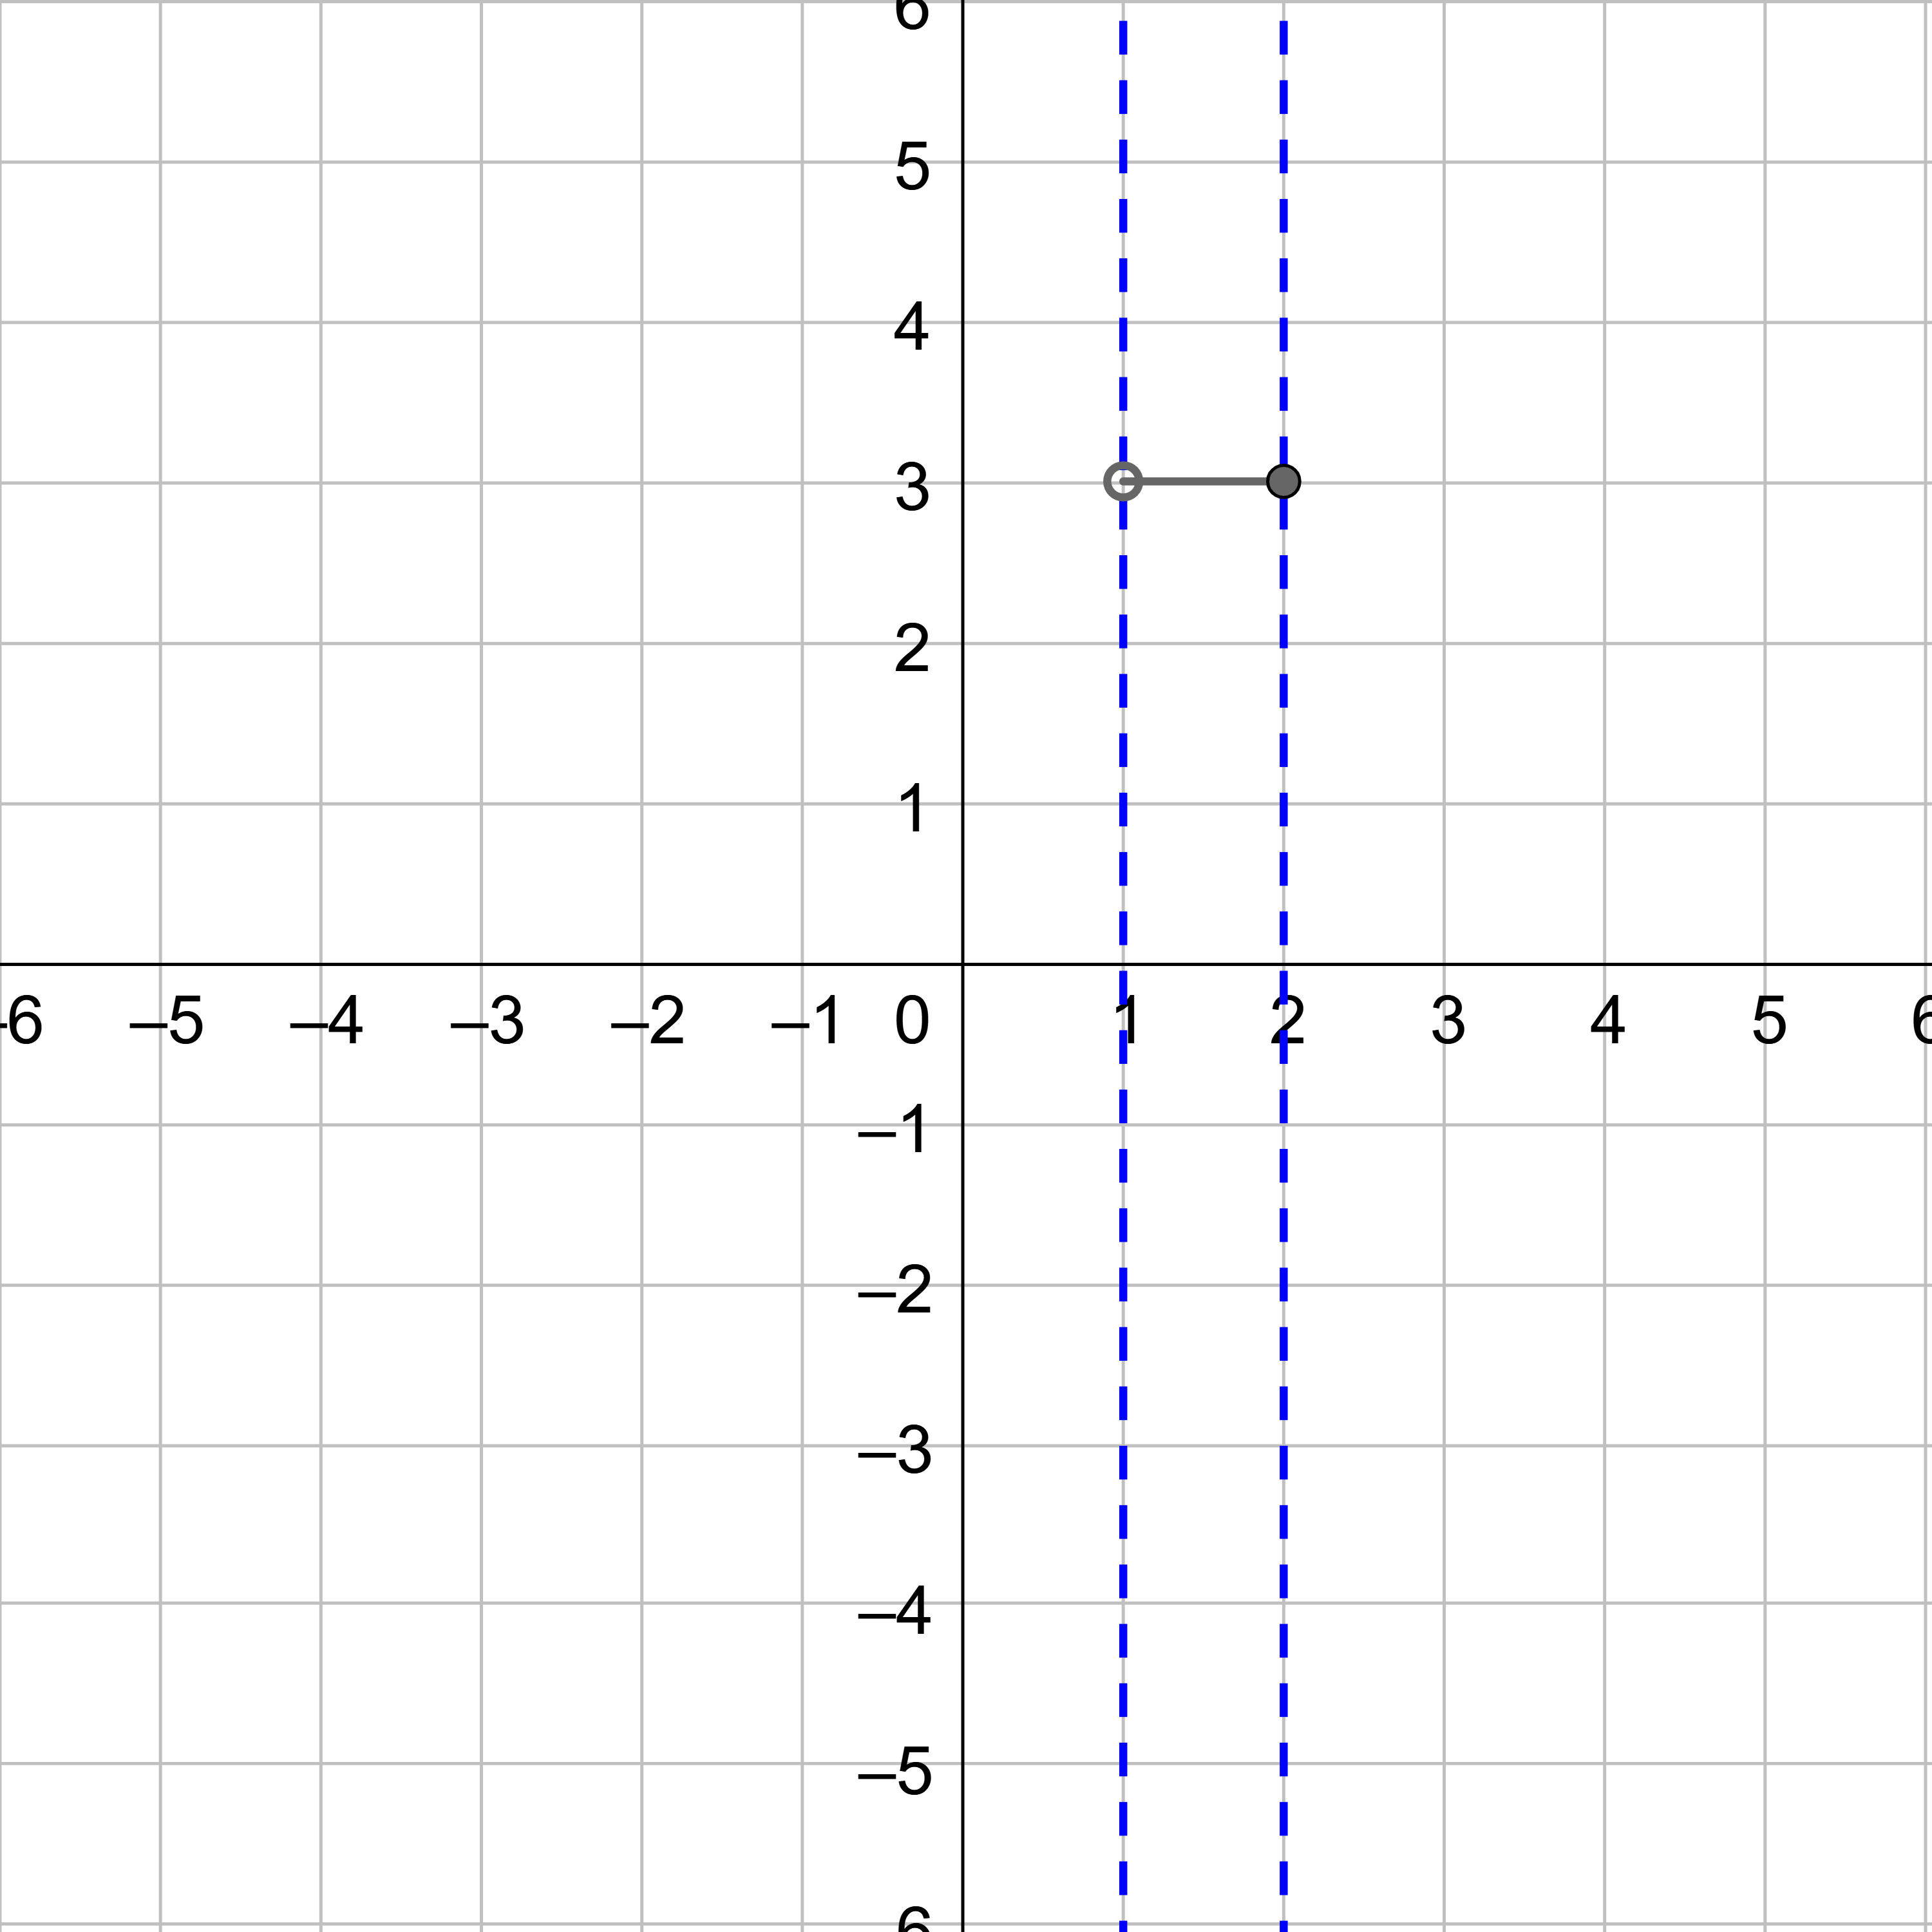
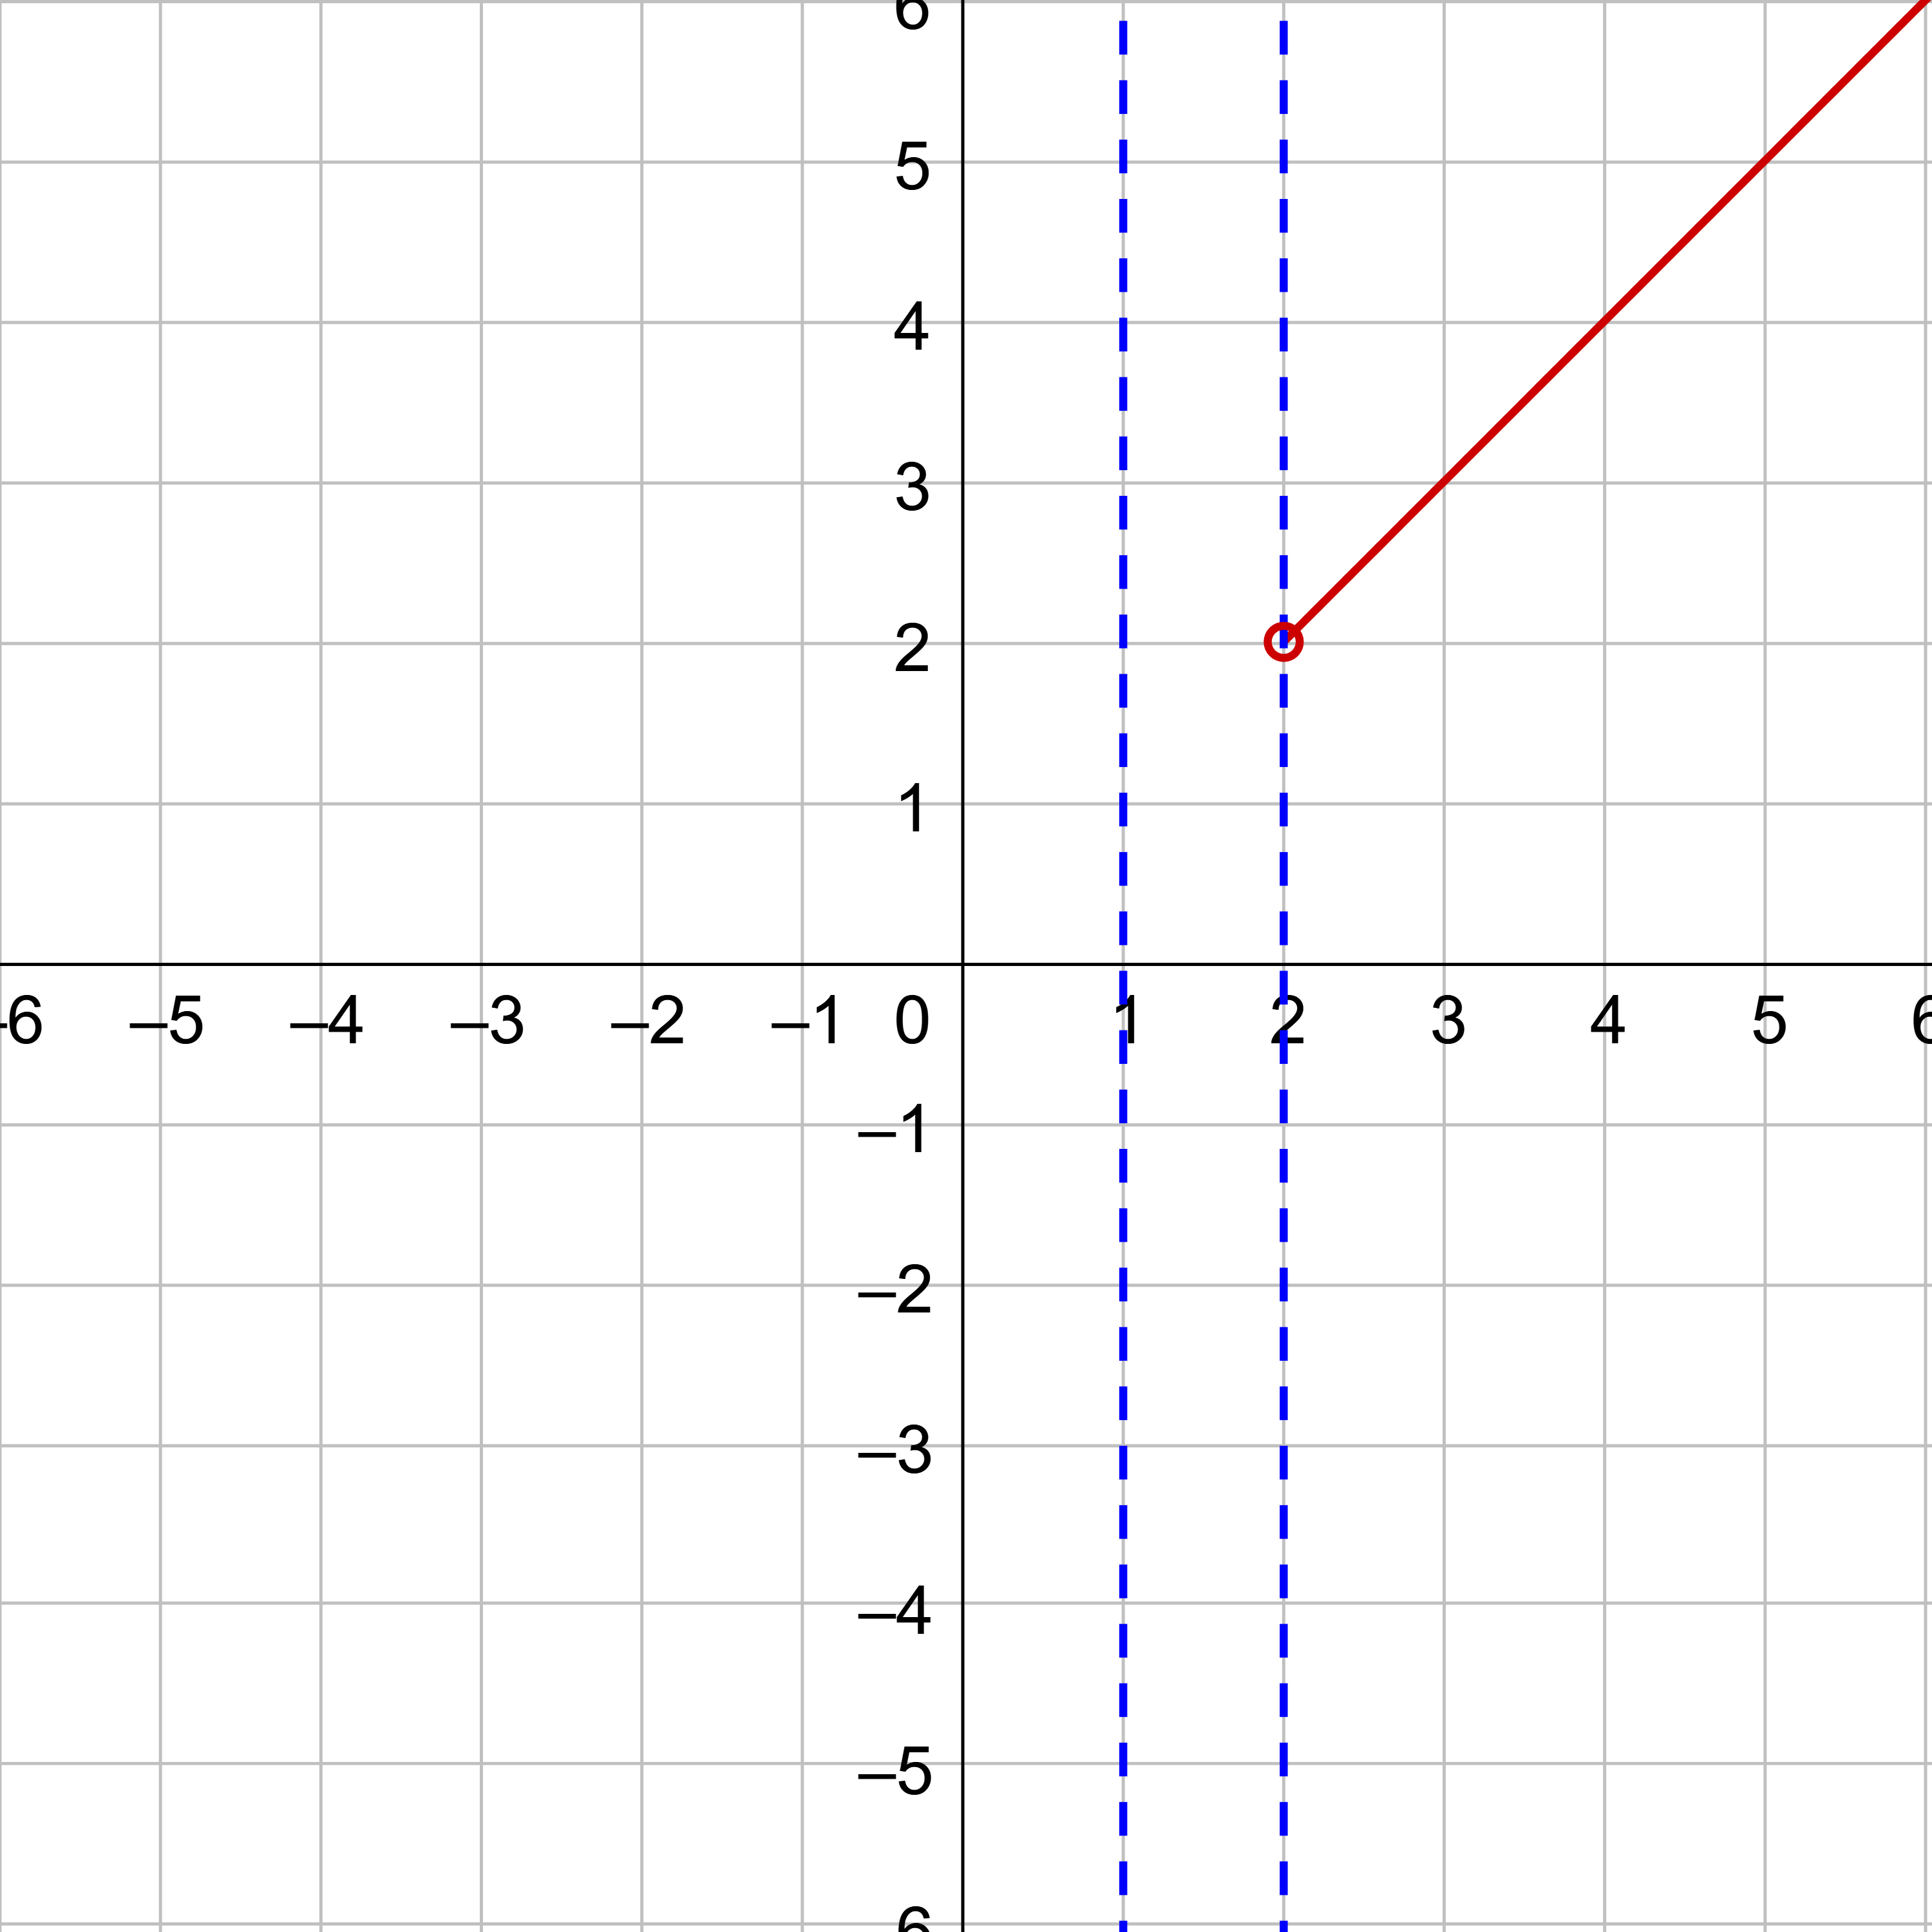
$$ f(x) = \left\{\begin{align} x^2 &, \text{ if } x≤1 \\ 3 &, \text{ if } 1 < x ≤ 2 \\ x &, \text{ if } x > 2 \end{align}\right. $$
Solution
Before graphing the equations, start by marking the domains on the x-axis. Do something like draw light vertical dotted lines at x = 1 and x = 2.
The domains for each equation change at x = 1 and x = 2.
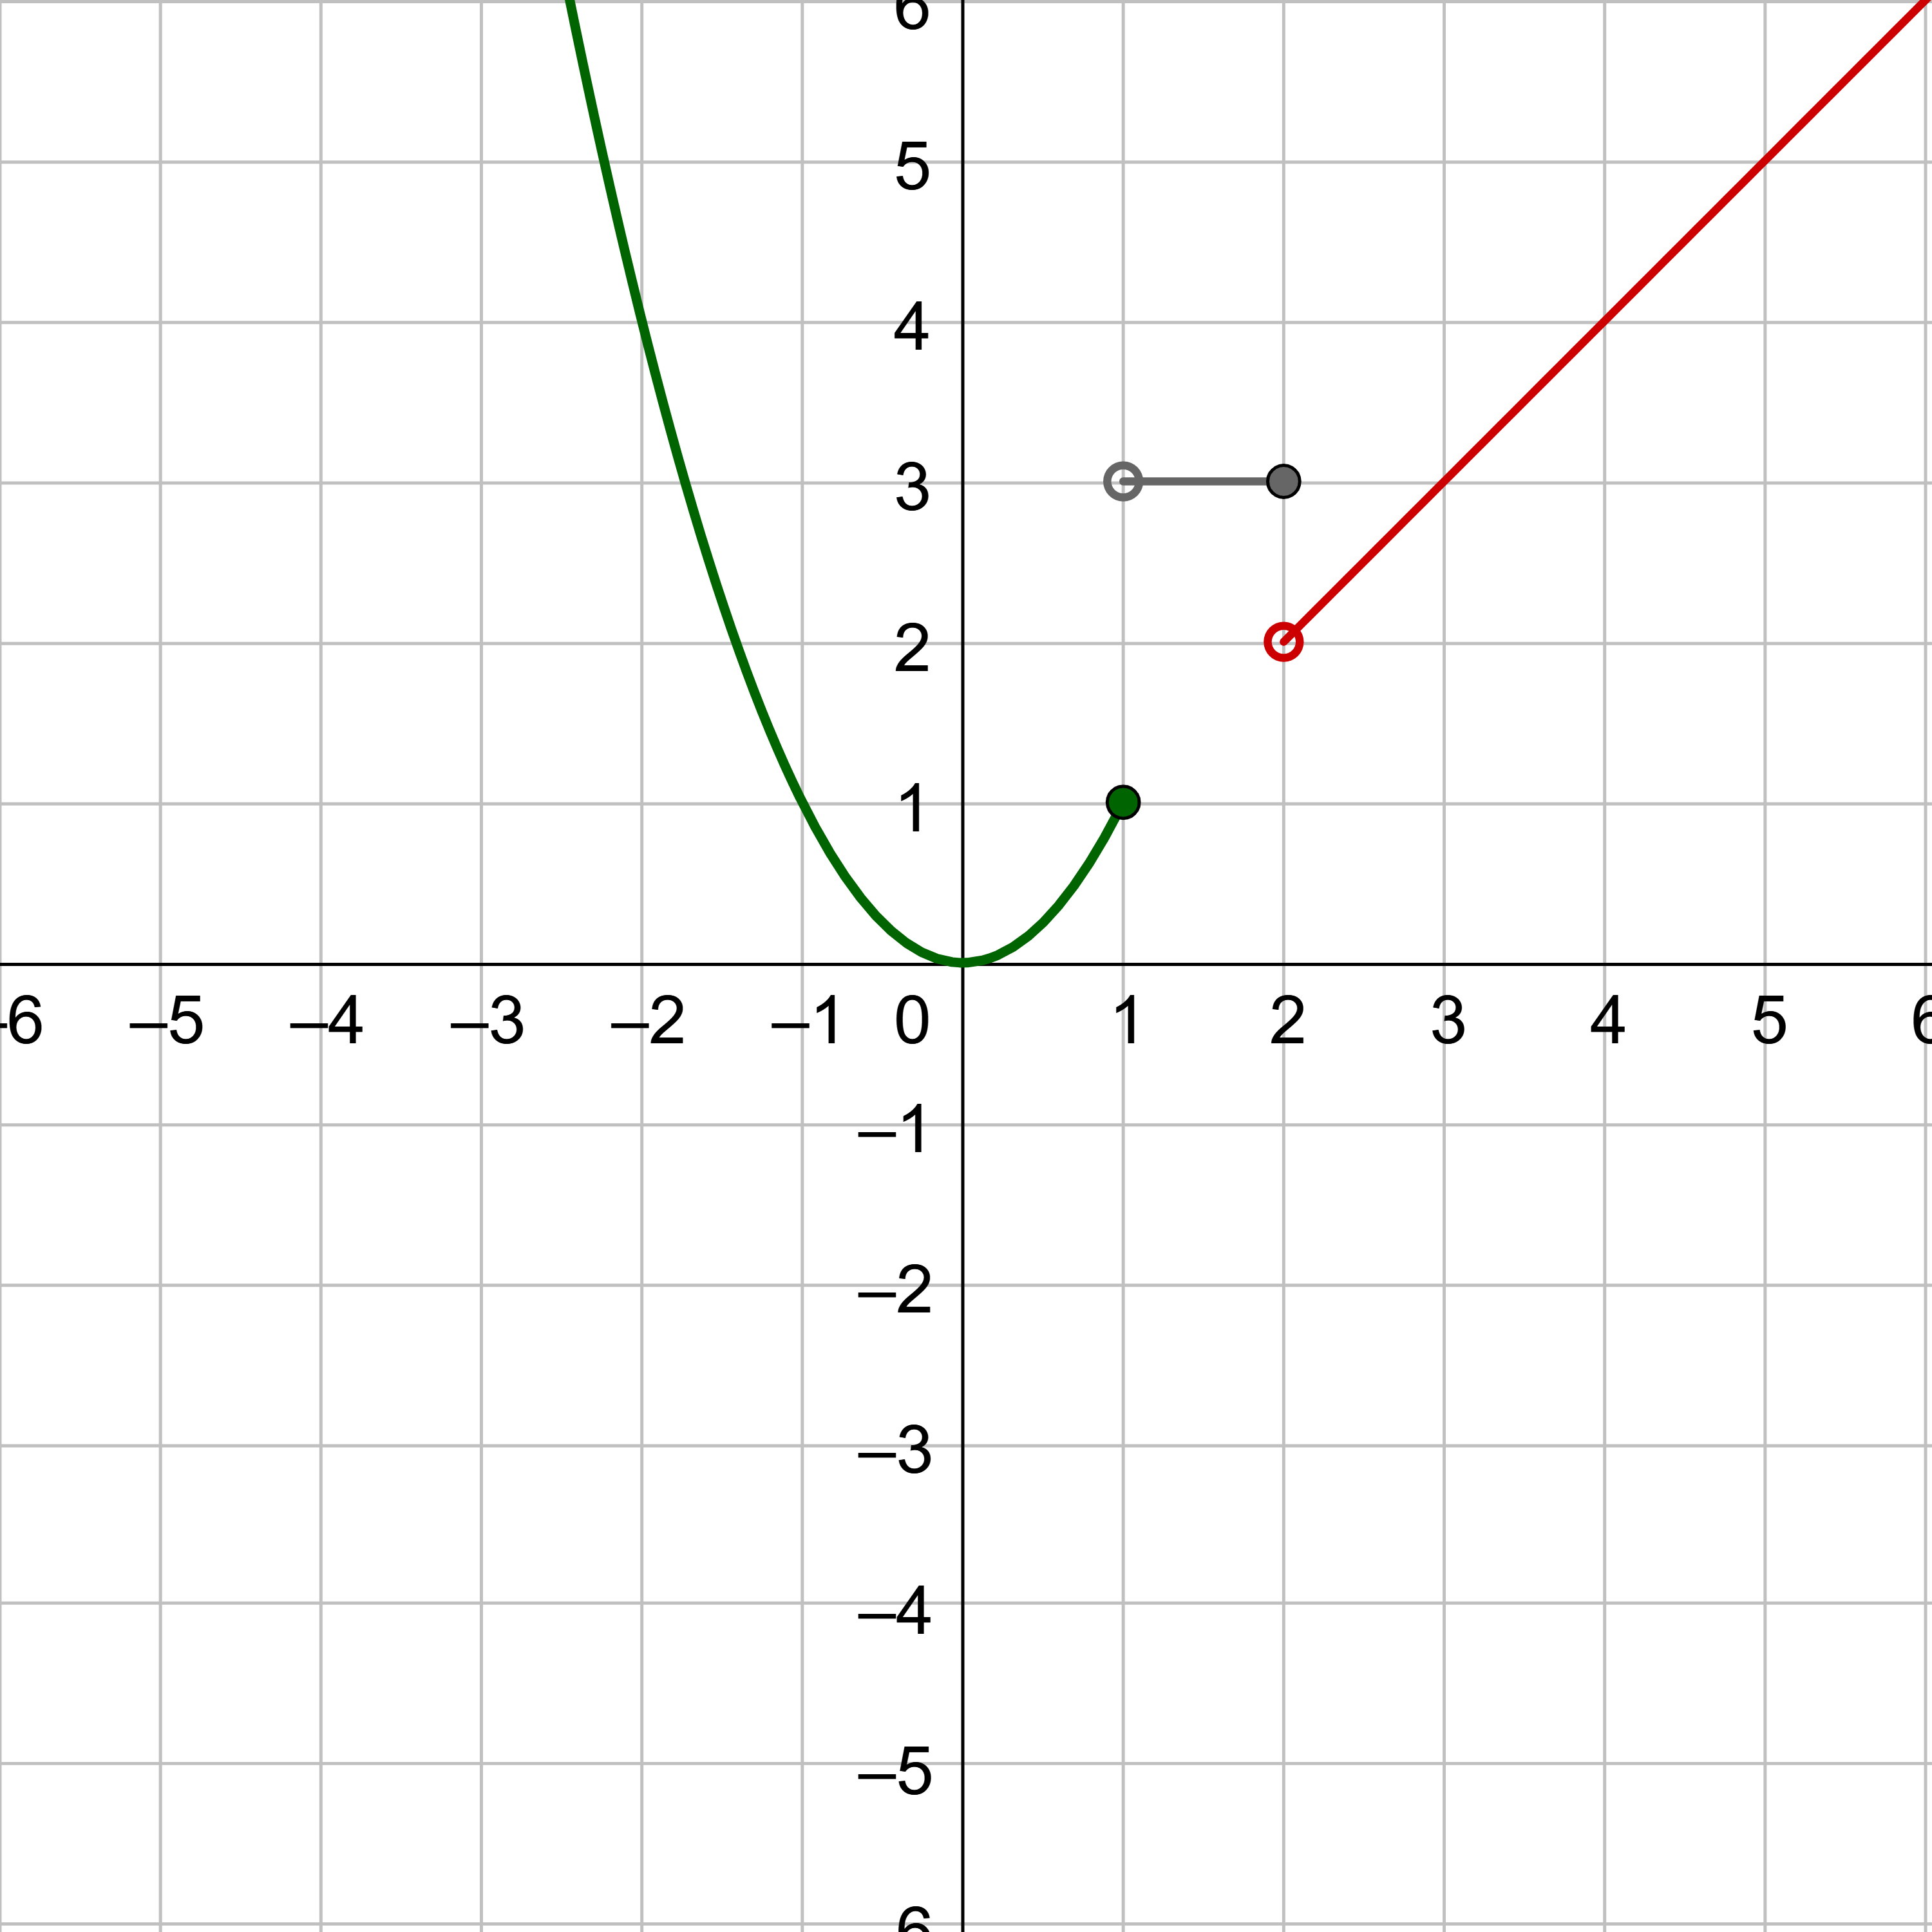
Each of the component functions is from the library of parent functions, so their shapes are known. However, only draw the portion of the graph in each domain. At the edges of the domain, draw a filled dot when the endpoint is included because of a less-than-or-equal-to or greater-than-or-equal-to sign; draw a open dot when the point is not included due to a less-than or greater-than sign. Figure 16 shows the individual pieces of the graph, then figure 17 shows the complete graph.
(a) f(x) x2 if x ≤ 1; (b) f(x) = 3 if 1 < x ≤ 2 (c) f(x) = x if x > 2\(f(x) = \left\{\begin{align} x^2 &, \text{ if } x≤1 \\ 3 &, \text{ if } 1 < x ≤ 2 \\ x &, \text{ if } x > 2 \end{align}\right.\)
Analysis
Note that the graph does pass the vertical line test even at x = 1 and x = 2 because the points (1, 3) and (2, 2) are not part of the graph of the function, though (1, 1) and (2, 3) are.
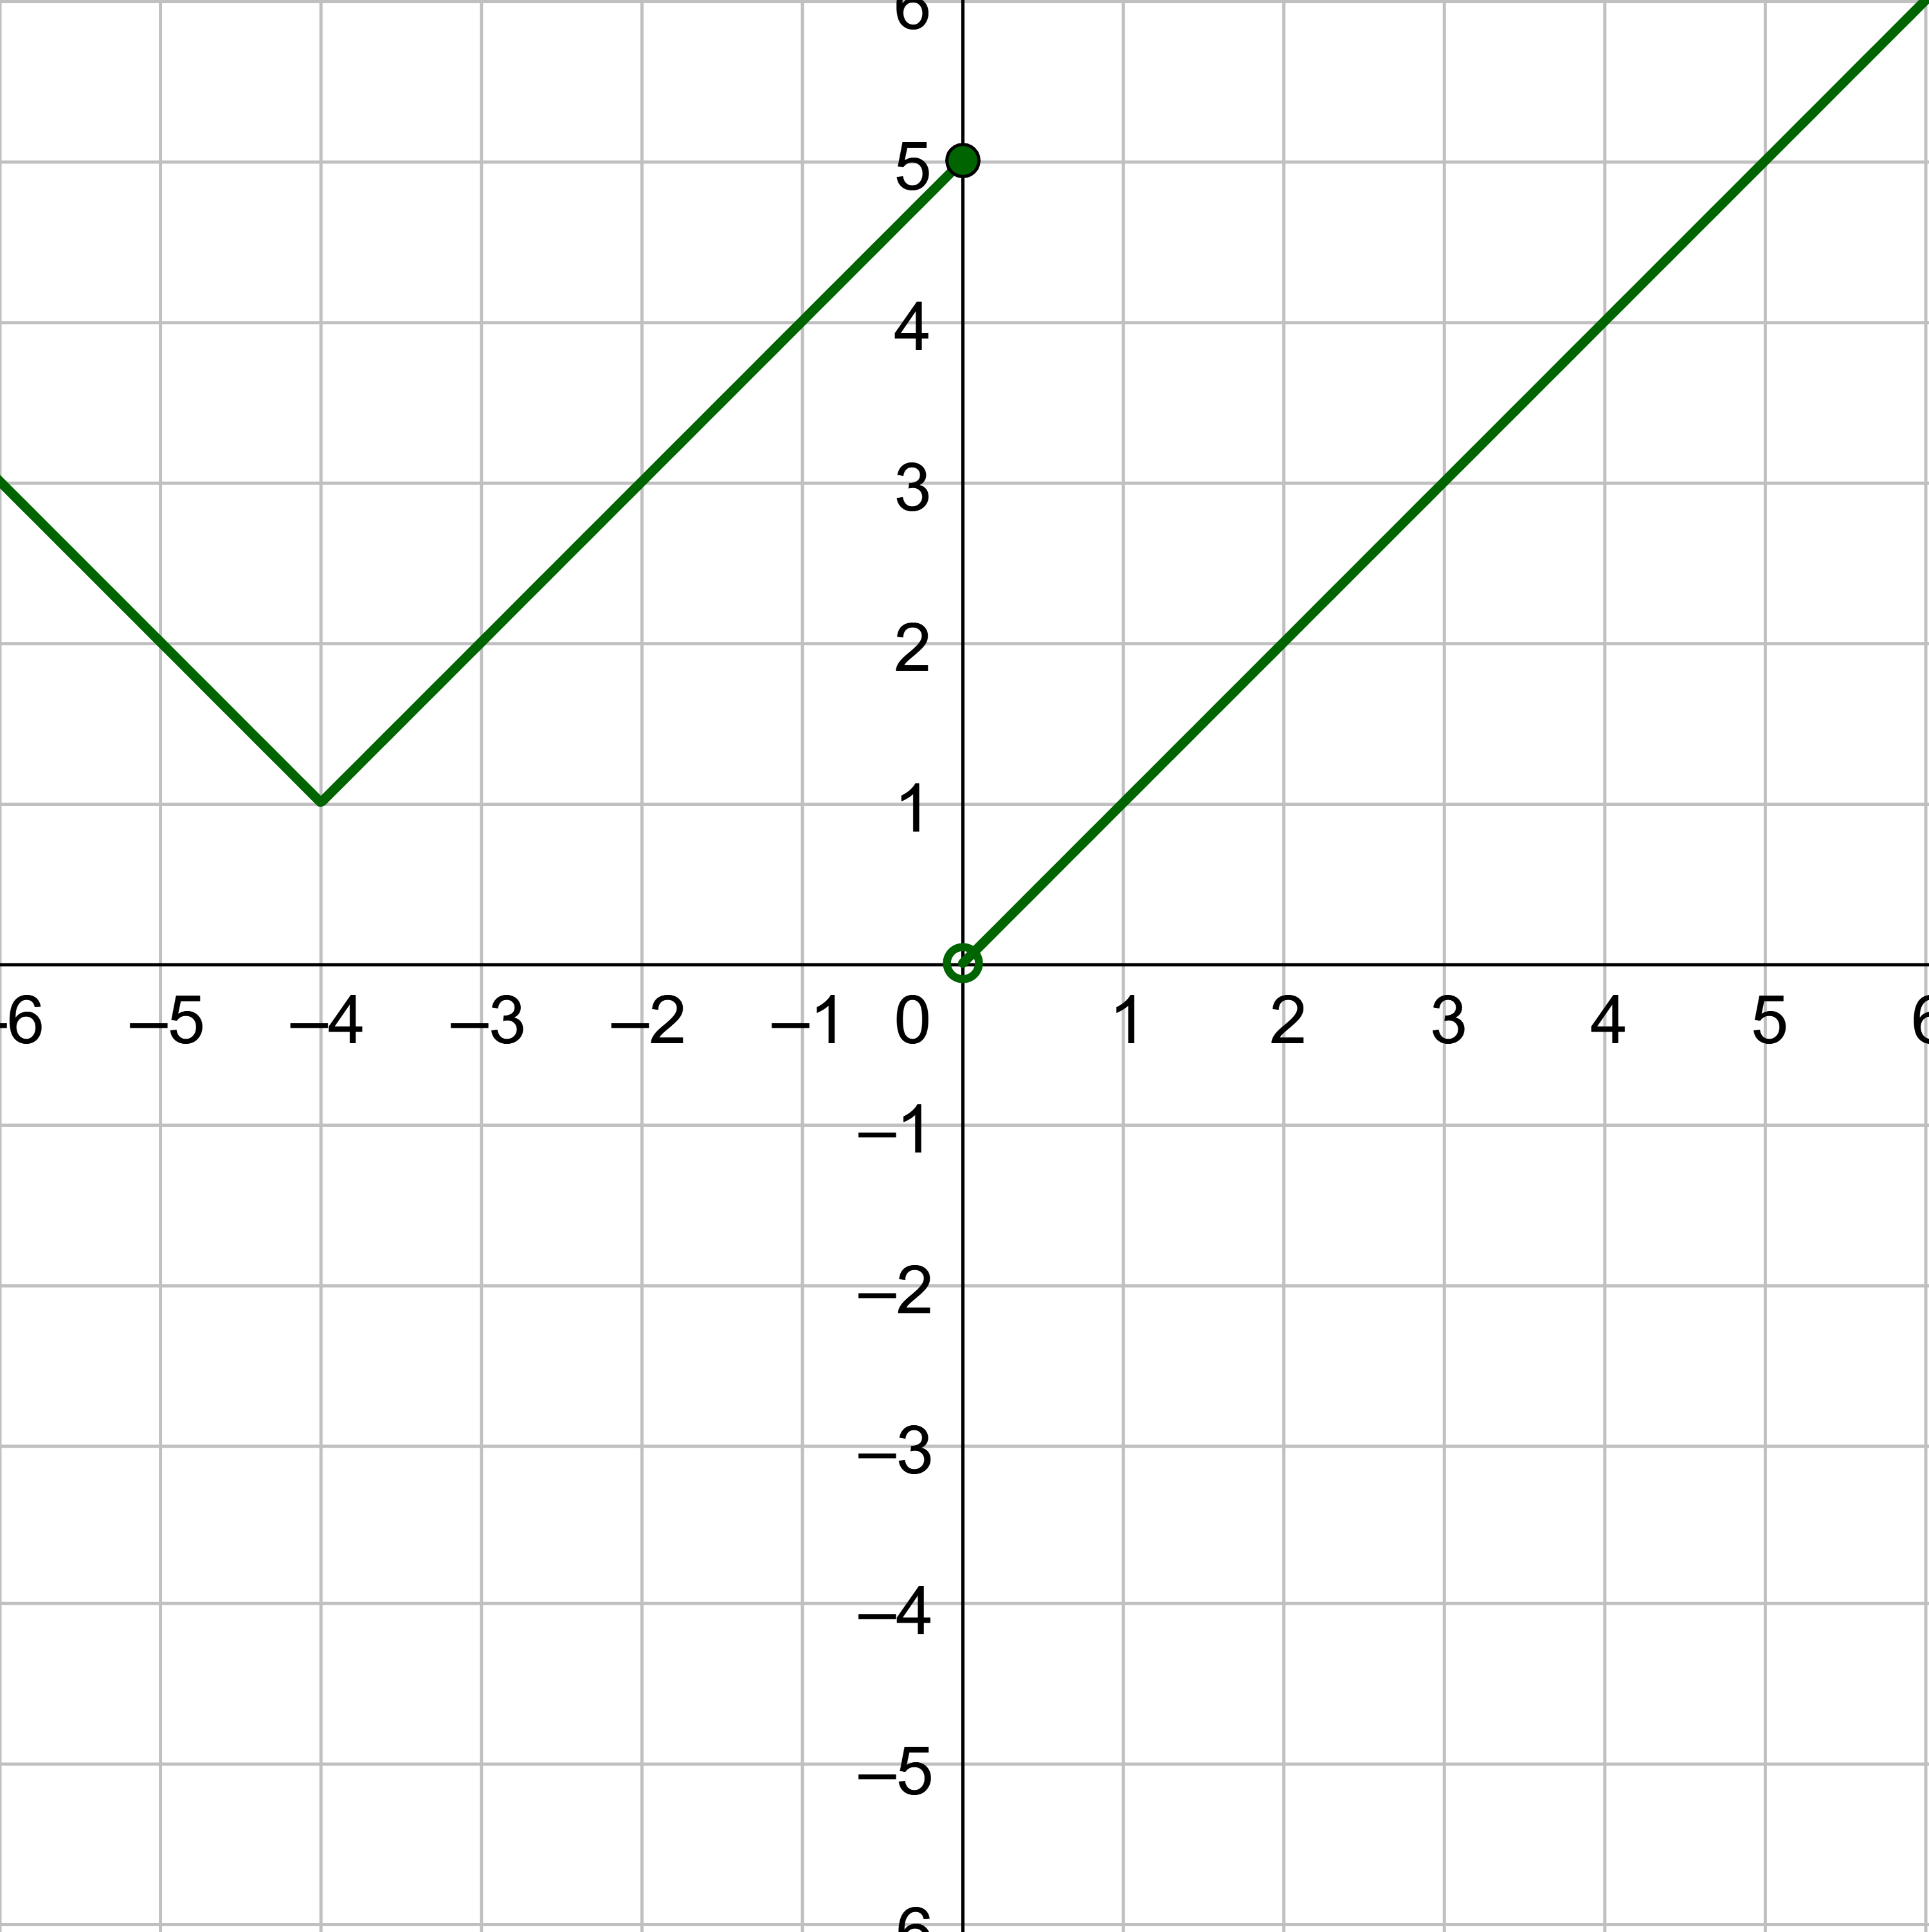
Sketch a graph of \(f(x) = \left\{\begin{align} x + 2 &, \text{ if } x < -1 \\ |x| &, \text{ if } x ≥ -1 \end{align}\right.\)
Answer
Lesson Summary
Graph on a Graphing Calculator
All graphing calculators are different but have similar commands. The following instructions are for the TI-84.
TI-83/84
TI-84
Press the o button
Enter the equation
Press the s button
If the axes are not centered, press q, then choose zStandard.
If the graph is not visible, press q, then choose ZoomFit
The window range can also be set by pressing p
To copy the graph to your paper, press y0 and plot the points on your paper
NumWorks
NumWorks
Press the home button and select Grapher
Select the Expressions tab at the top
Add or edit the function
Select the Graph tab at the top
The zoom options are at the top
Auto: should show most of the graph
Axes: lets you enter the values to set the visible window
Navigate: lets you use the arrows to move the graph around
Zoom with the + and - keys.
To copy the graph to your paper, select the Table tab at the top and plot the points on your paper
Graph a Piecewise Function
Mark the boundaries on the x-axis of the intervals for each piece of the domain.
For each piece of the domain, graph on the corresponding equation. Do not graph two functions over one interval because it would violate the criteria of a function.
Identify the parent function and then use a graphing utility to graph the function. Be sure to choose an appropriate viewing window.
\(f(x) = \frac{2}{3}x - \frac{1}{3}\)
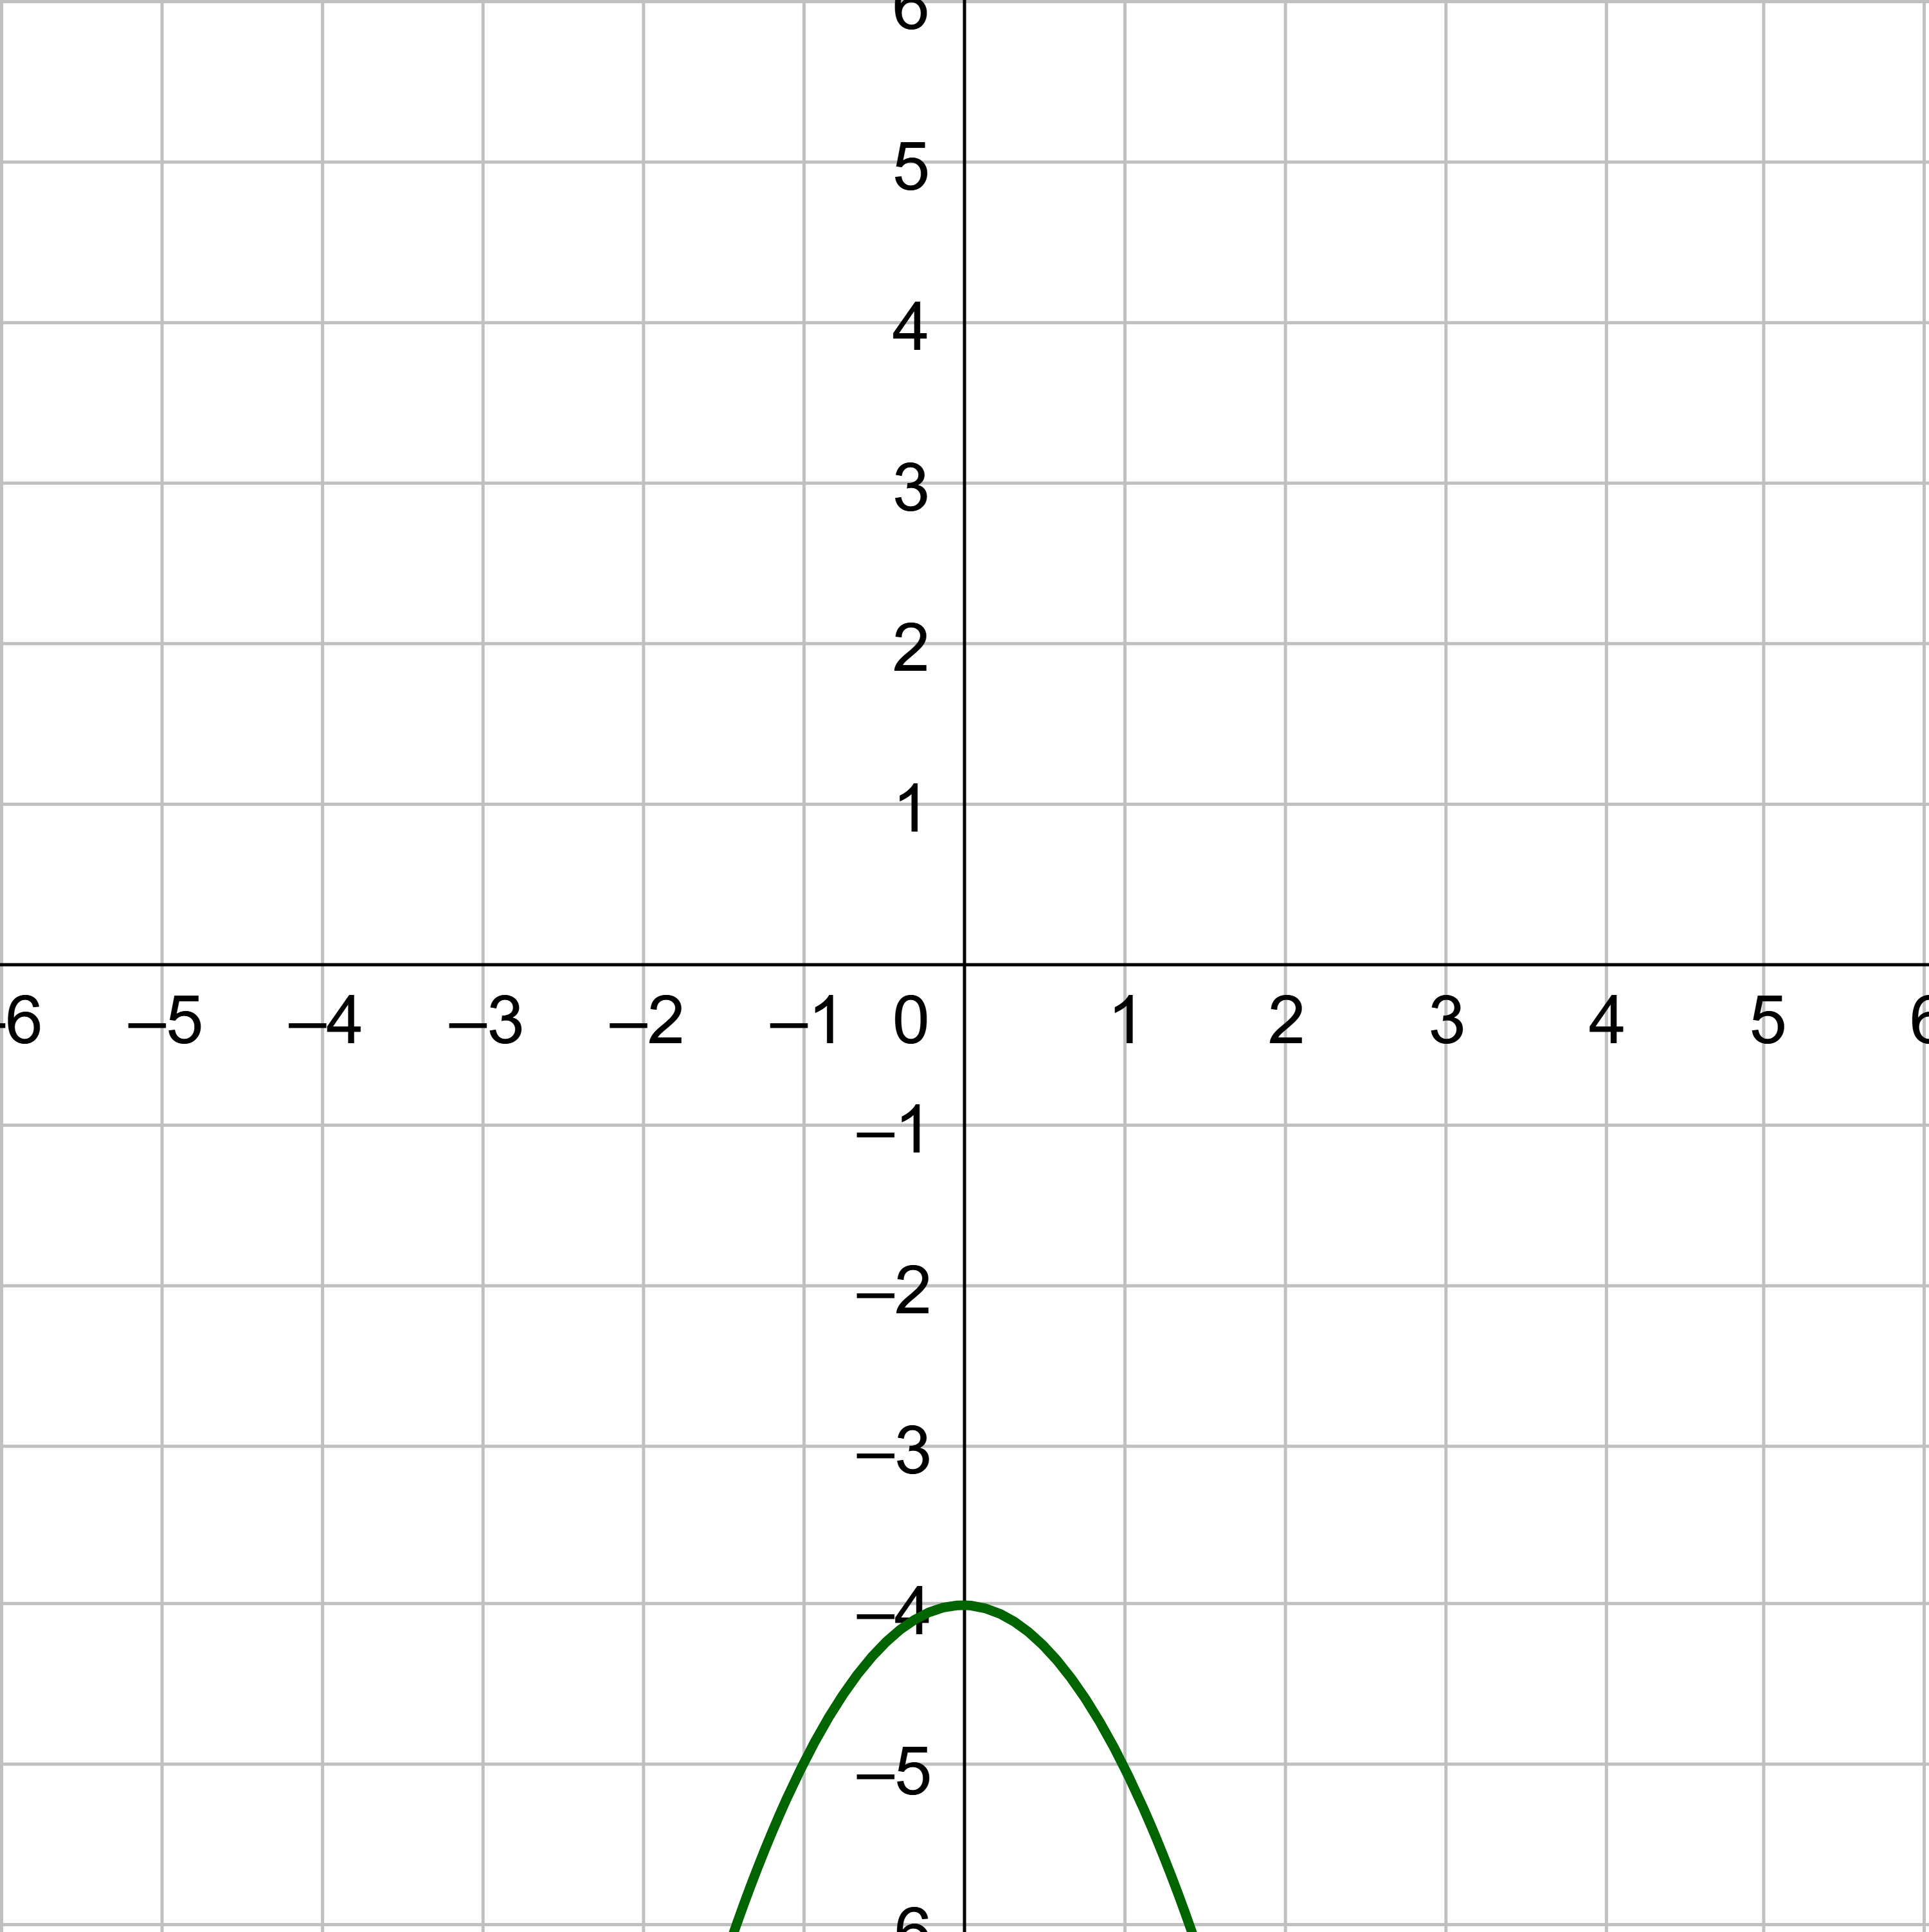
g(x) = −x2 − 4
\(h(x) = 2\sqrt{x}\)
\(j(x) = \frac{1}{x+1}\)
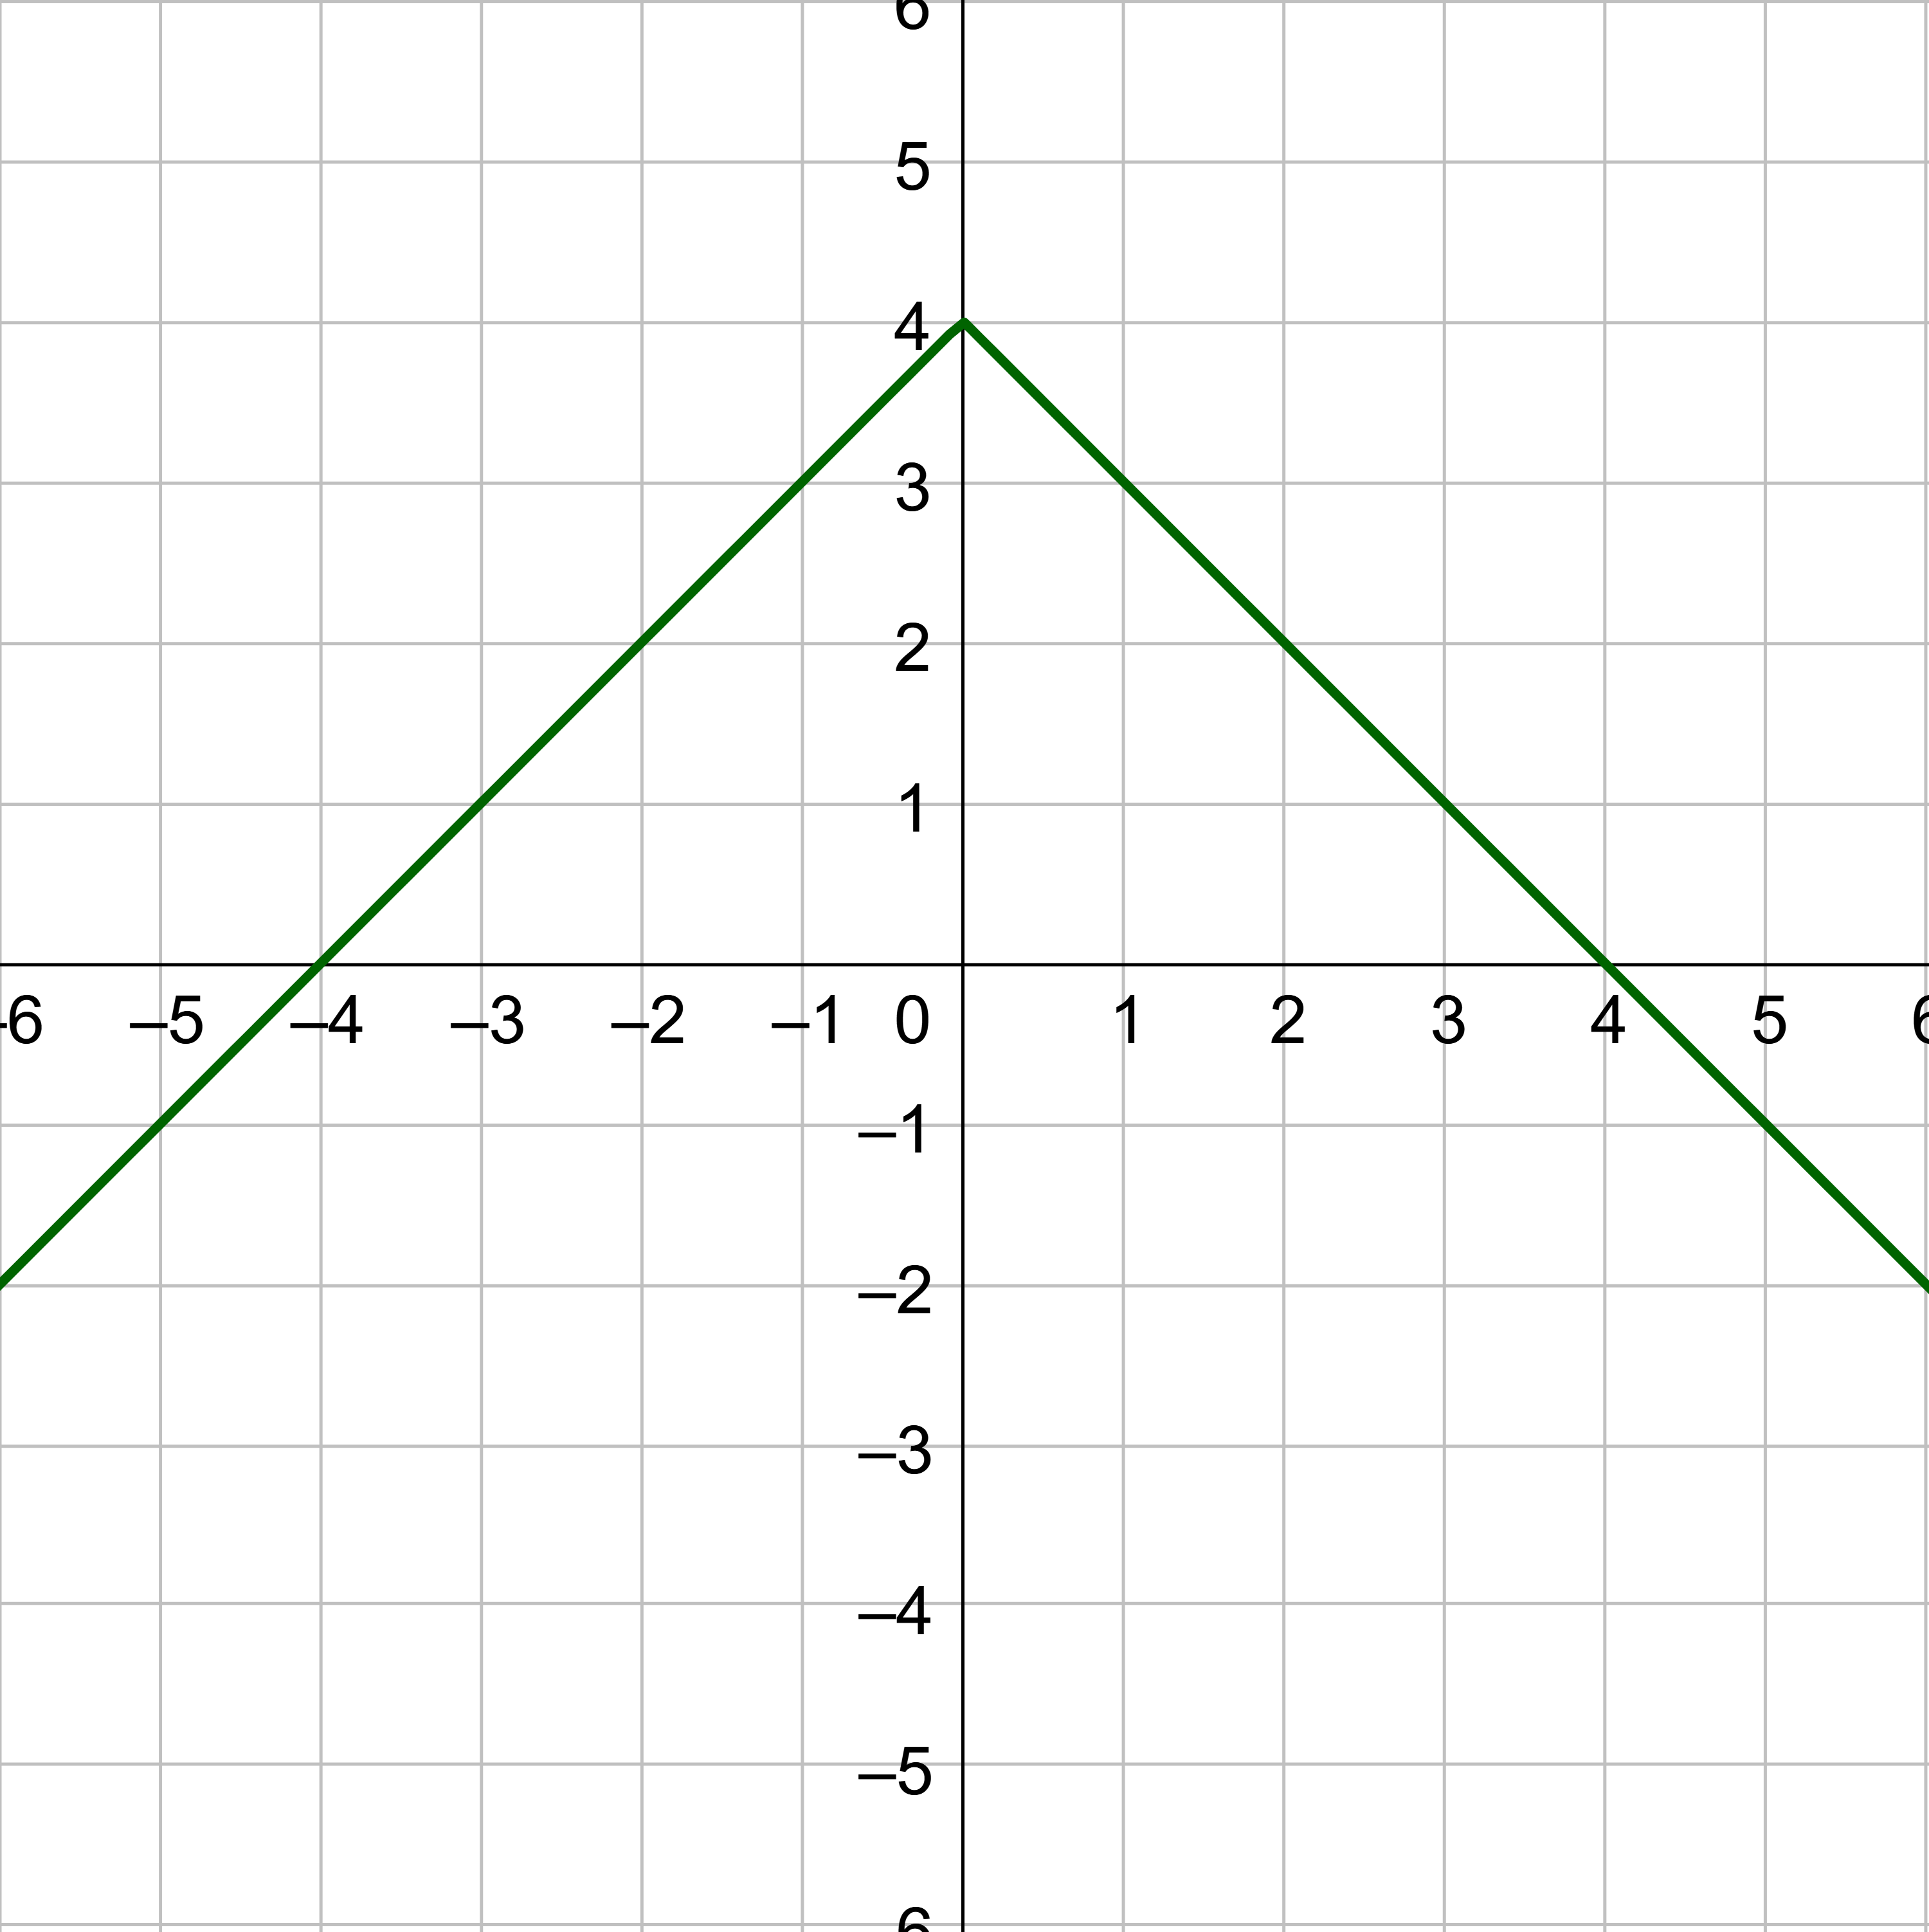
k(x) = −|x| + 4
Sketch a graph of the piecewise function.
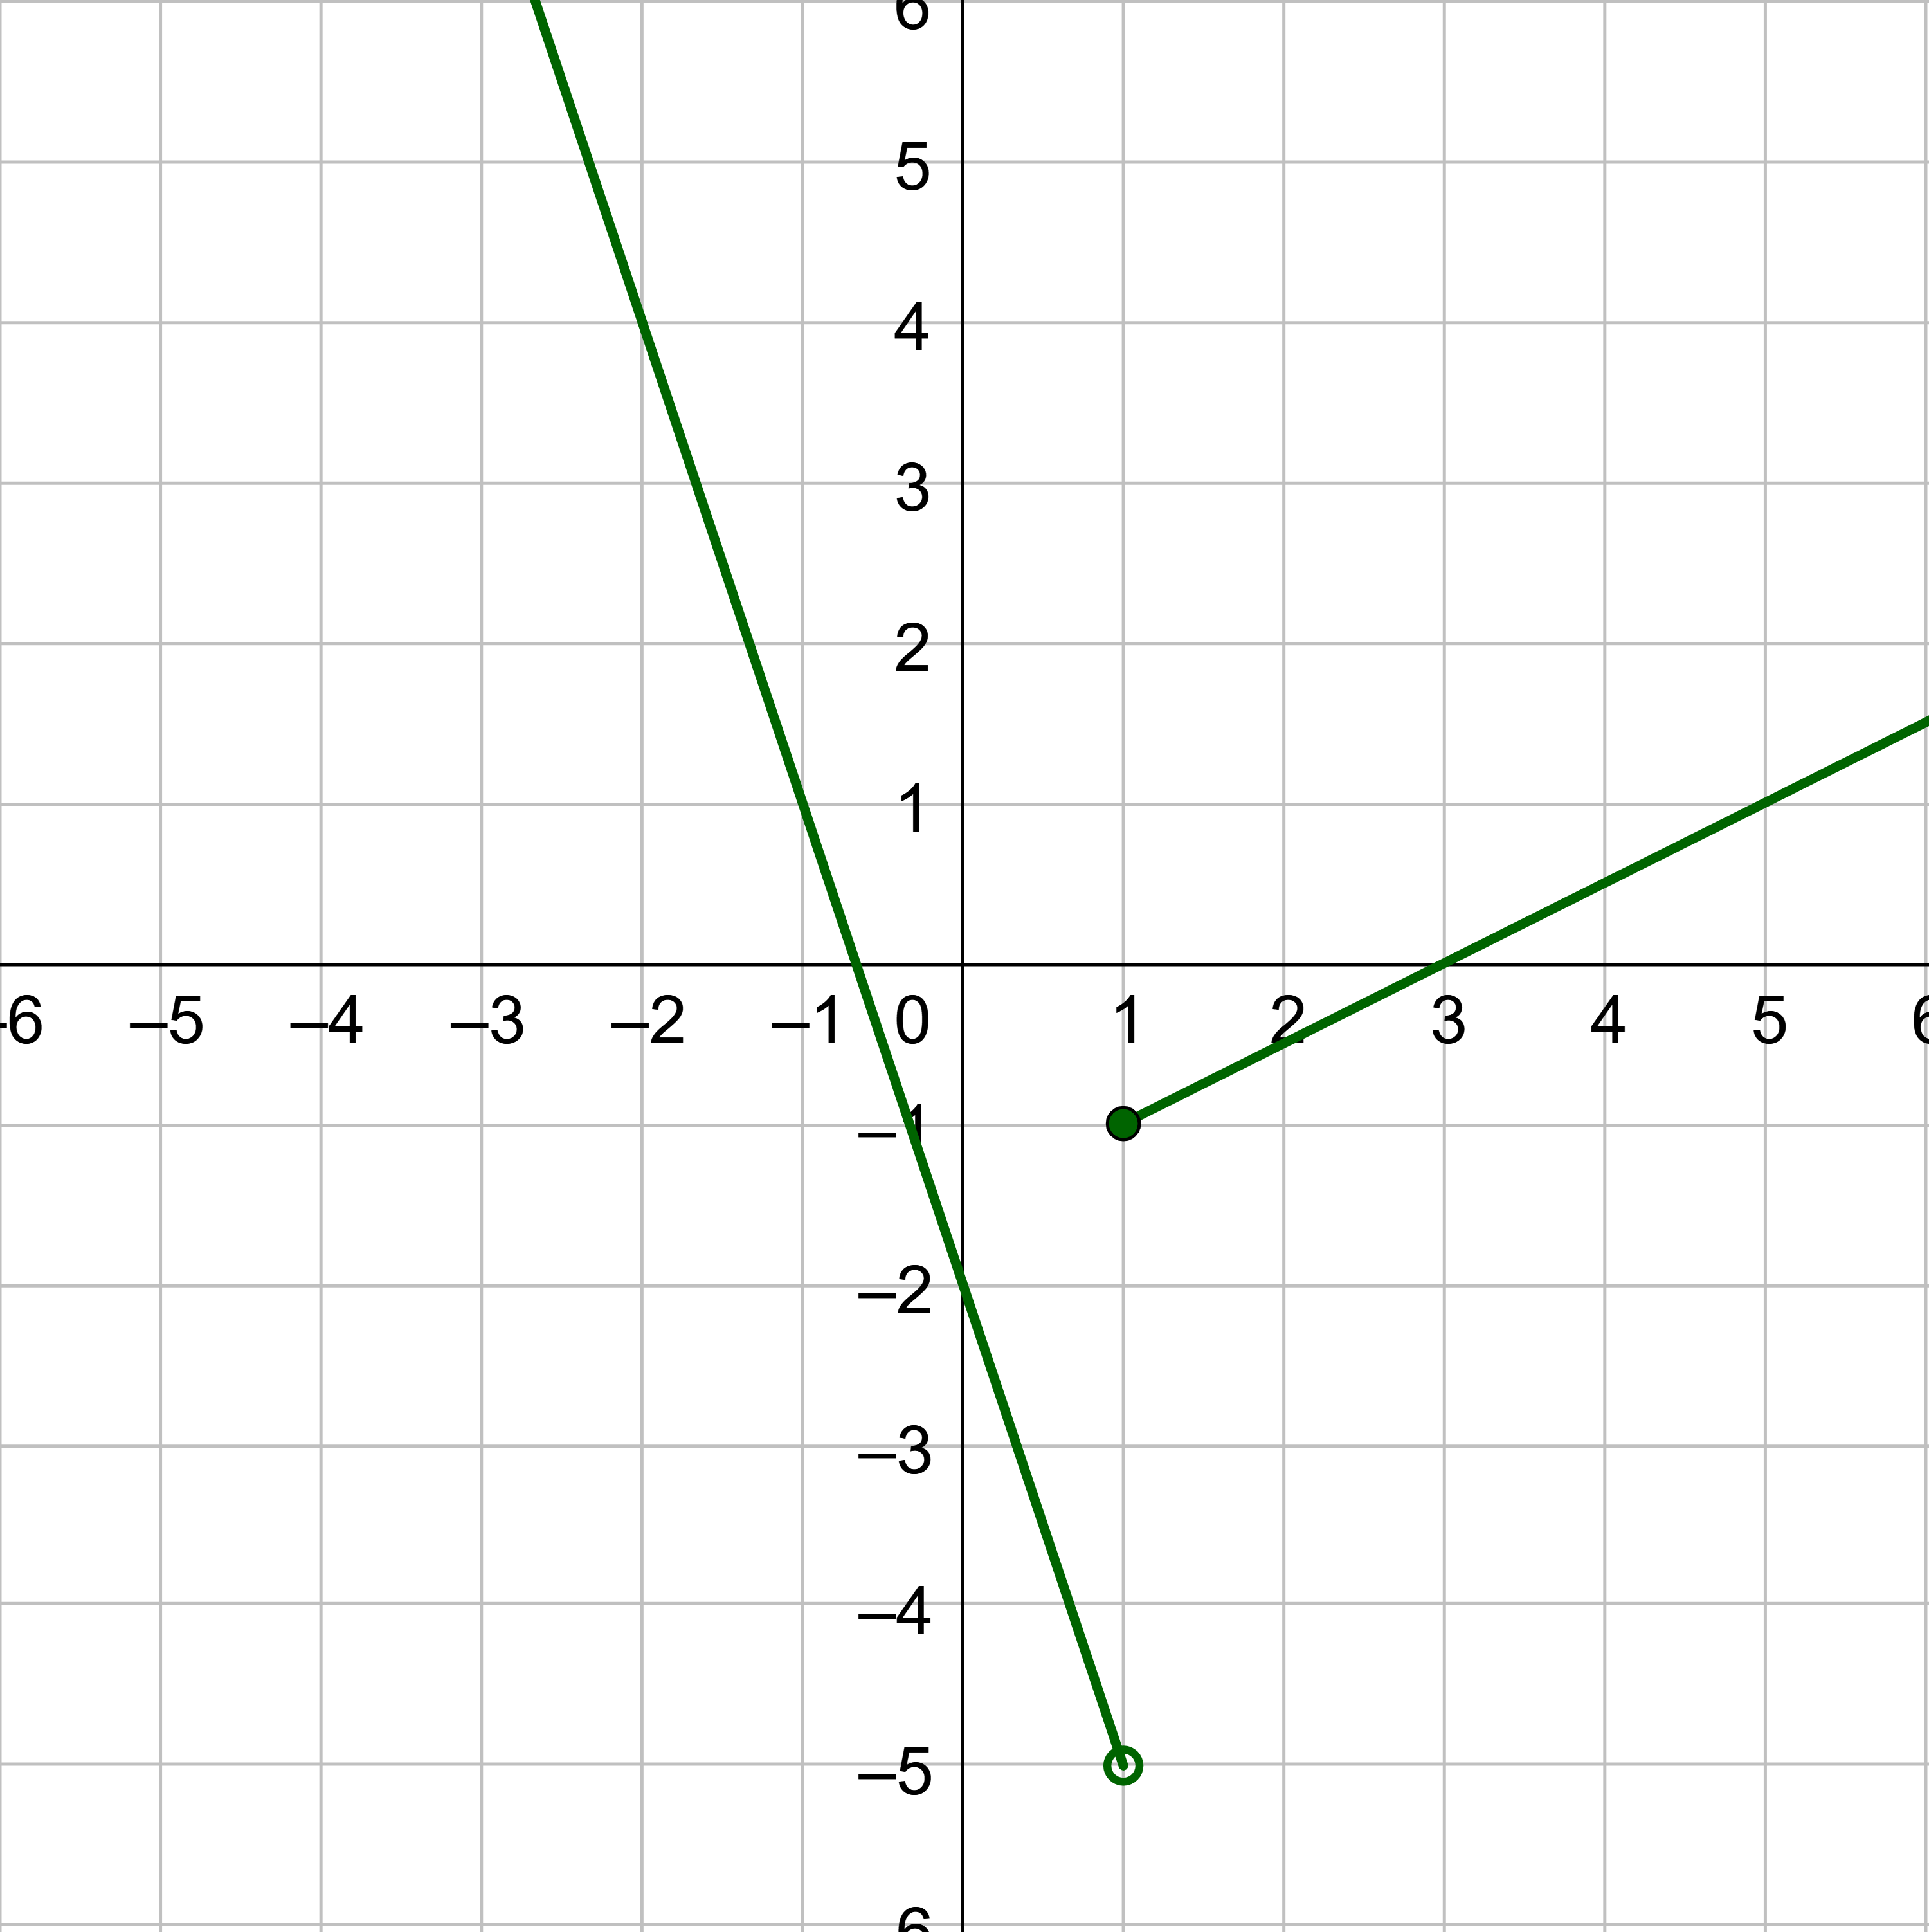
\(f(x) = \left\{\begin{align} -3x - 2 &, \text{ if } x < 1 \\ \frac{1}{2}x - \frac{3}{2} &, \text{ if } x ≥ 1 \end{align}\right.\)
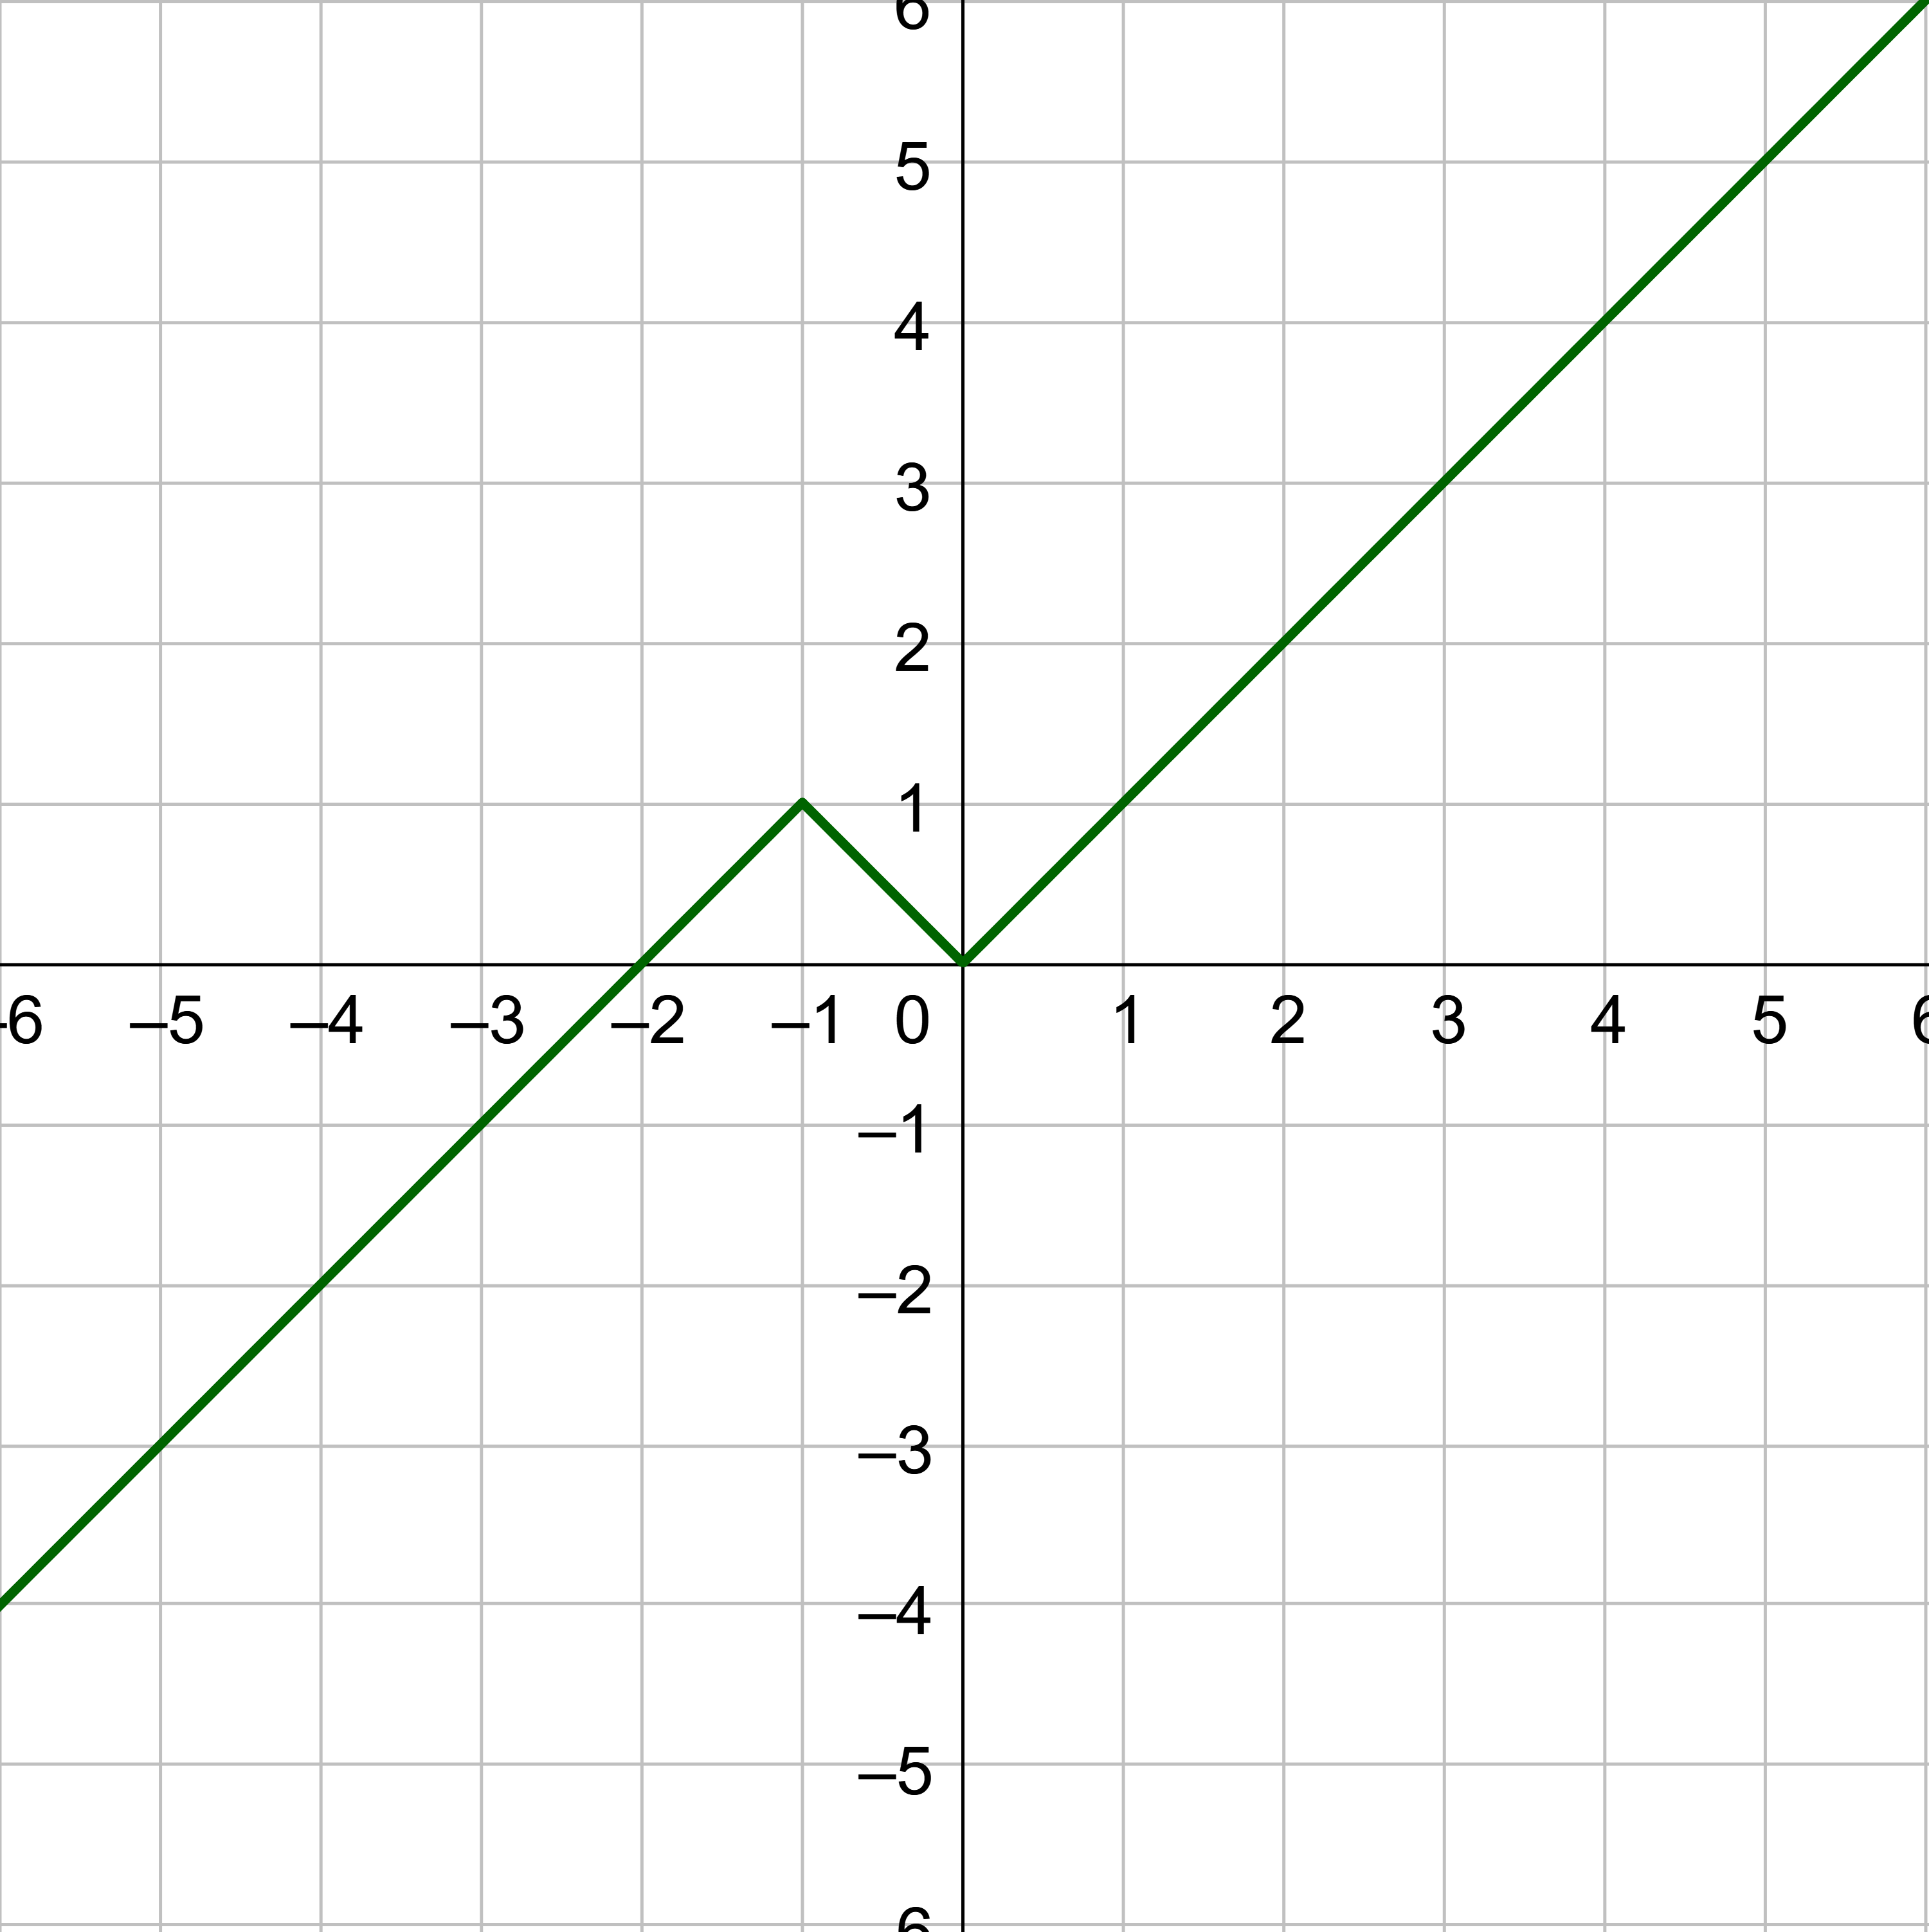
\(f(x) = \left\{\begin{align} \frac{1}{x} &, \text{ if } x < -1 \\ \sqrt{x+1}-1 &, \text{ if } x ≥ -1 \end{align}\right.\)
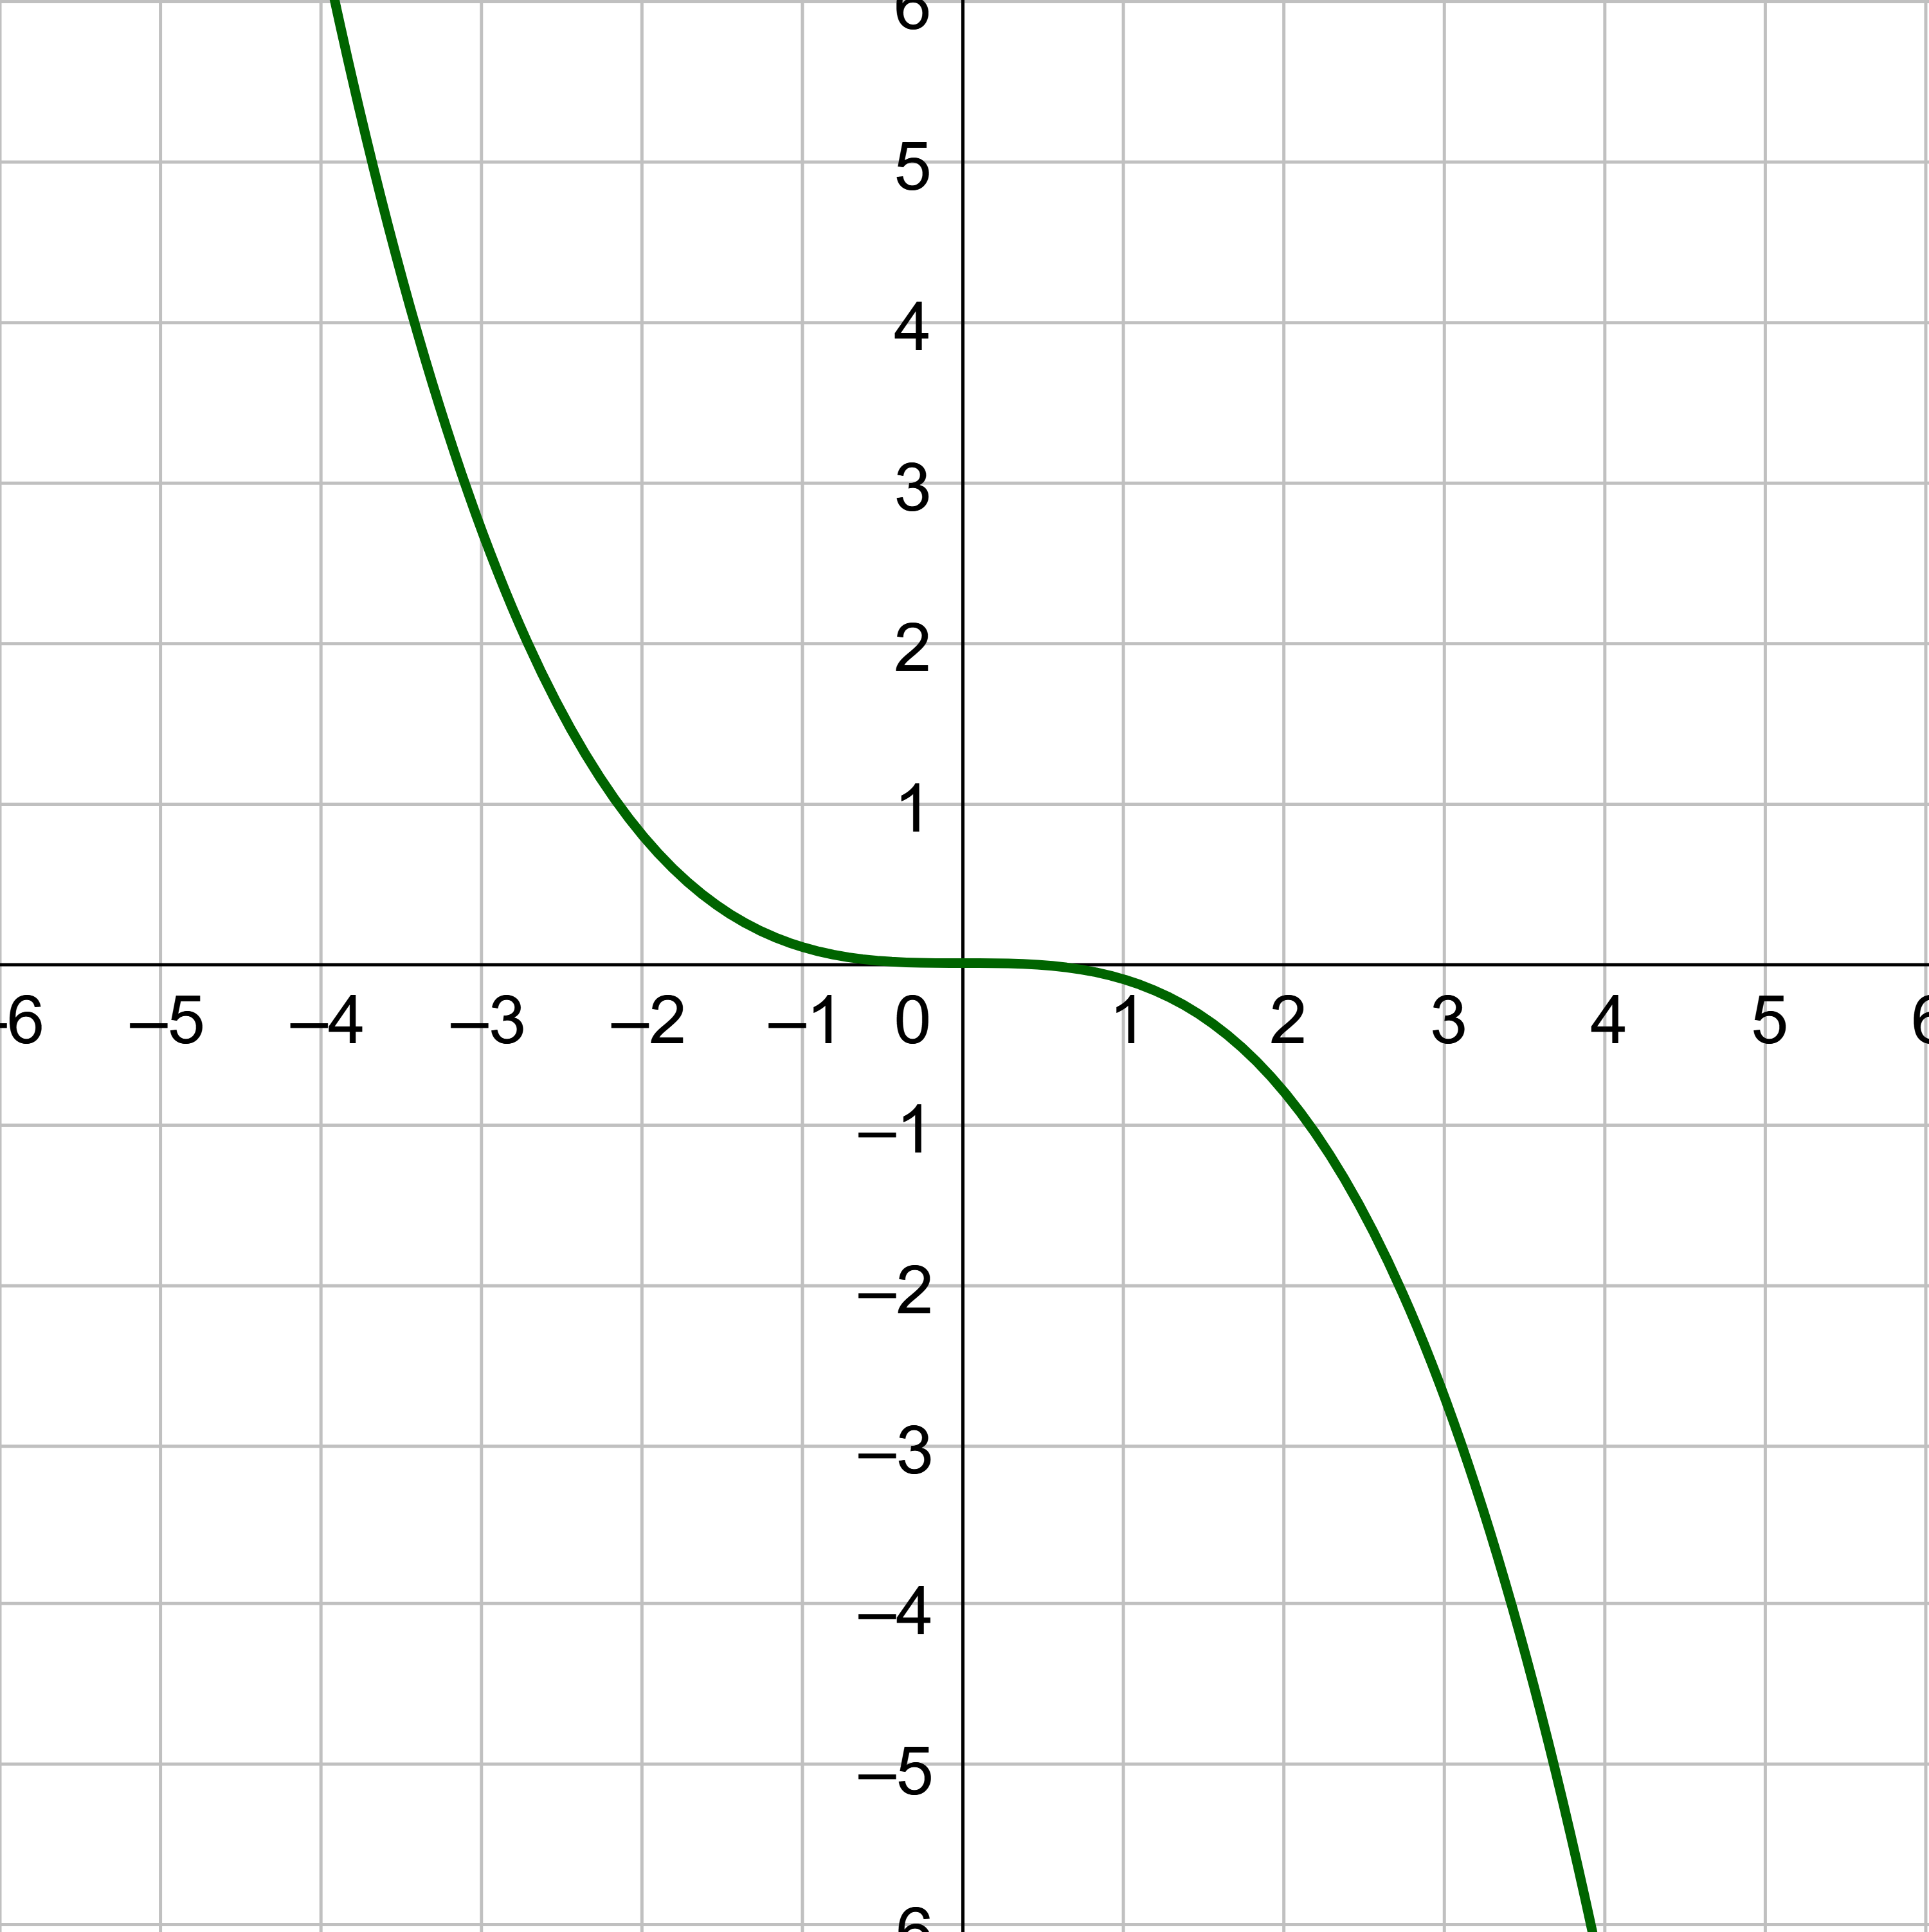
\(f(x) = \left\{\begin{align} -x^3 &, \text{ if } x < 0 \\ x^2 &, \text{ if } x ≥ 0 \end{align}\right.\)
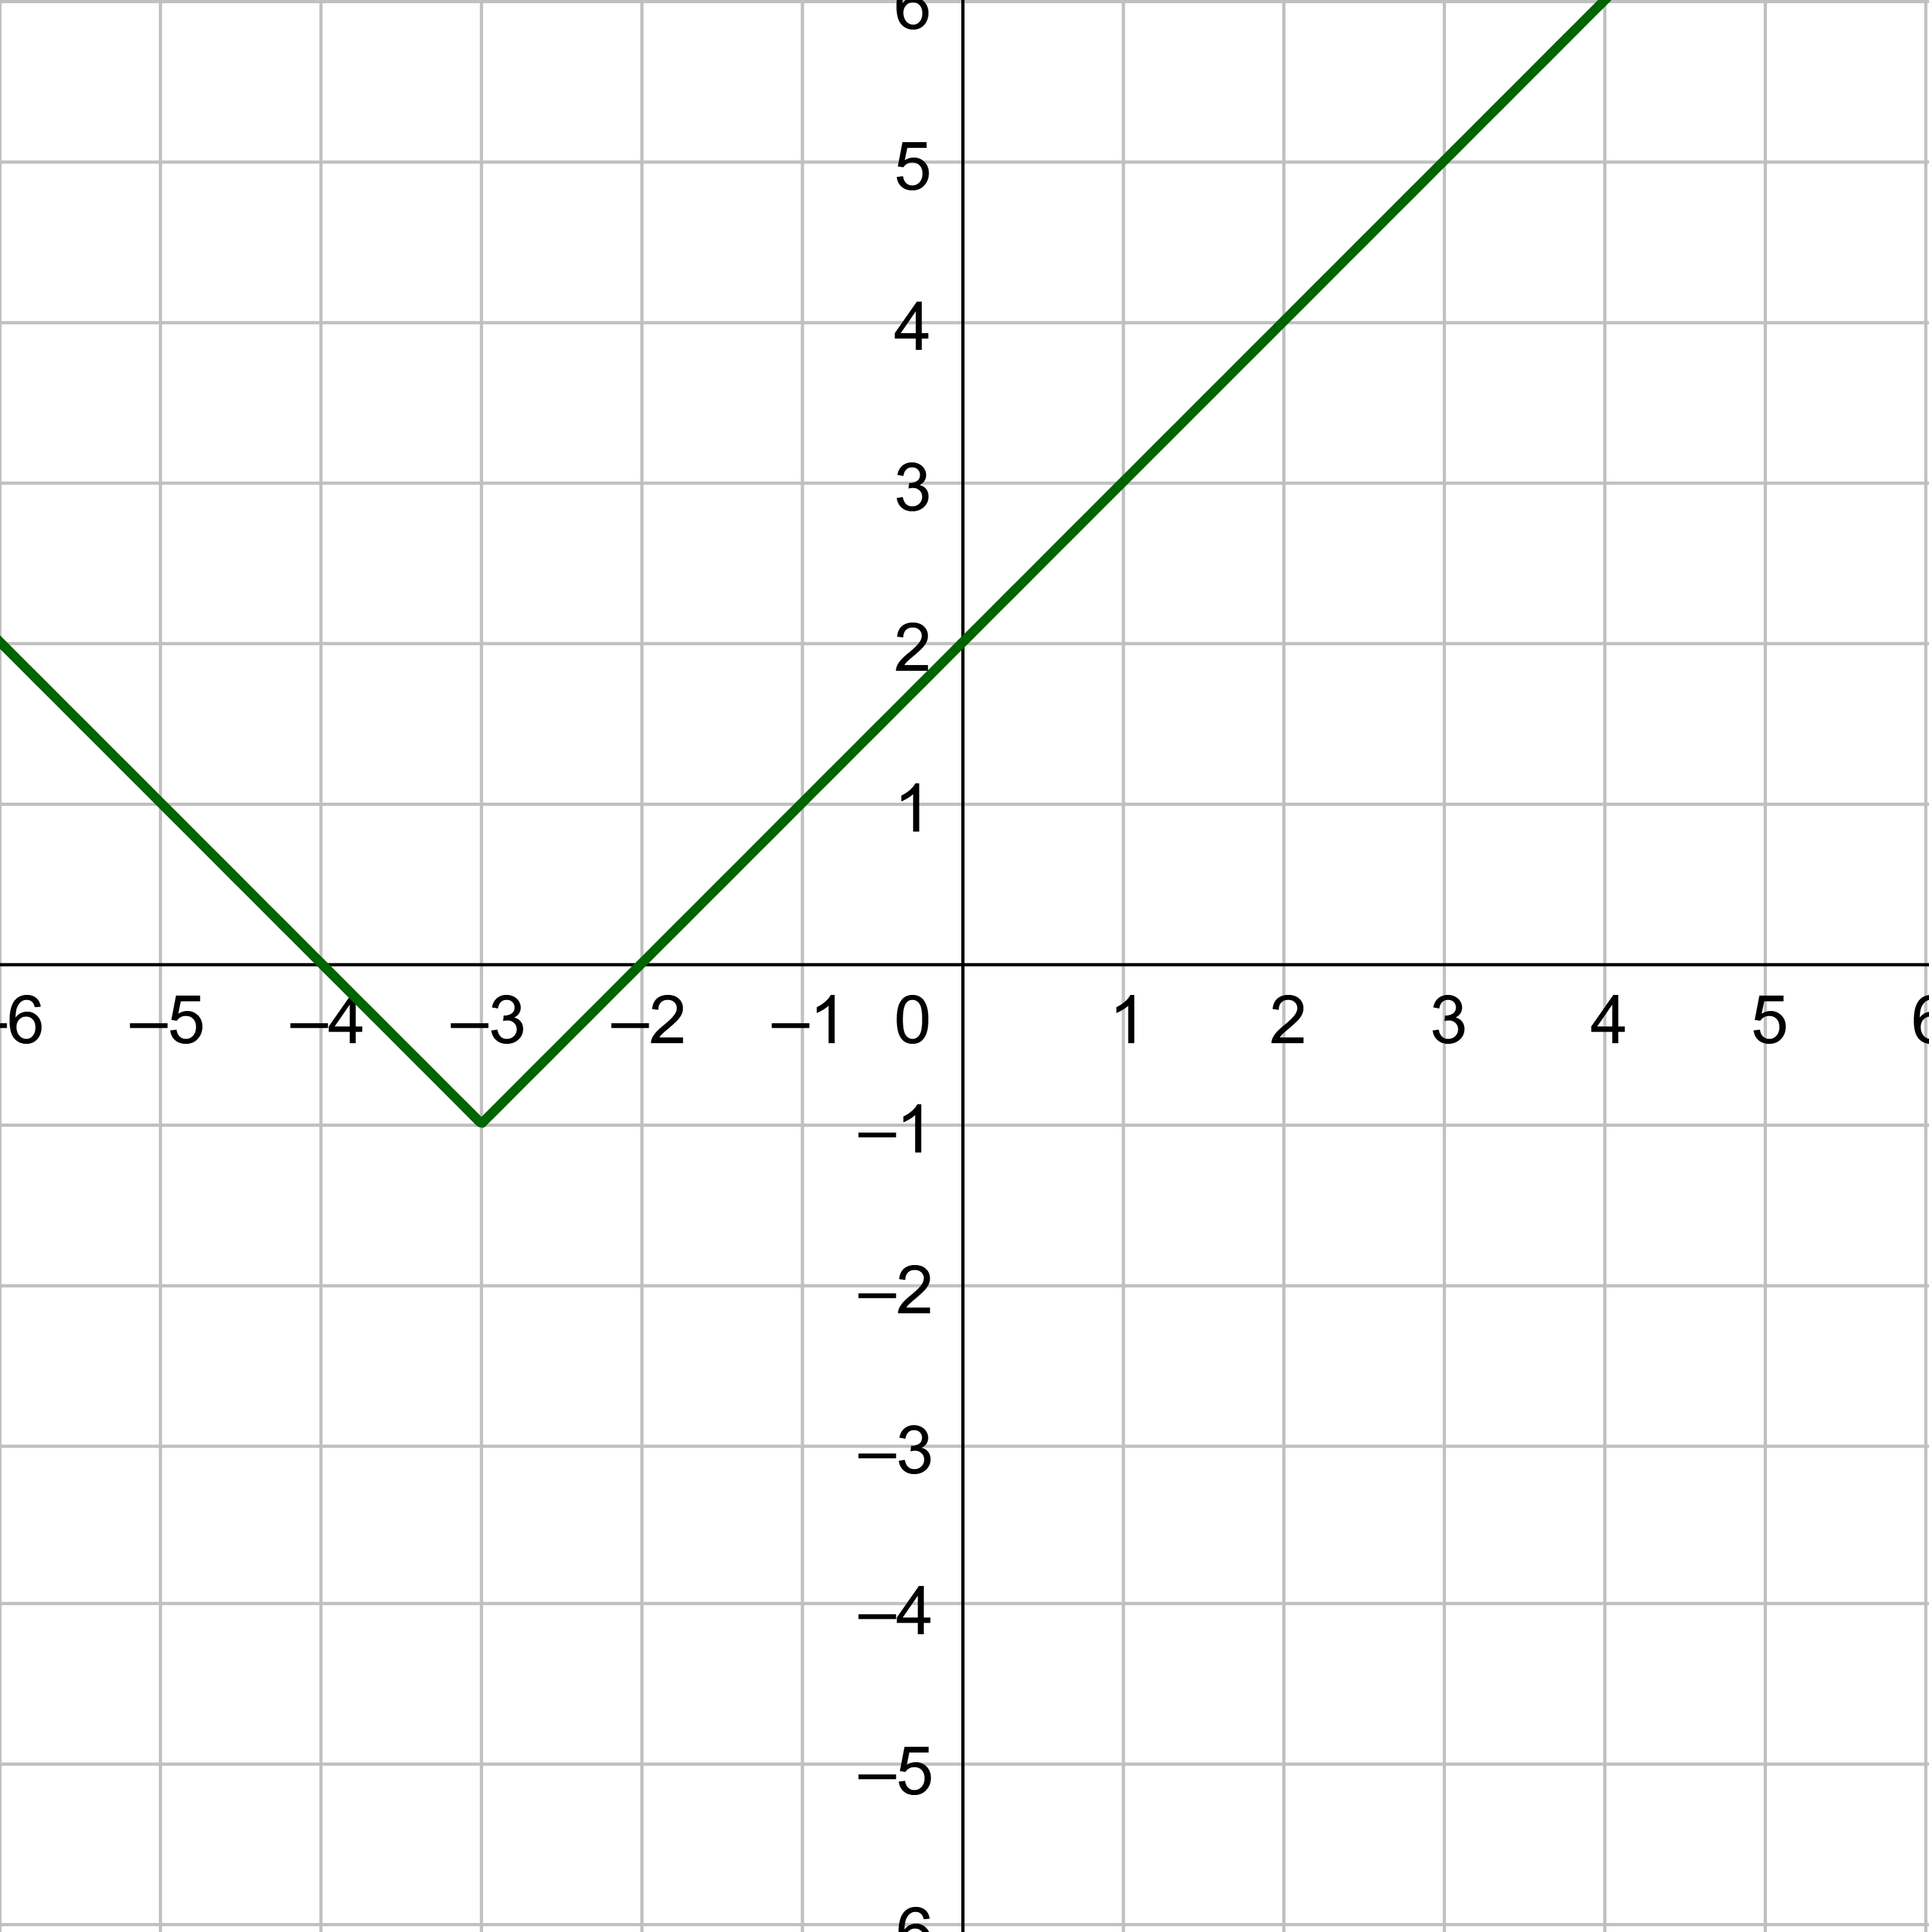
\(f(x) = \left\{\begin{align} |x + 4| + 1 &, \text{ if } x ≤ 0 \\ x &, \text{ if } x > 0 \end{align}\right.\)
Identify the parent function.
Problem Solving
A secretary is paid $14 per hour for regular time and time-and-a-half for overtime. The weekly wage function is
$$ W(h) = \left\{\begin{align} 14h &, \text{ if } 0 < h ≤ 40 \\ 21(h - 40) + 560 &, \text { if } h > 40\end{align}\right. $$
where h is the number of hours worked in a week.
Find W(30), W(40), W(50), W(60).
The company decreased the regular work week to 35 hours. What is the new weekly wage function?
Mixed Review
(1-05) Use the graph of the function to estimate the intervals on which the function is increasing or decreasing.
(1-05) Find zeros of f(x) = x2 − 4.
(1-05) Find the average rate of change from [x, x + h] for f(x) = 2x2.
(1-04) Evaluate the function g(x) = 2x + 3 at the indicated values g(−1), g(2), g(a), g(a + h)
(1-04) Find the domain of the function using interval notation: \(h(x) = 3\sqrt{x - 2}\)
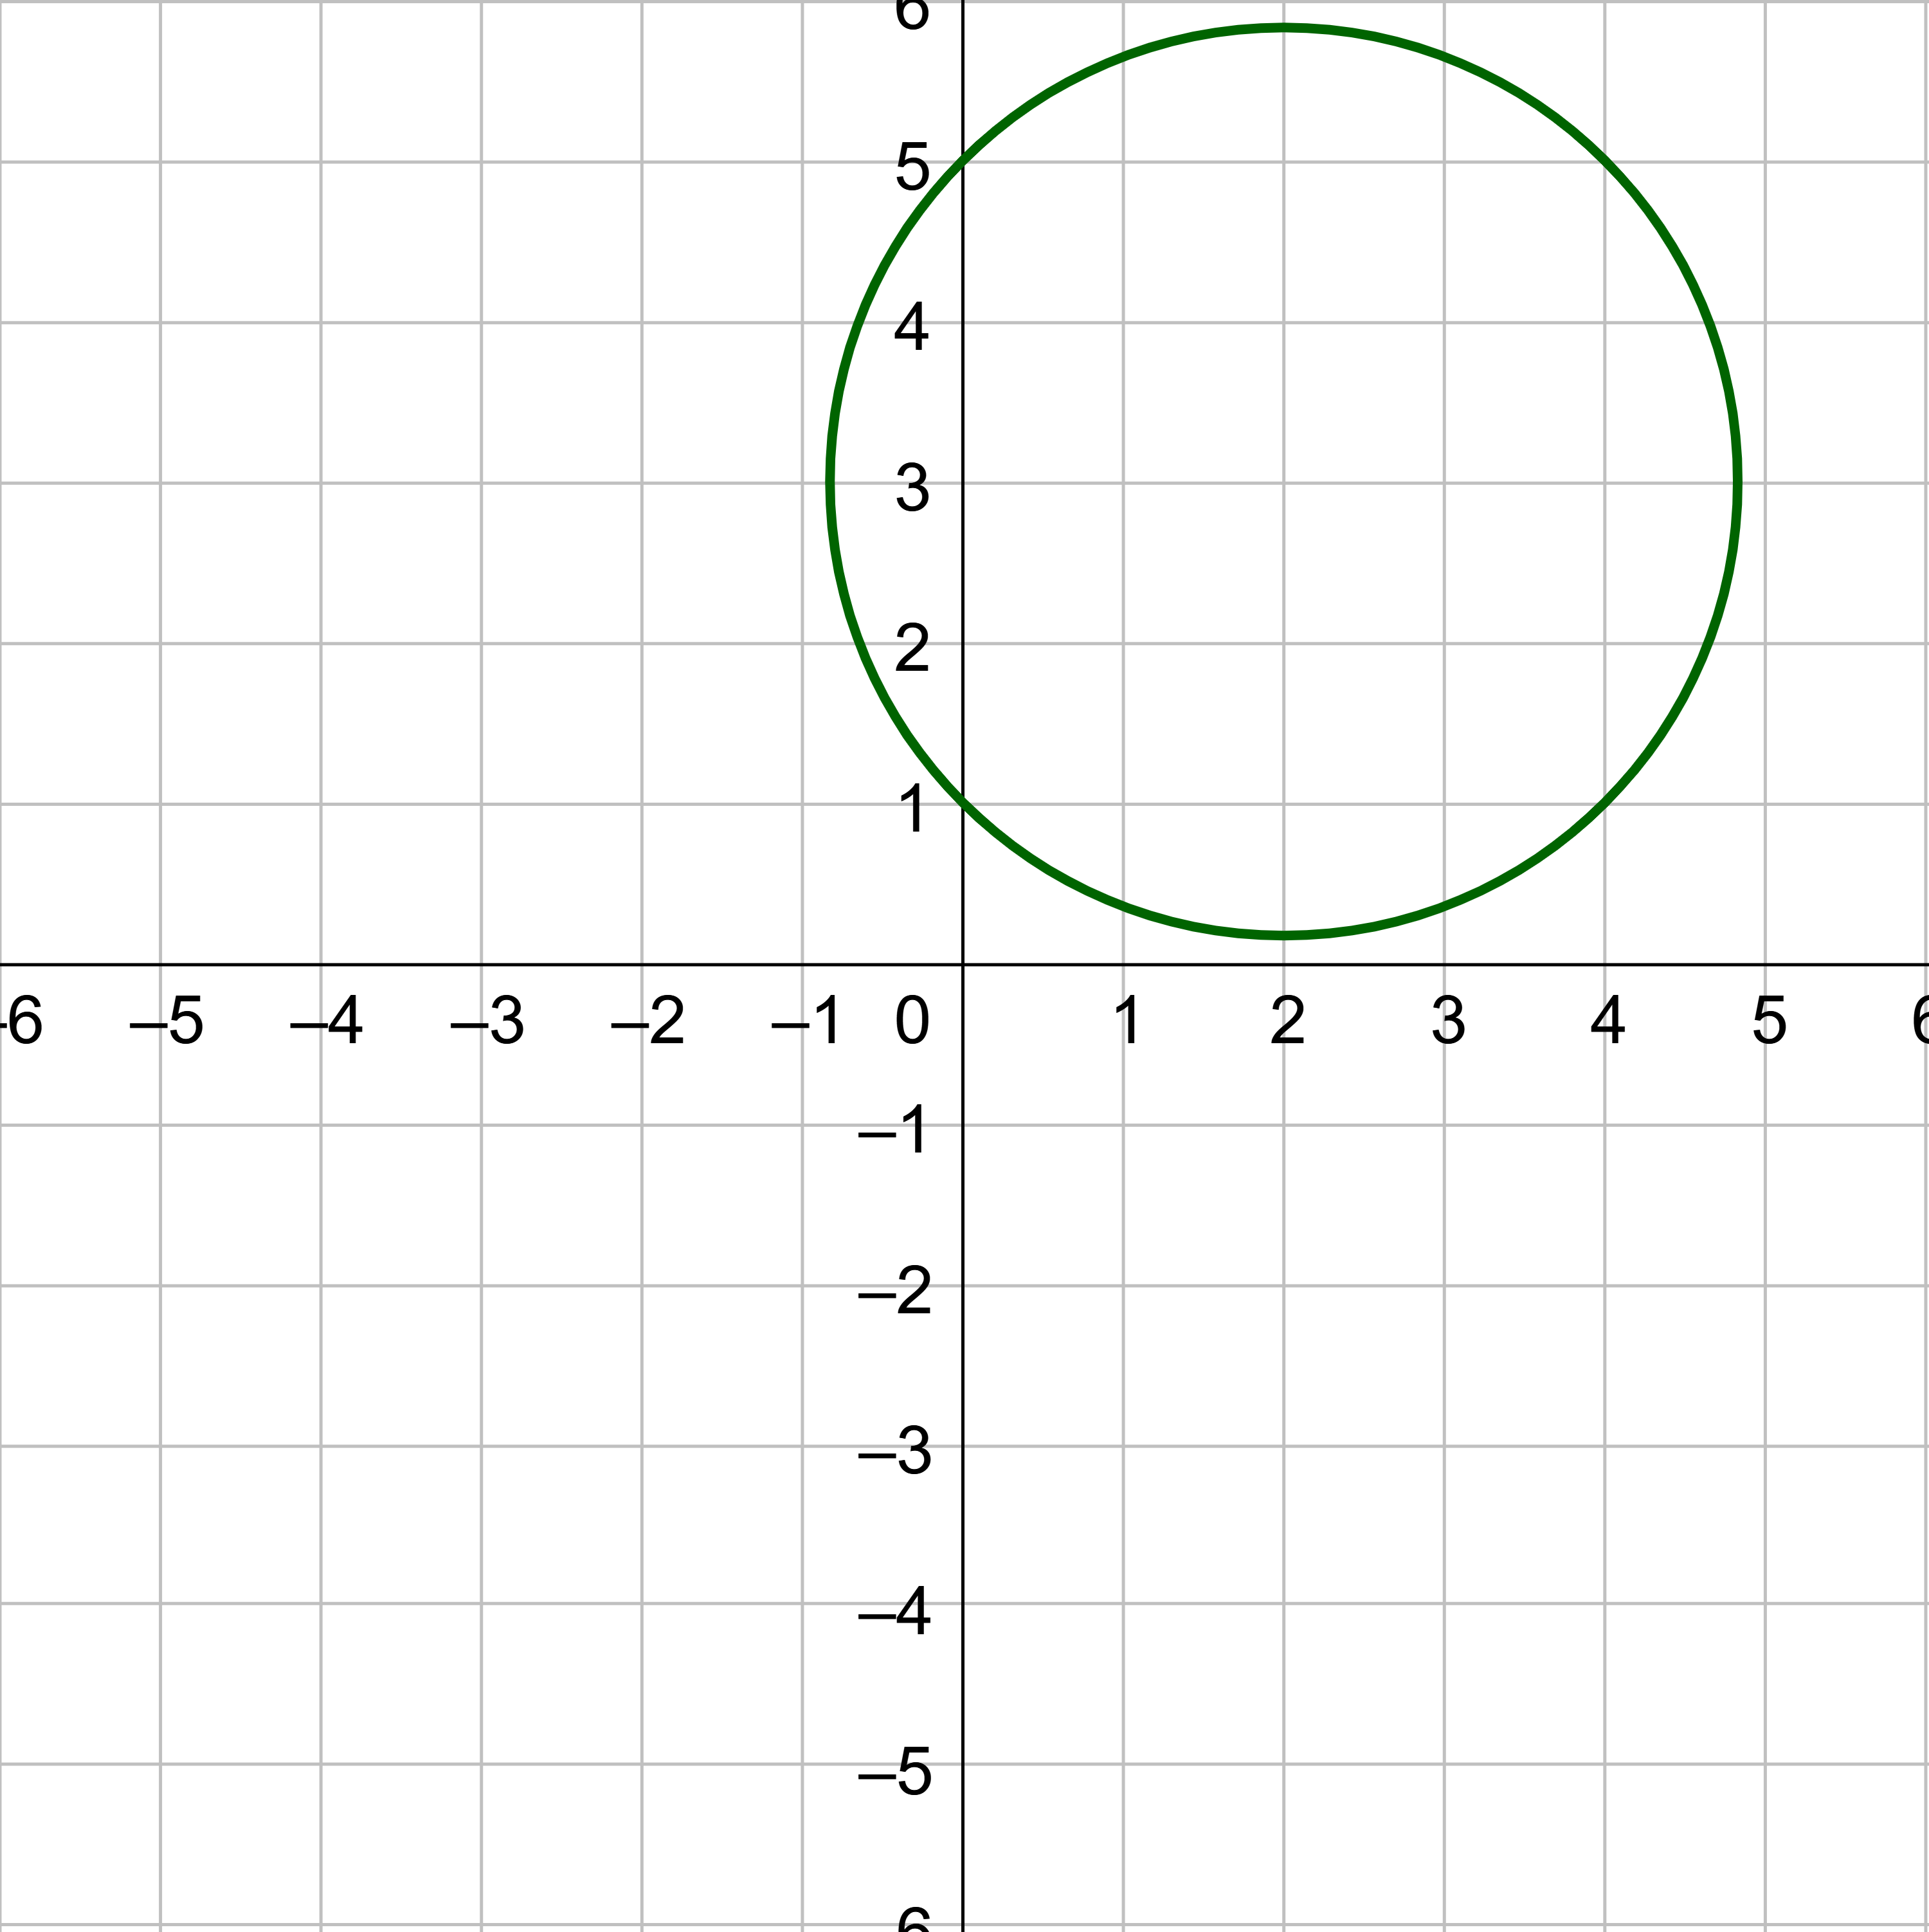
(1-02) Find the (a) radius and (b) equation of the circle with center (2, 3) and point on the circle (4, 5). Then (c) graph the circle.
Answers
Linear;
Quadratic;
Square root;
Reciprocal;
Absolute value;
Cubic
Reciprocal squared
Absolute Value
Square Root
420, 560, 770, 980; \(W(h) = \left\{\begin{align} 14h &, \text{ if } 0 < h ≤ 35 \\ 21(h - 35) + 490 &, \text { if } h > 35\end{align}\right.\)