Precalculus by Richard Wright
Has this helped you?
This book is available
in print and ebook.

Precalculus by Richard Wright
Has this helped you?
This book is available
in print and ebook.
Now faith is confidence in what we hope for and assurance about what we do not see. Hebrews 11:1 NIV
Summary: In this section, you will:
SDA NAD Content Standards (2018): PC.5.3
On the way home, Pedro needs to get gas for his car. The price of the gas is $2.75 and the car holds 12 gallons of gas. The total price is a function of the number of gallons pumped into the car. The function modeling this is P = 2.75g. Remember that the domain is the input of the function which is the number of gallons pumped into the car, so the domain of this function is 0 to 12 gallons, or [0, 12]. The range is the output of the function or the total price which is $0 when 0 gallons are pumped to $33 when 12 gallons are pumped, or [0, 33]. Thus when Pedro arrives at the pump, he should have $33 dollars because the total price of his gas will be that or less.
The last lesson covered how to find domain from a function's equations. This lesson will cover how to find domain and range from a graph. The domain is the set of all input values, and on a graph, those are the x-values for which the function is graphed. The range is the set of all the output values, and on a graph, those are the y-values for which the function is graphed. Remember that the graph continues beyond the visible portion of the graph, so the domain and range may be larger than what can be seen.
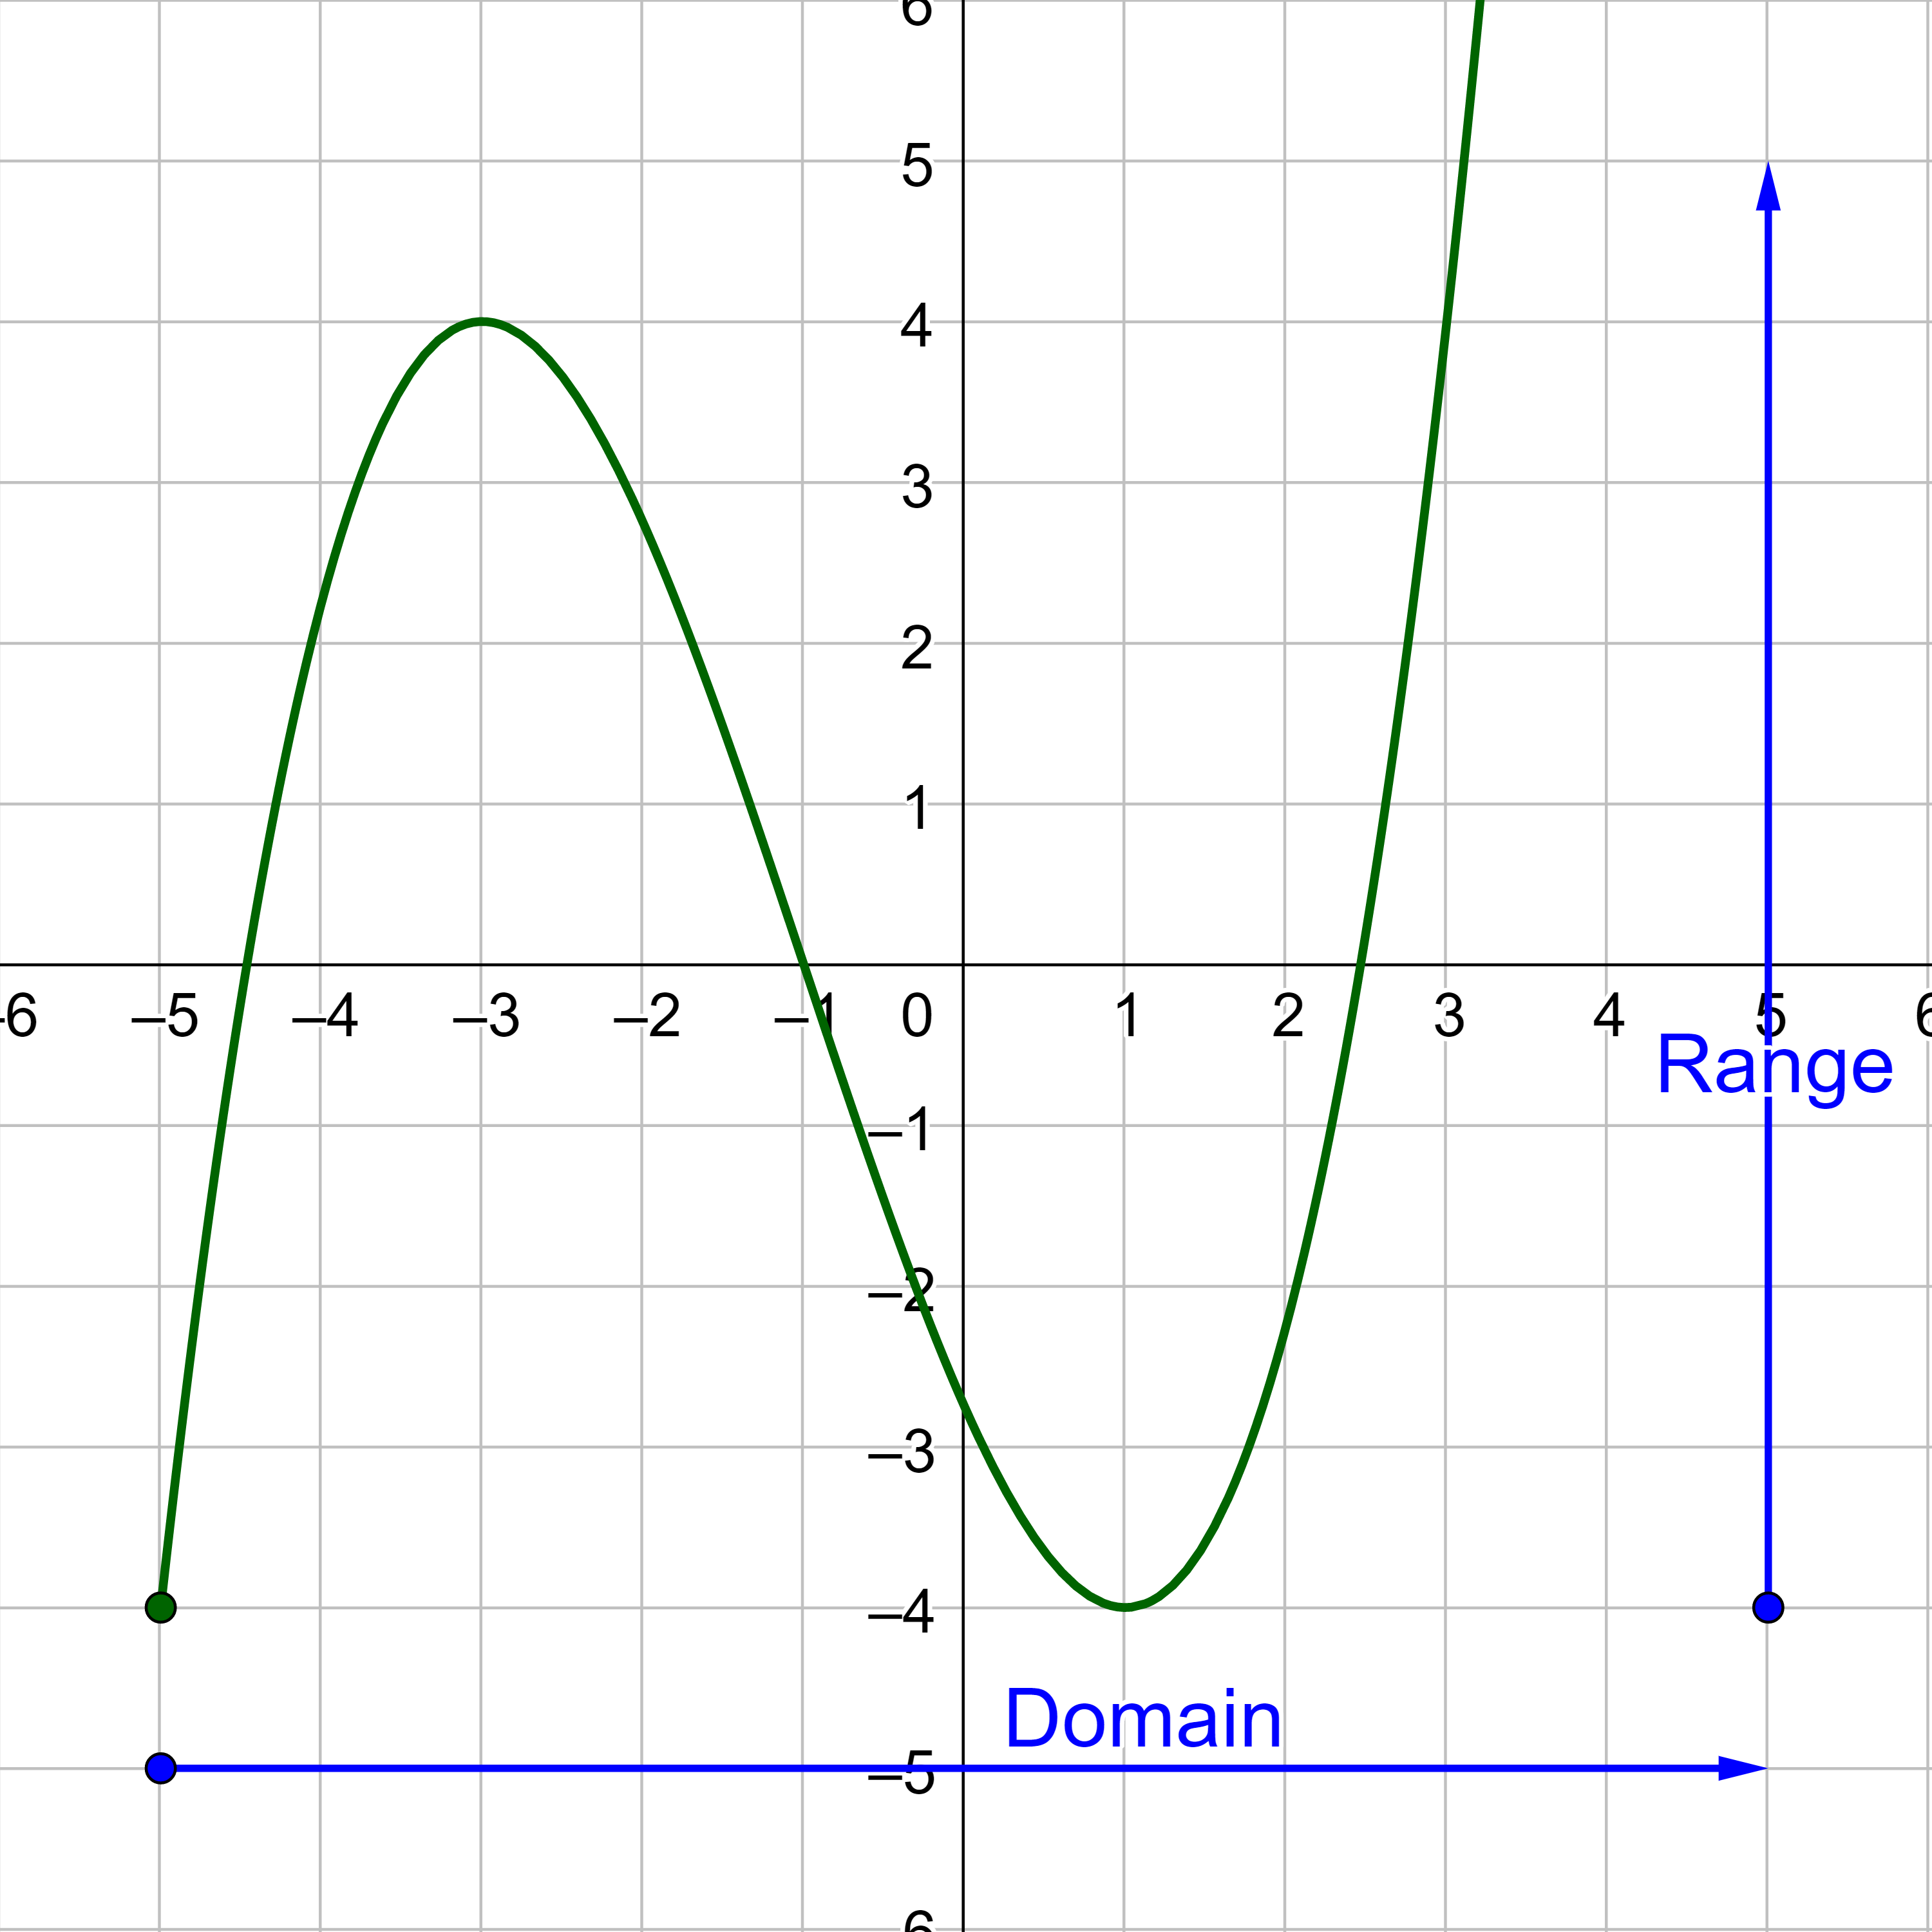
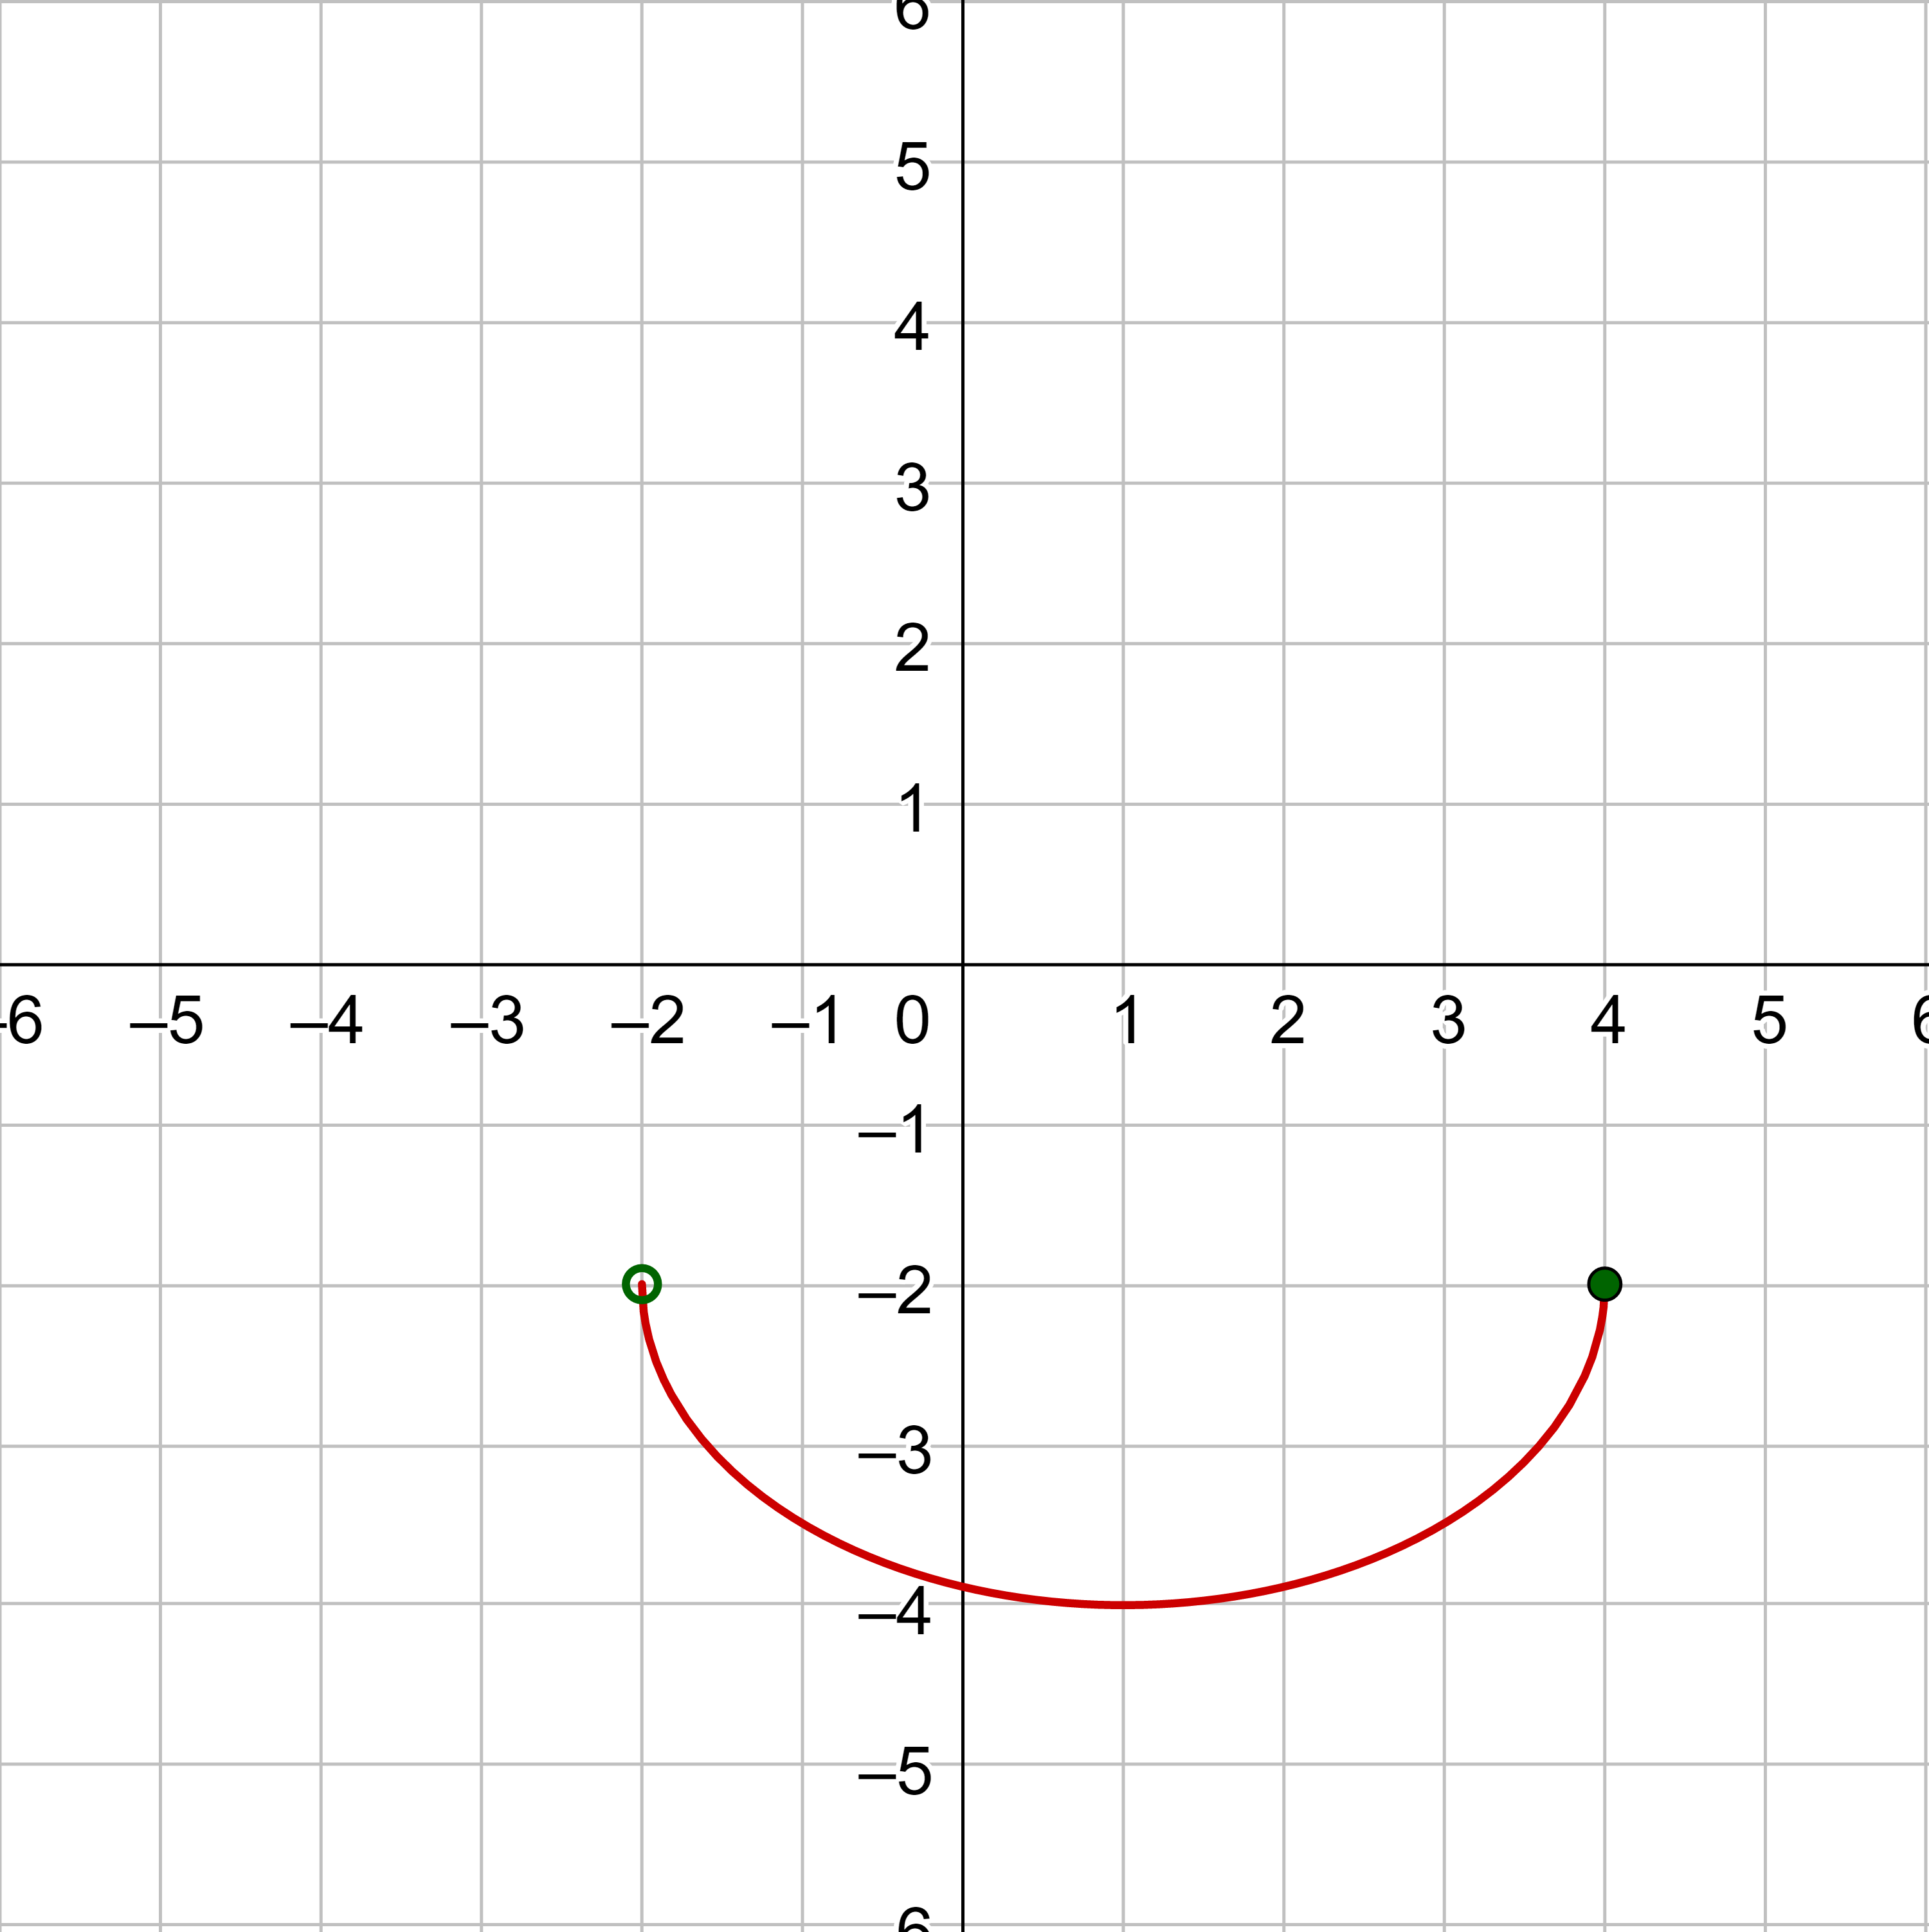
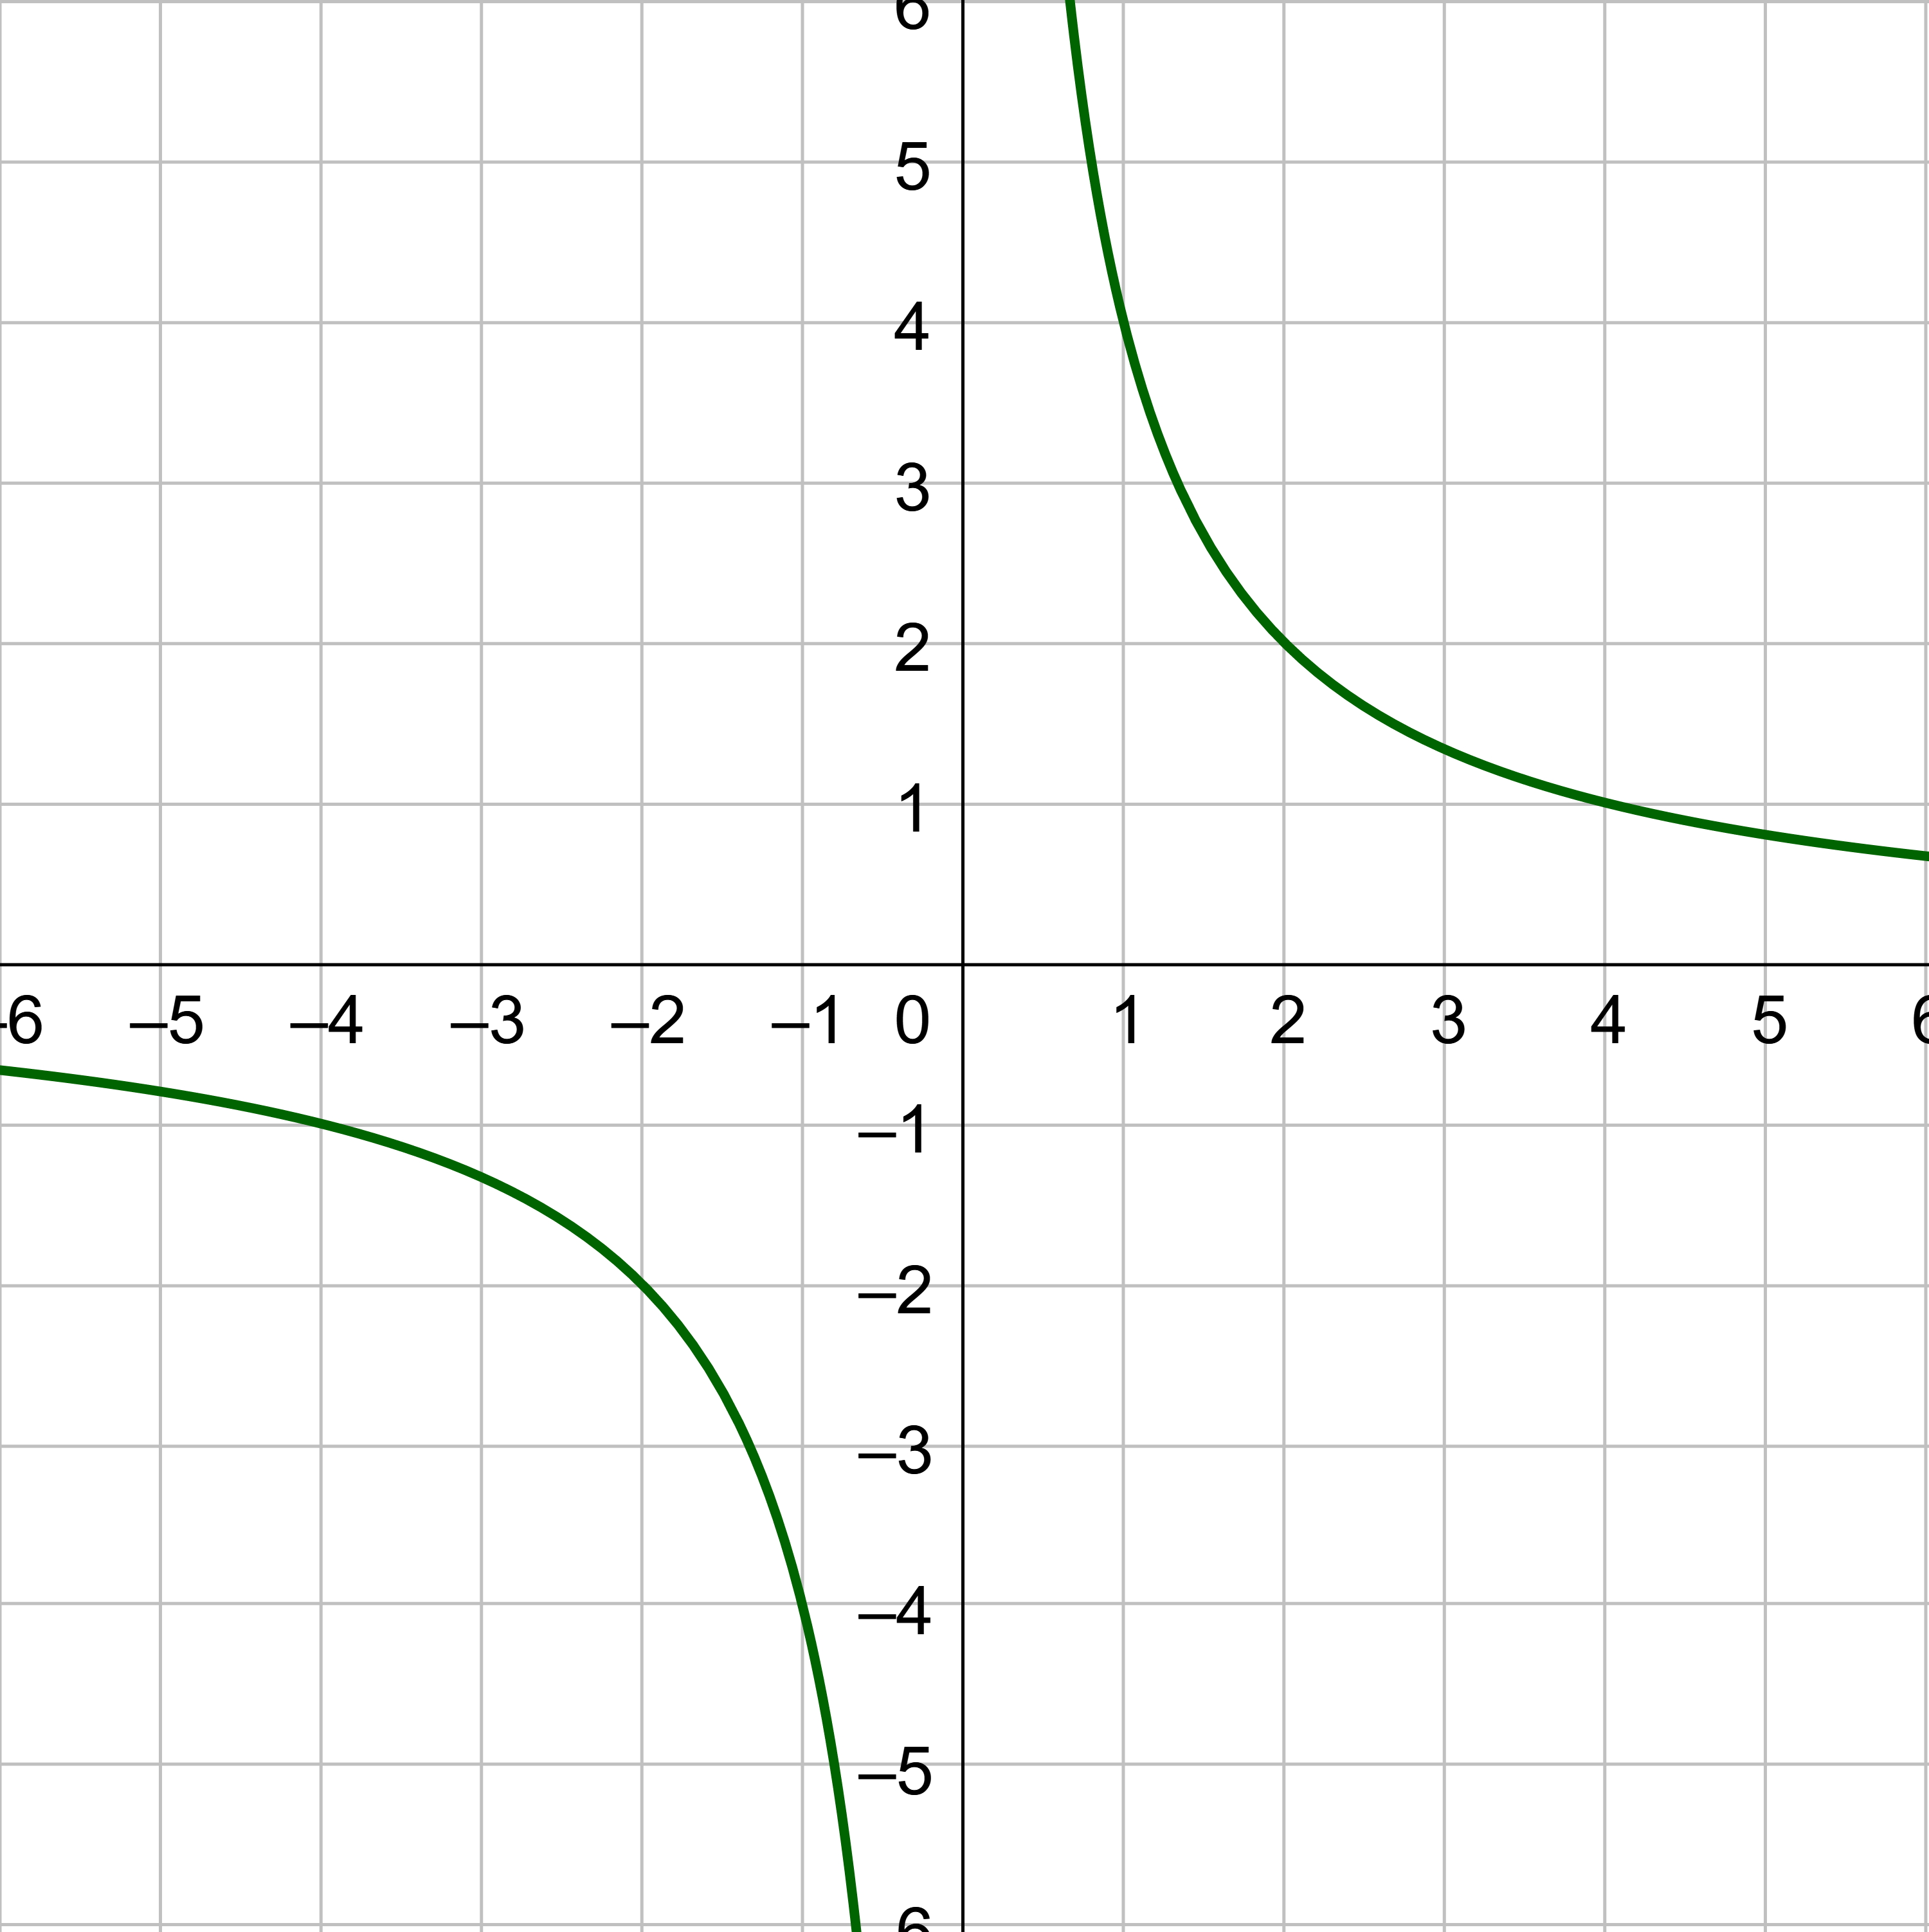
The graph extends horizontally in the x from −5 to the right and extends beyond the edge of the graph, so the domain is [−5, ∞). Also, the graph extends vertically in the y from −4 and up and extends beyond the edge of the graph, so the range is [−4, ∞). The domain is the horizontal extent of the graph, and the range is the vertical extent.
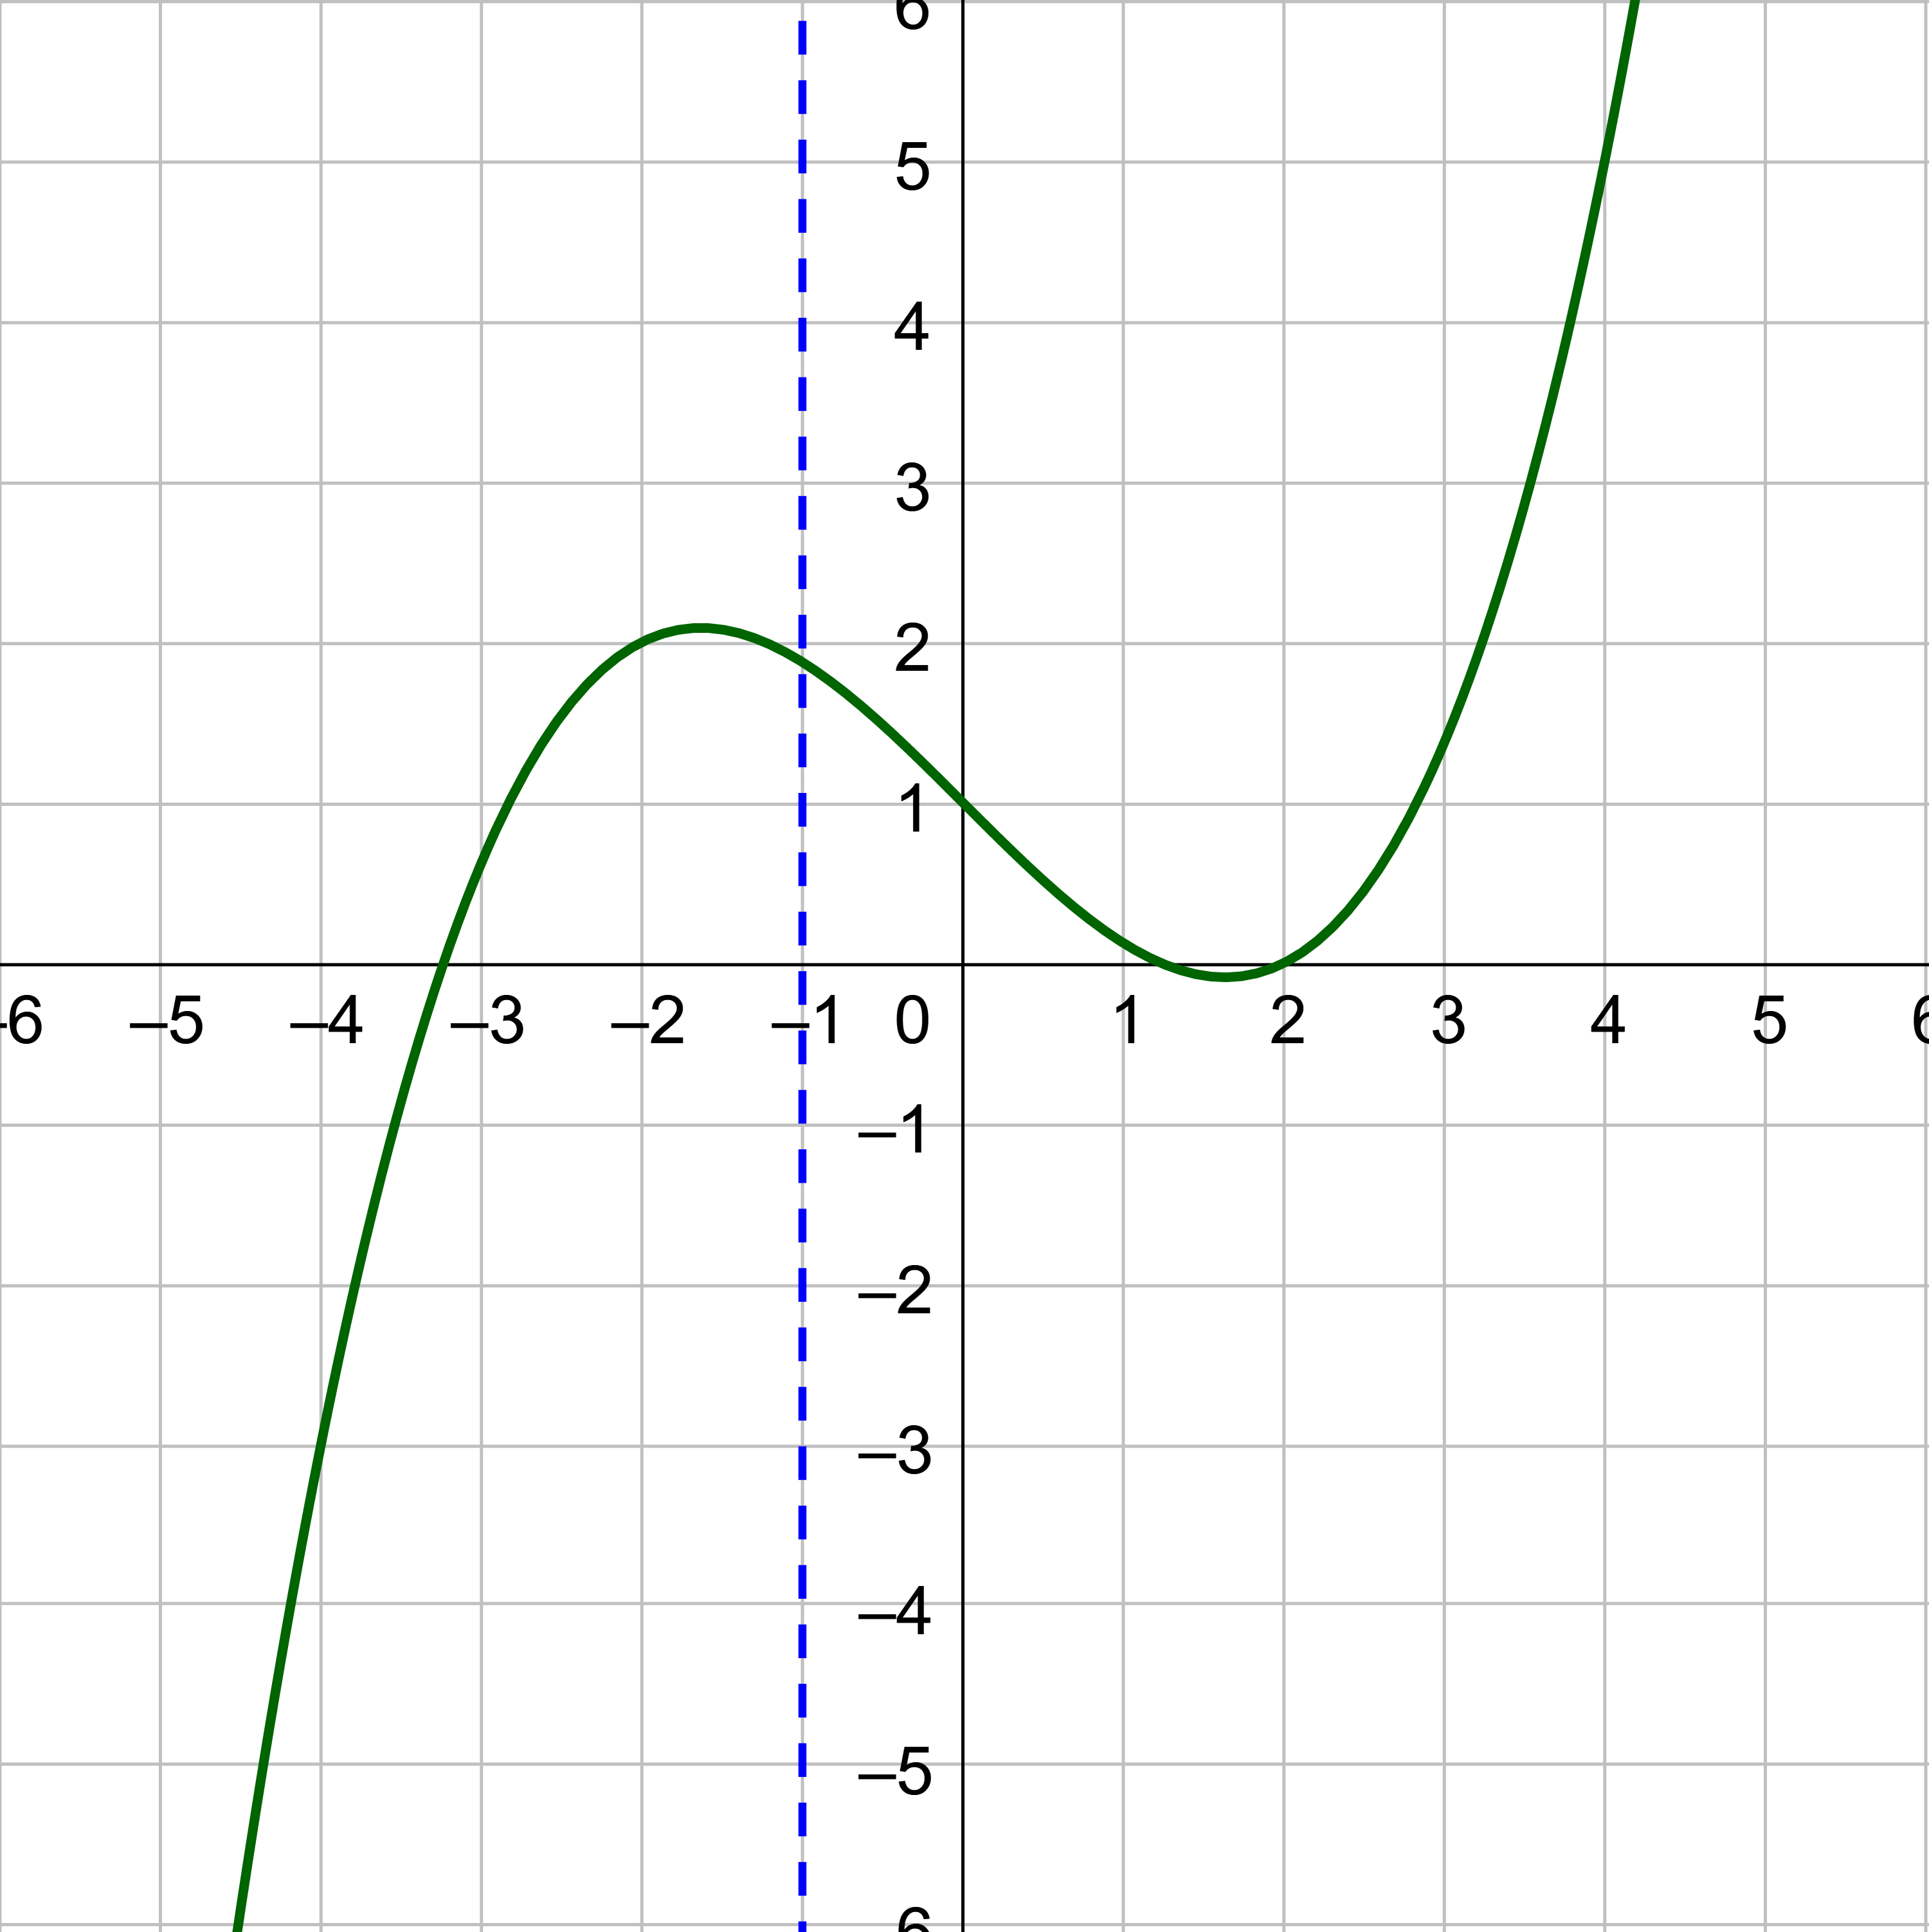
Find the domain and range of the function in the graph below.
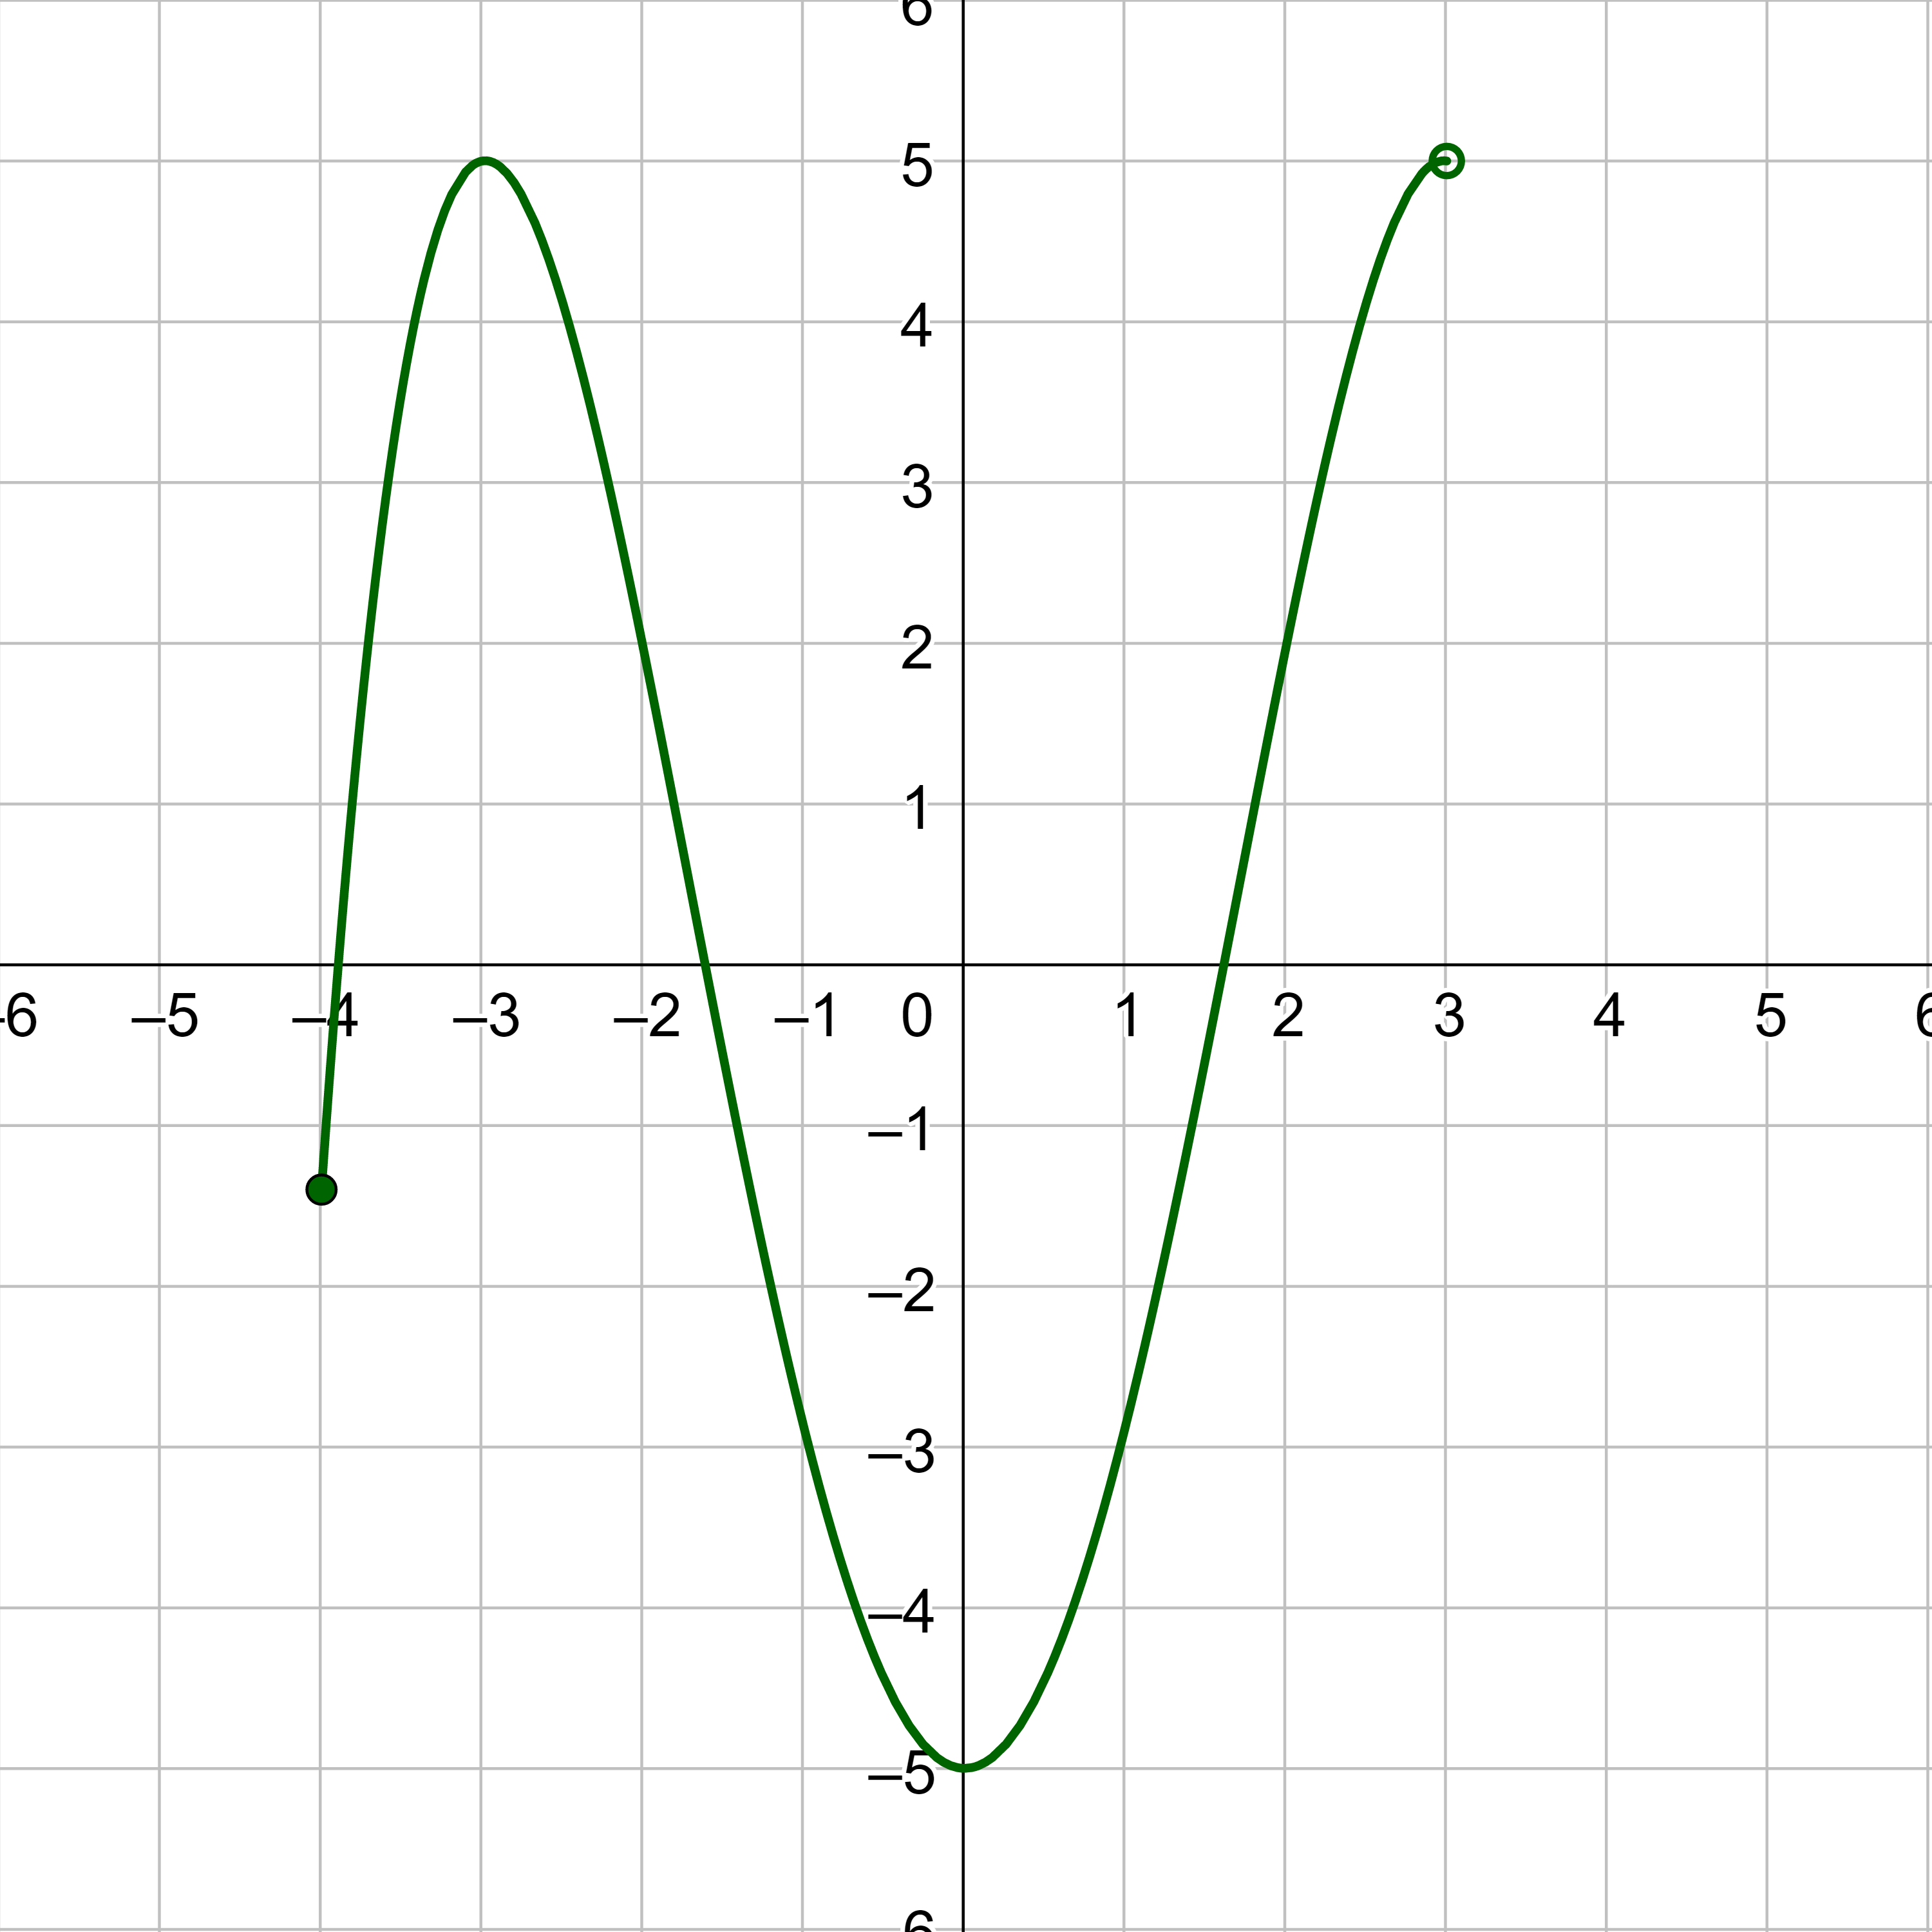
Solution
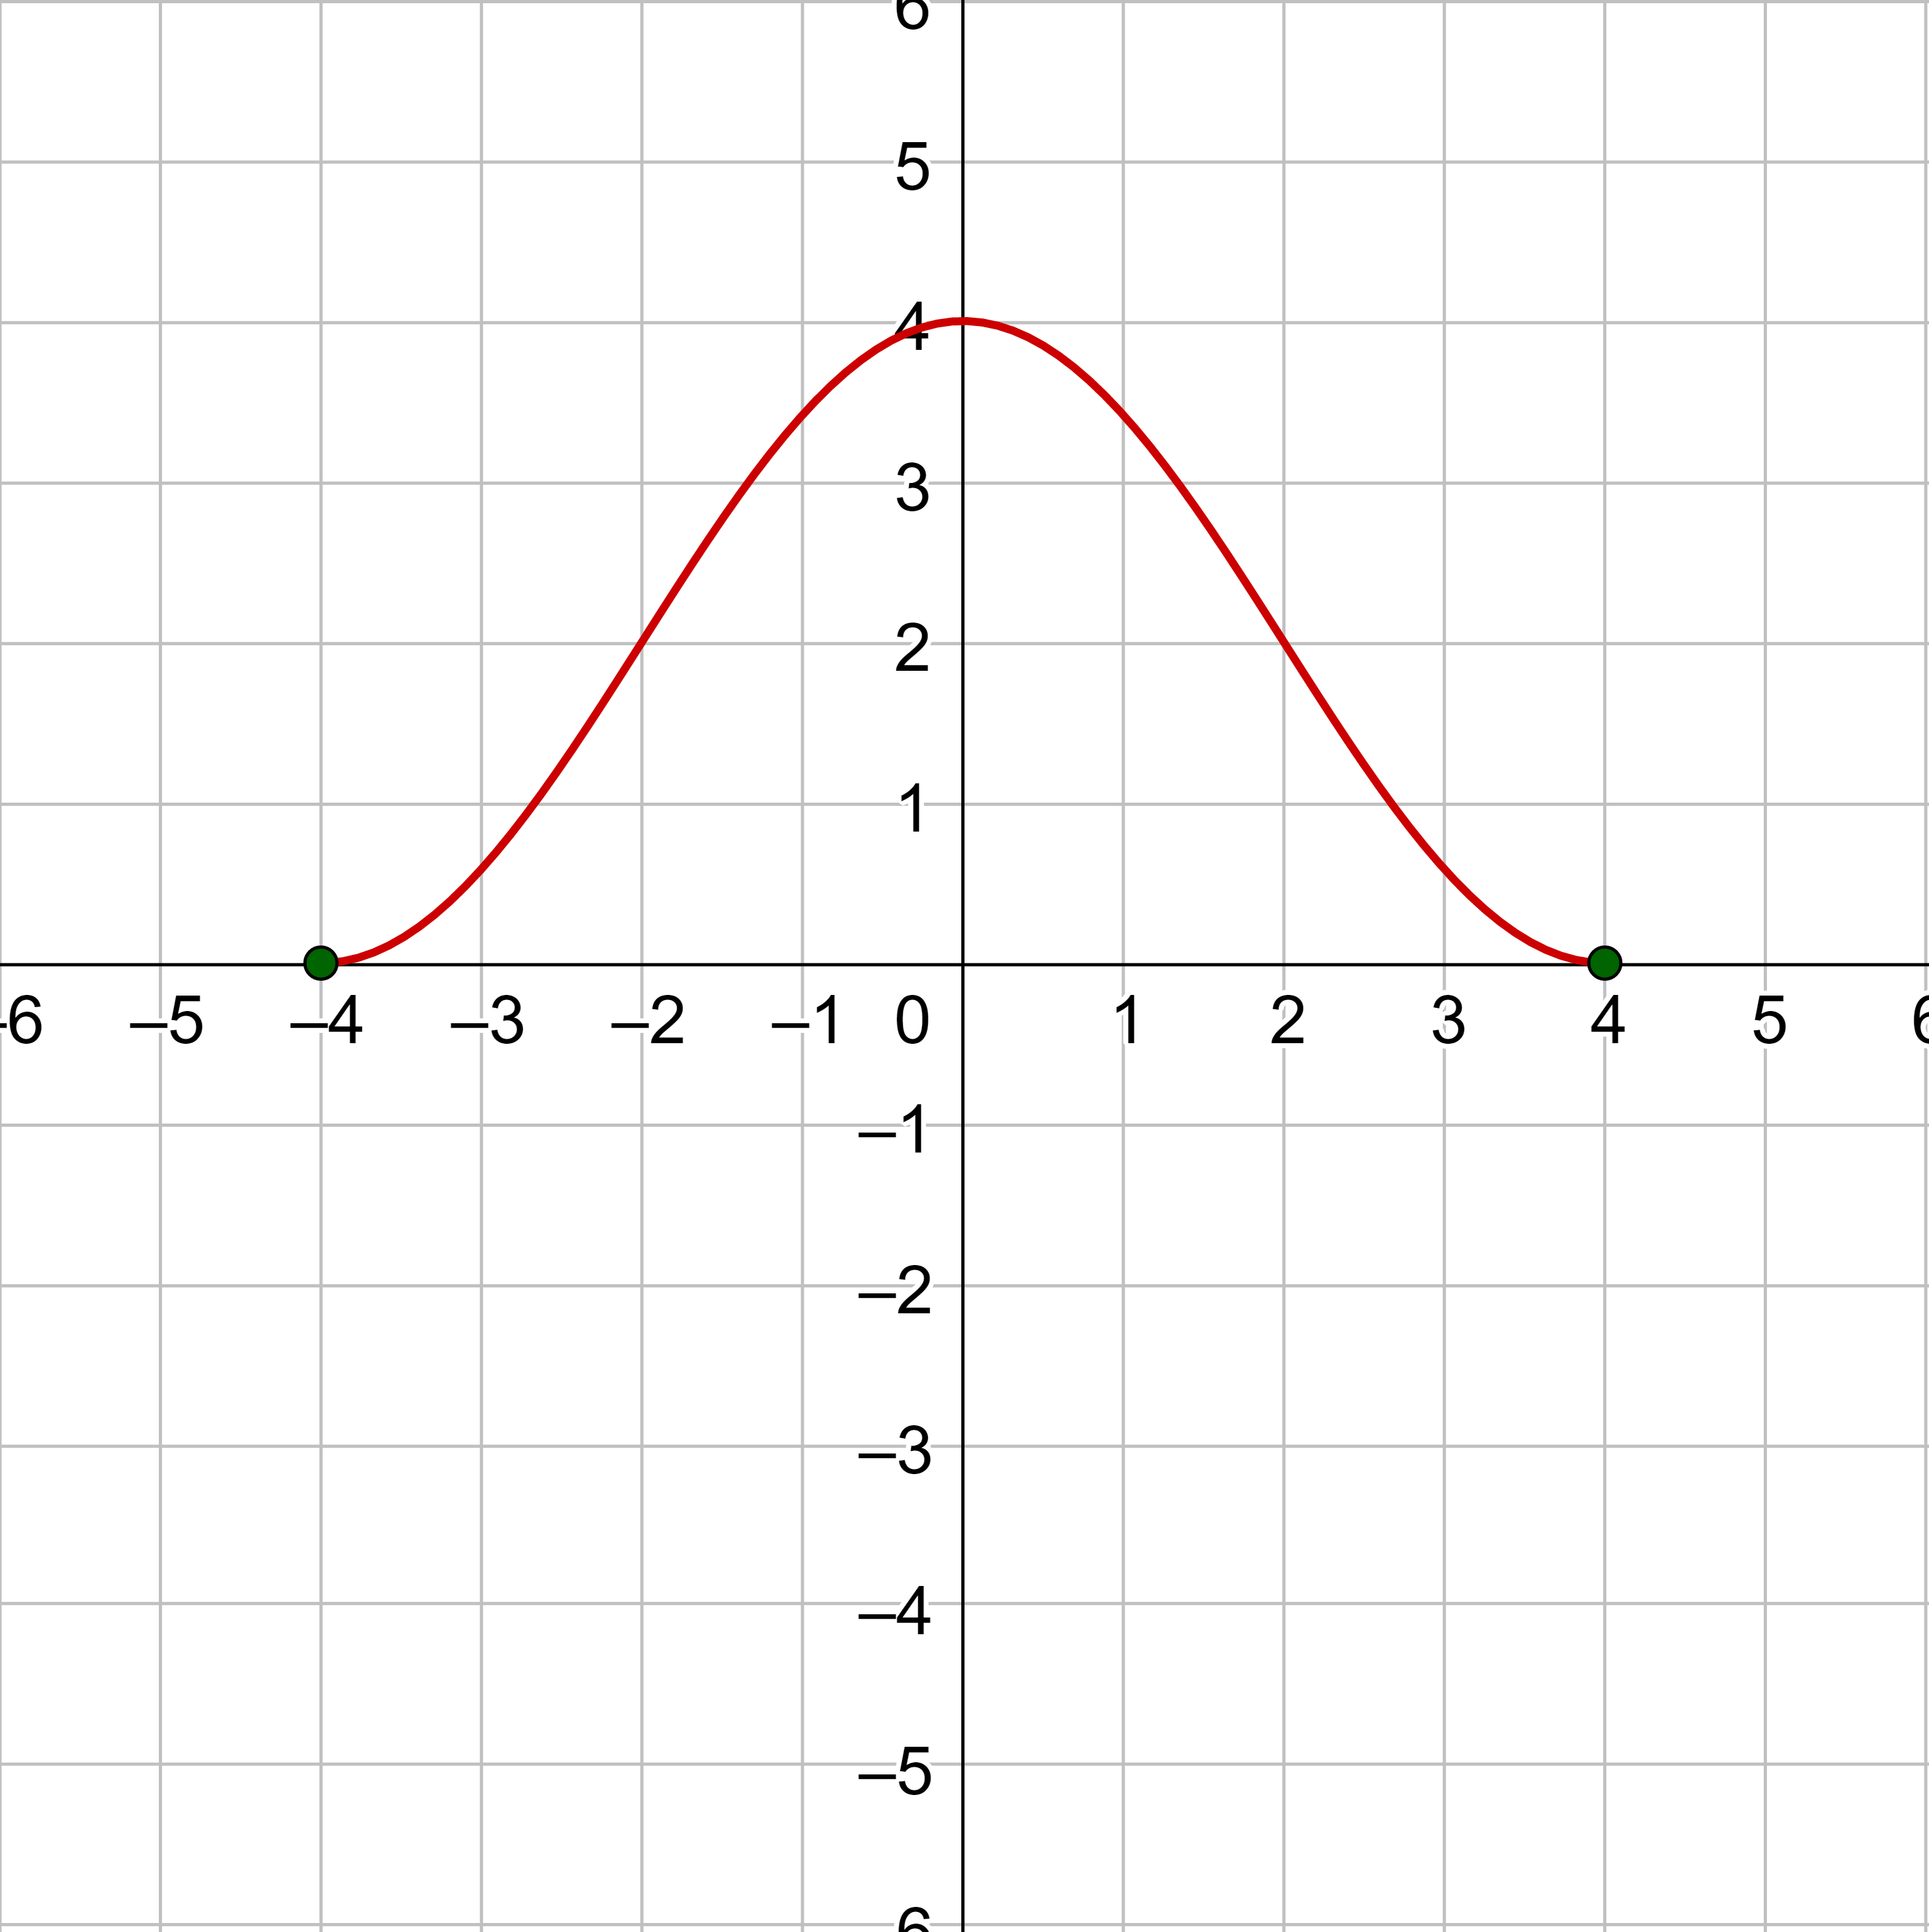
The horizontal extent of the graph is from x = −4 to x = 3. Because the right end of the function is an open dot, it does not include the point at x = 3. So the domain is [−4, 3).
The vertical extent of the graph is from y = −5 to y = 5. Because the left peak of the graph actually includes y = 5, it is included in the range even though it is not included in the right-hand point. The range is [−5, 5].

Find the domain and range of the function in the graph representing the size of the average house in the United States.
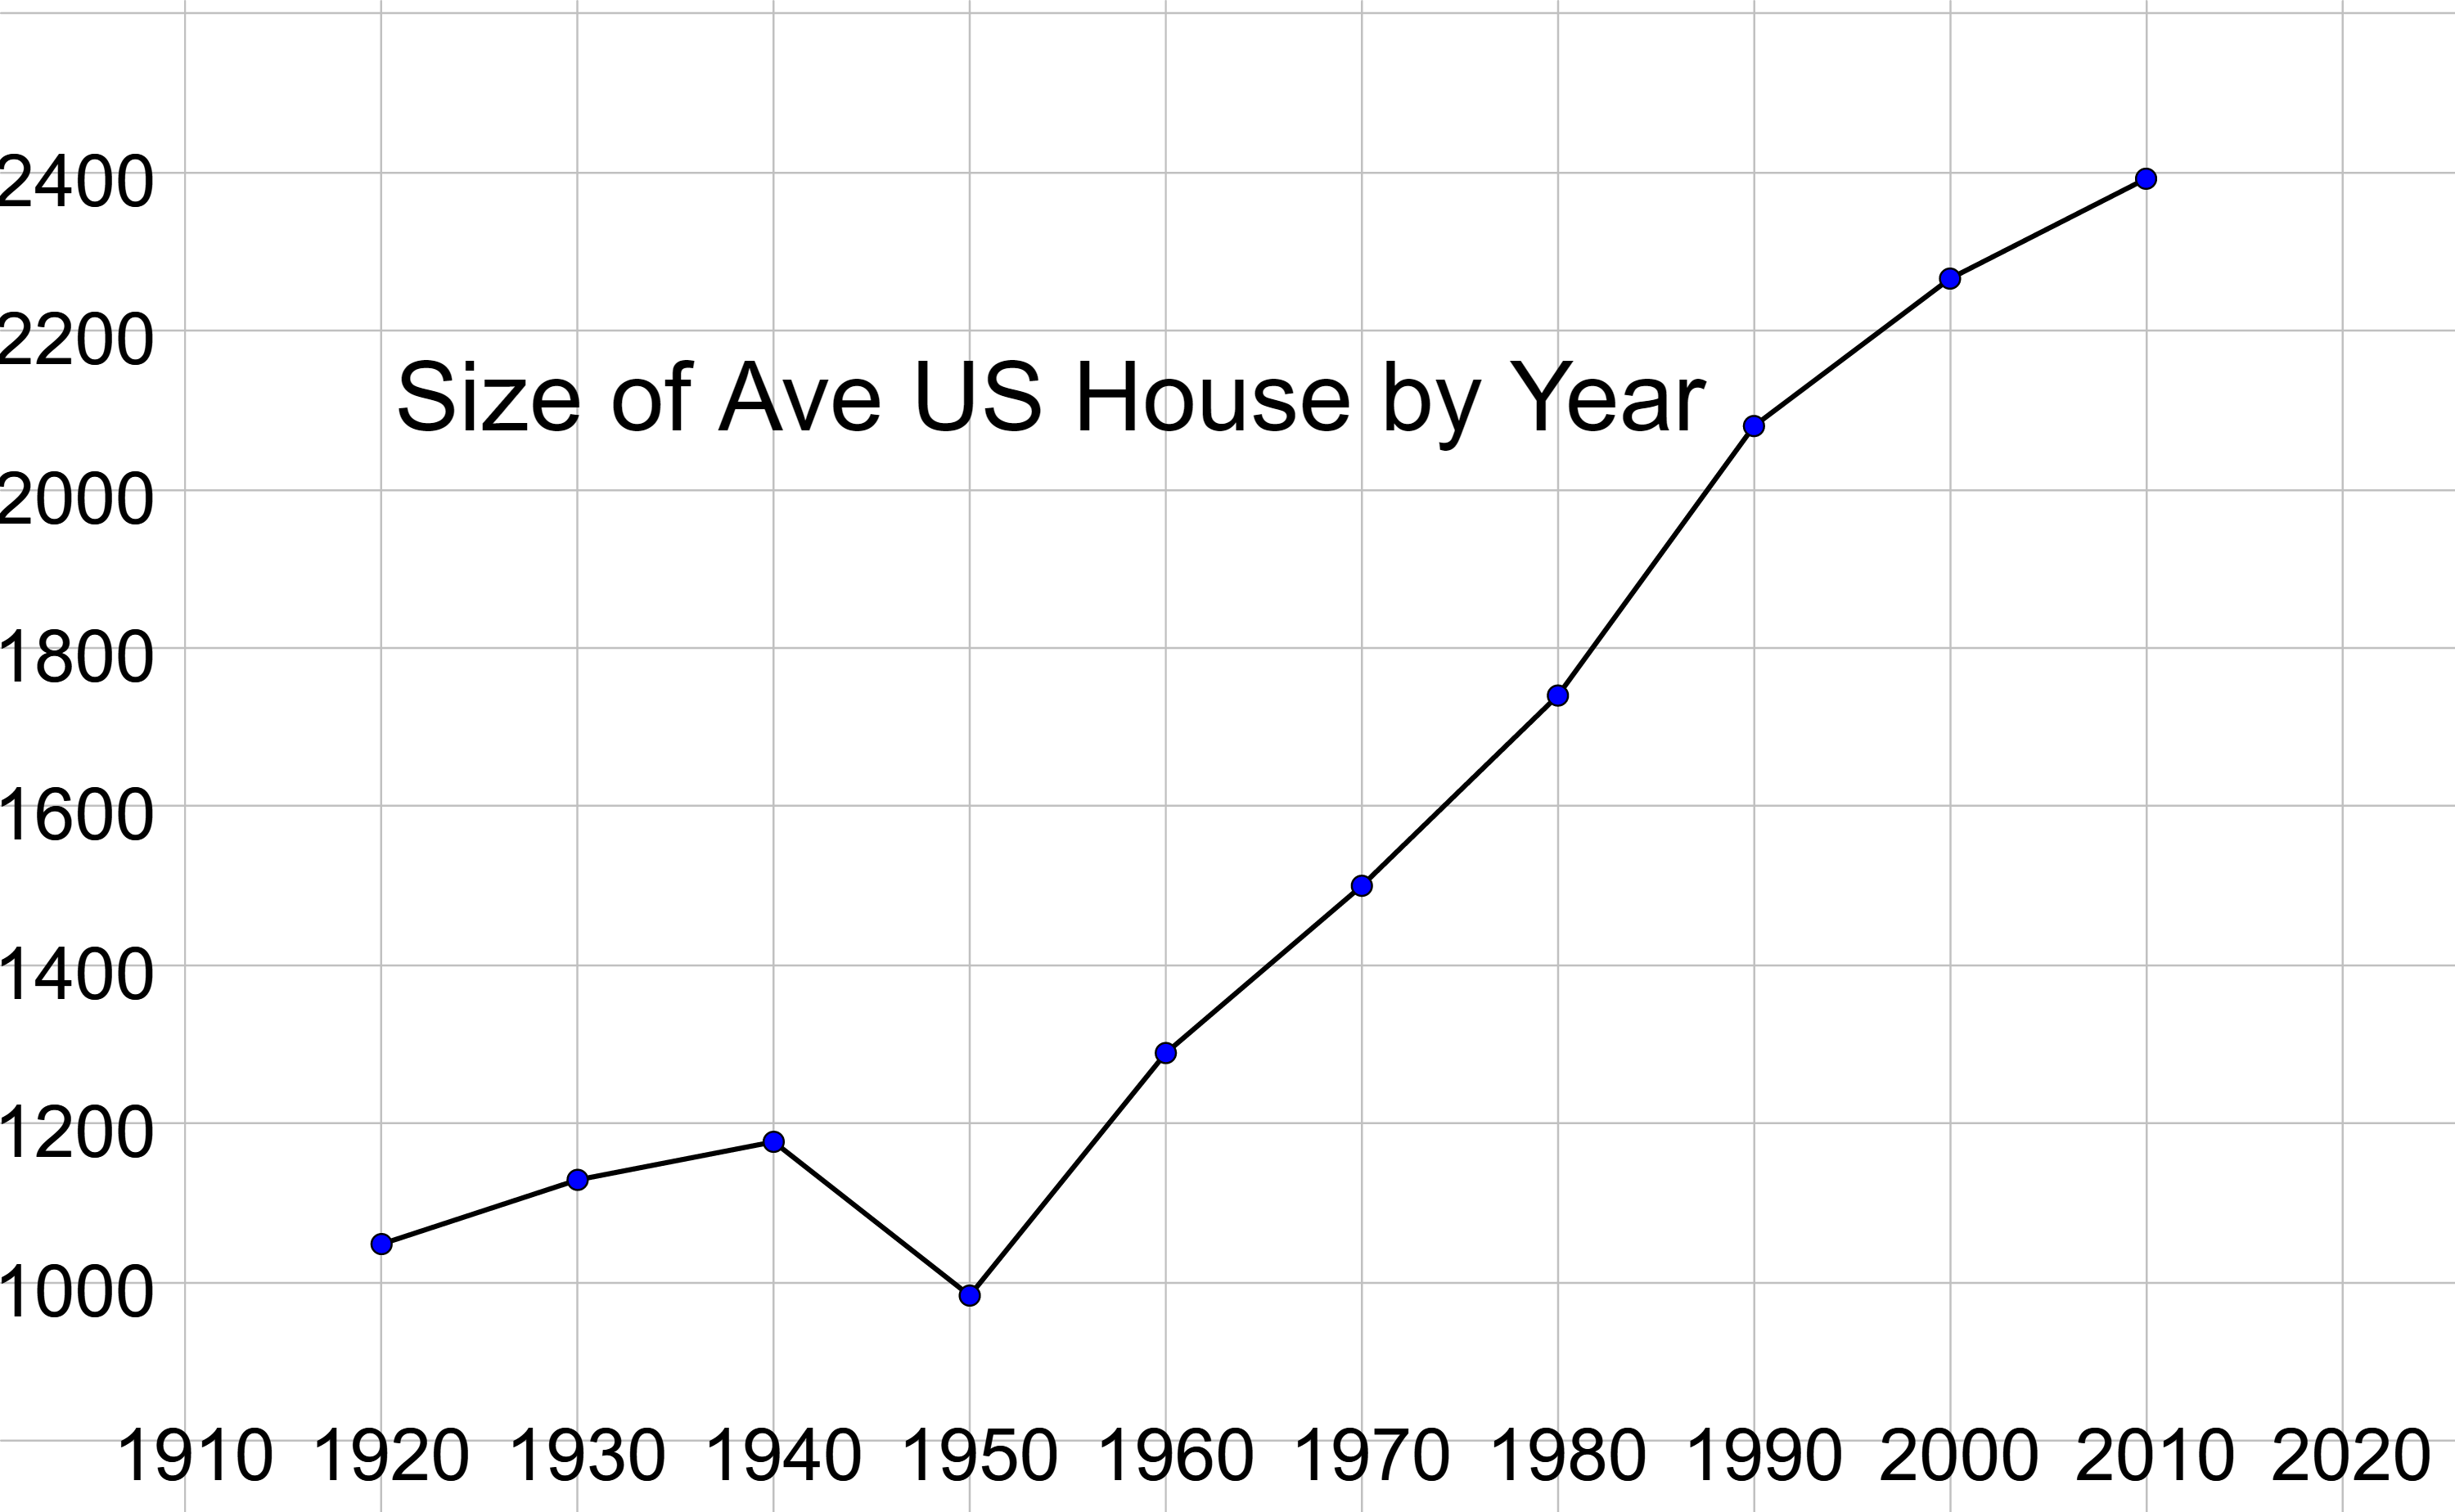
Solution
The horizontal extent of the graph is the years 1920 to 2010. The domain is [1920, 2010].
The vertical extent of the graph is the area of 983 ft2 to 2392 ft2. The range is [983, 2392].
Note that the range may need to be estimated because the points do not lie directly on a grid line.
Find the domain and range of the function in the graph below.
Answer
Domain: (−∞, 0) ∪ (0, ∞), Range: (-∞, 0) ∪ (0, ∞)
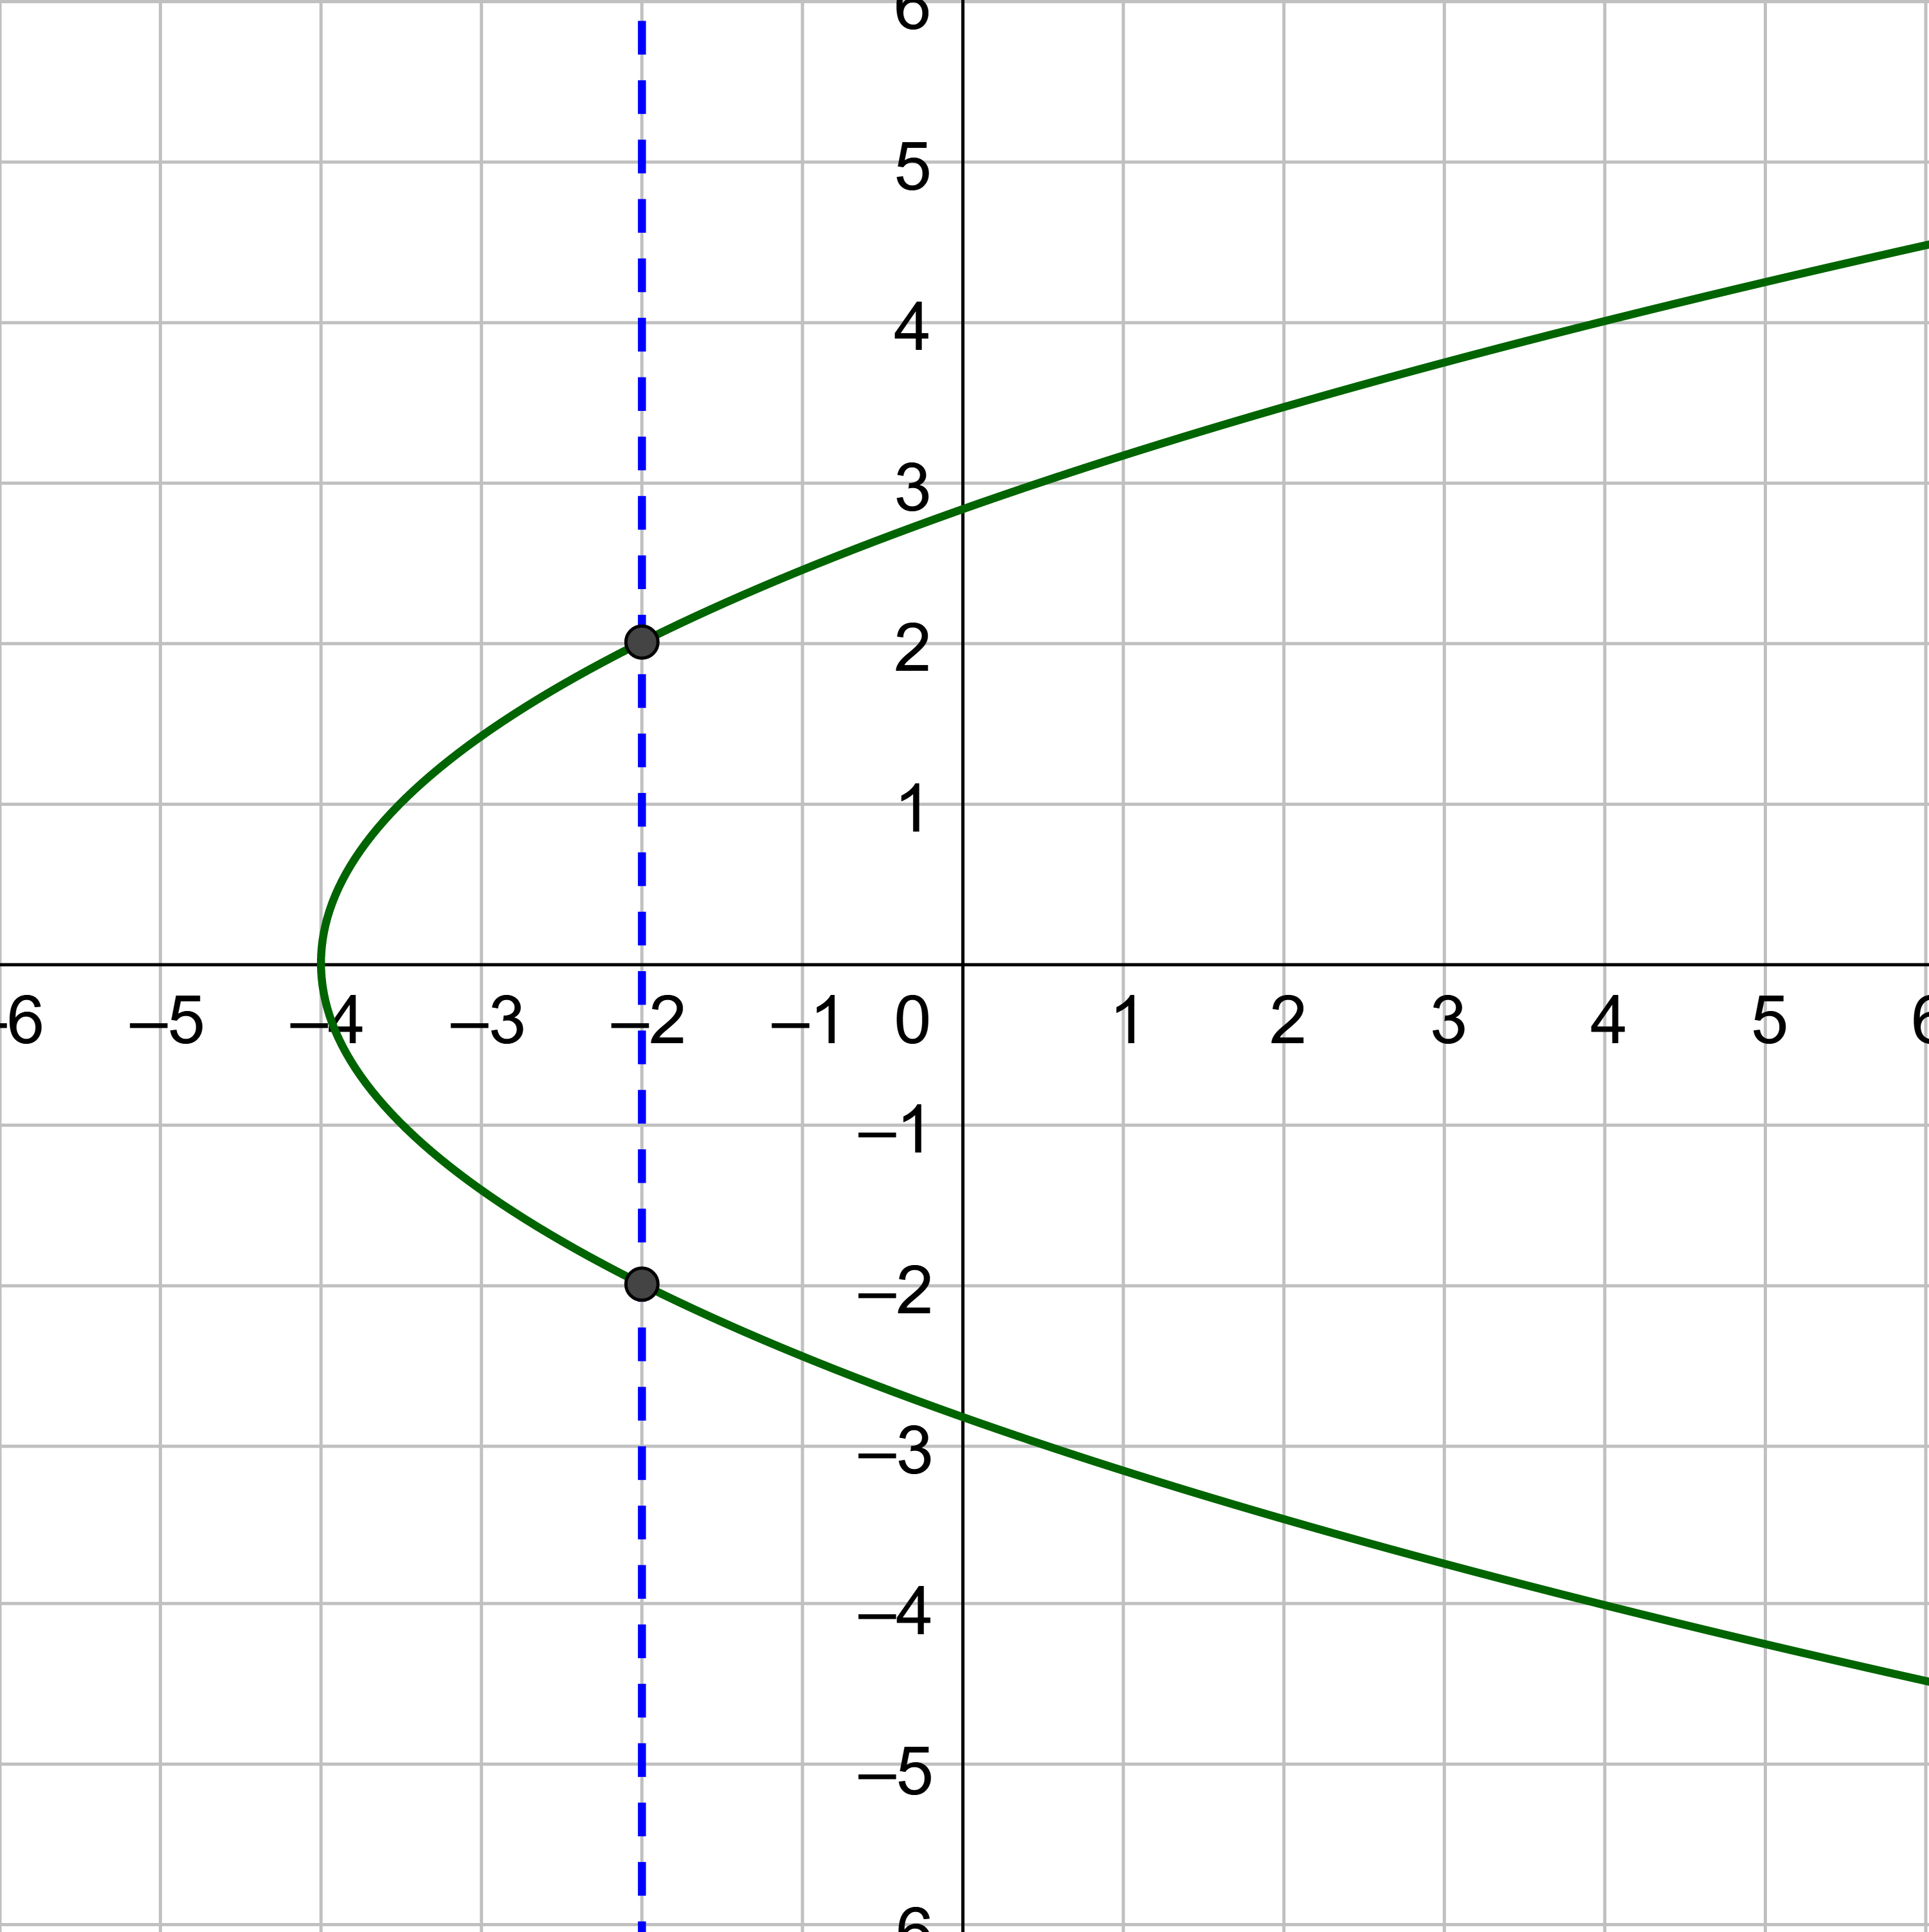
Remember last lesson talked about what relations are functions. A function is a relation where each input value is paired to exactly one output value. In other words, no input value can be paired with more than one output value. Graphically, that means that no x-value can have more than one y-value. If it did, then a vertical line through the x-value would contain more than one y-value of the graph.
The vertical line test is used to determine whether a graph represents a function. A graph represents a function if no vertical line can intersect a graph more than once.
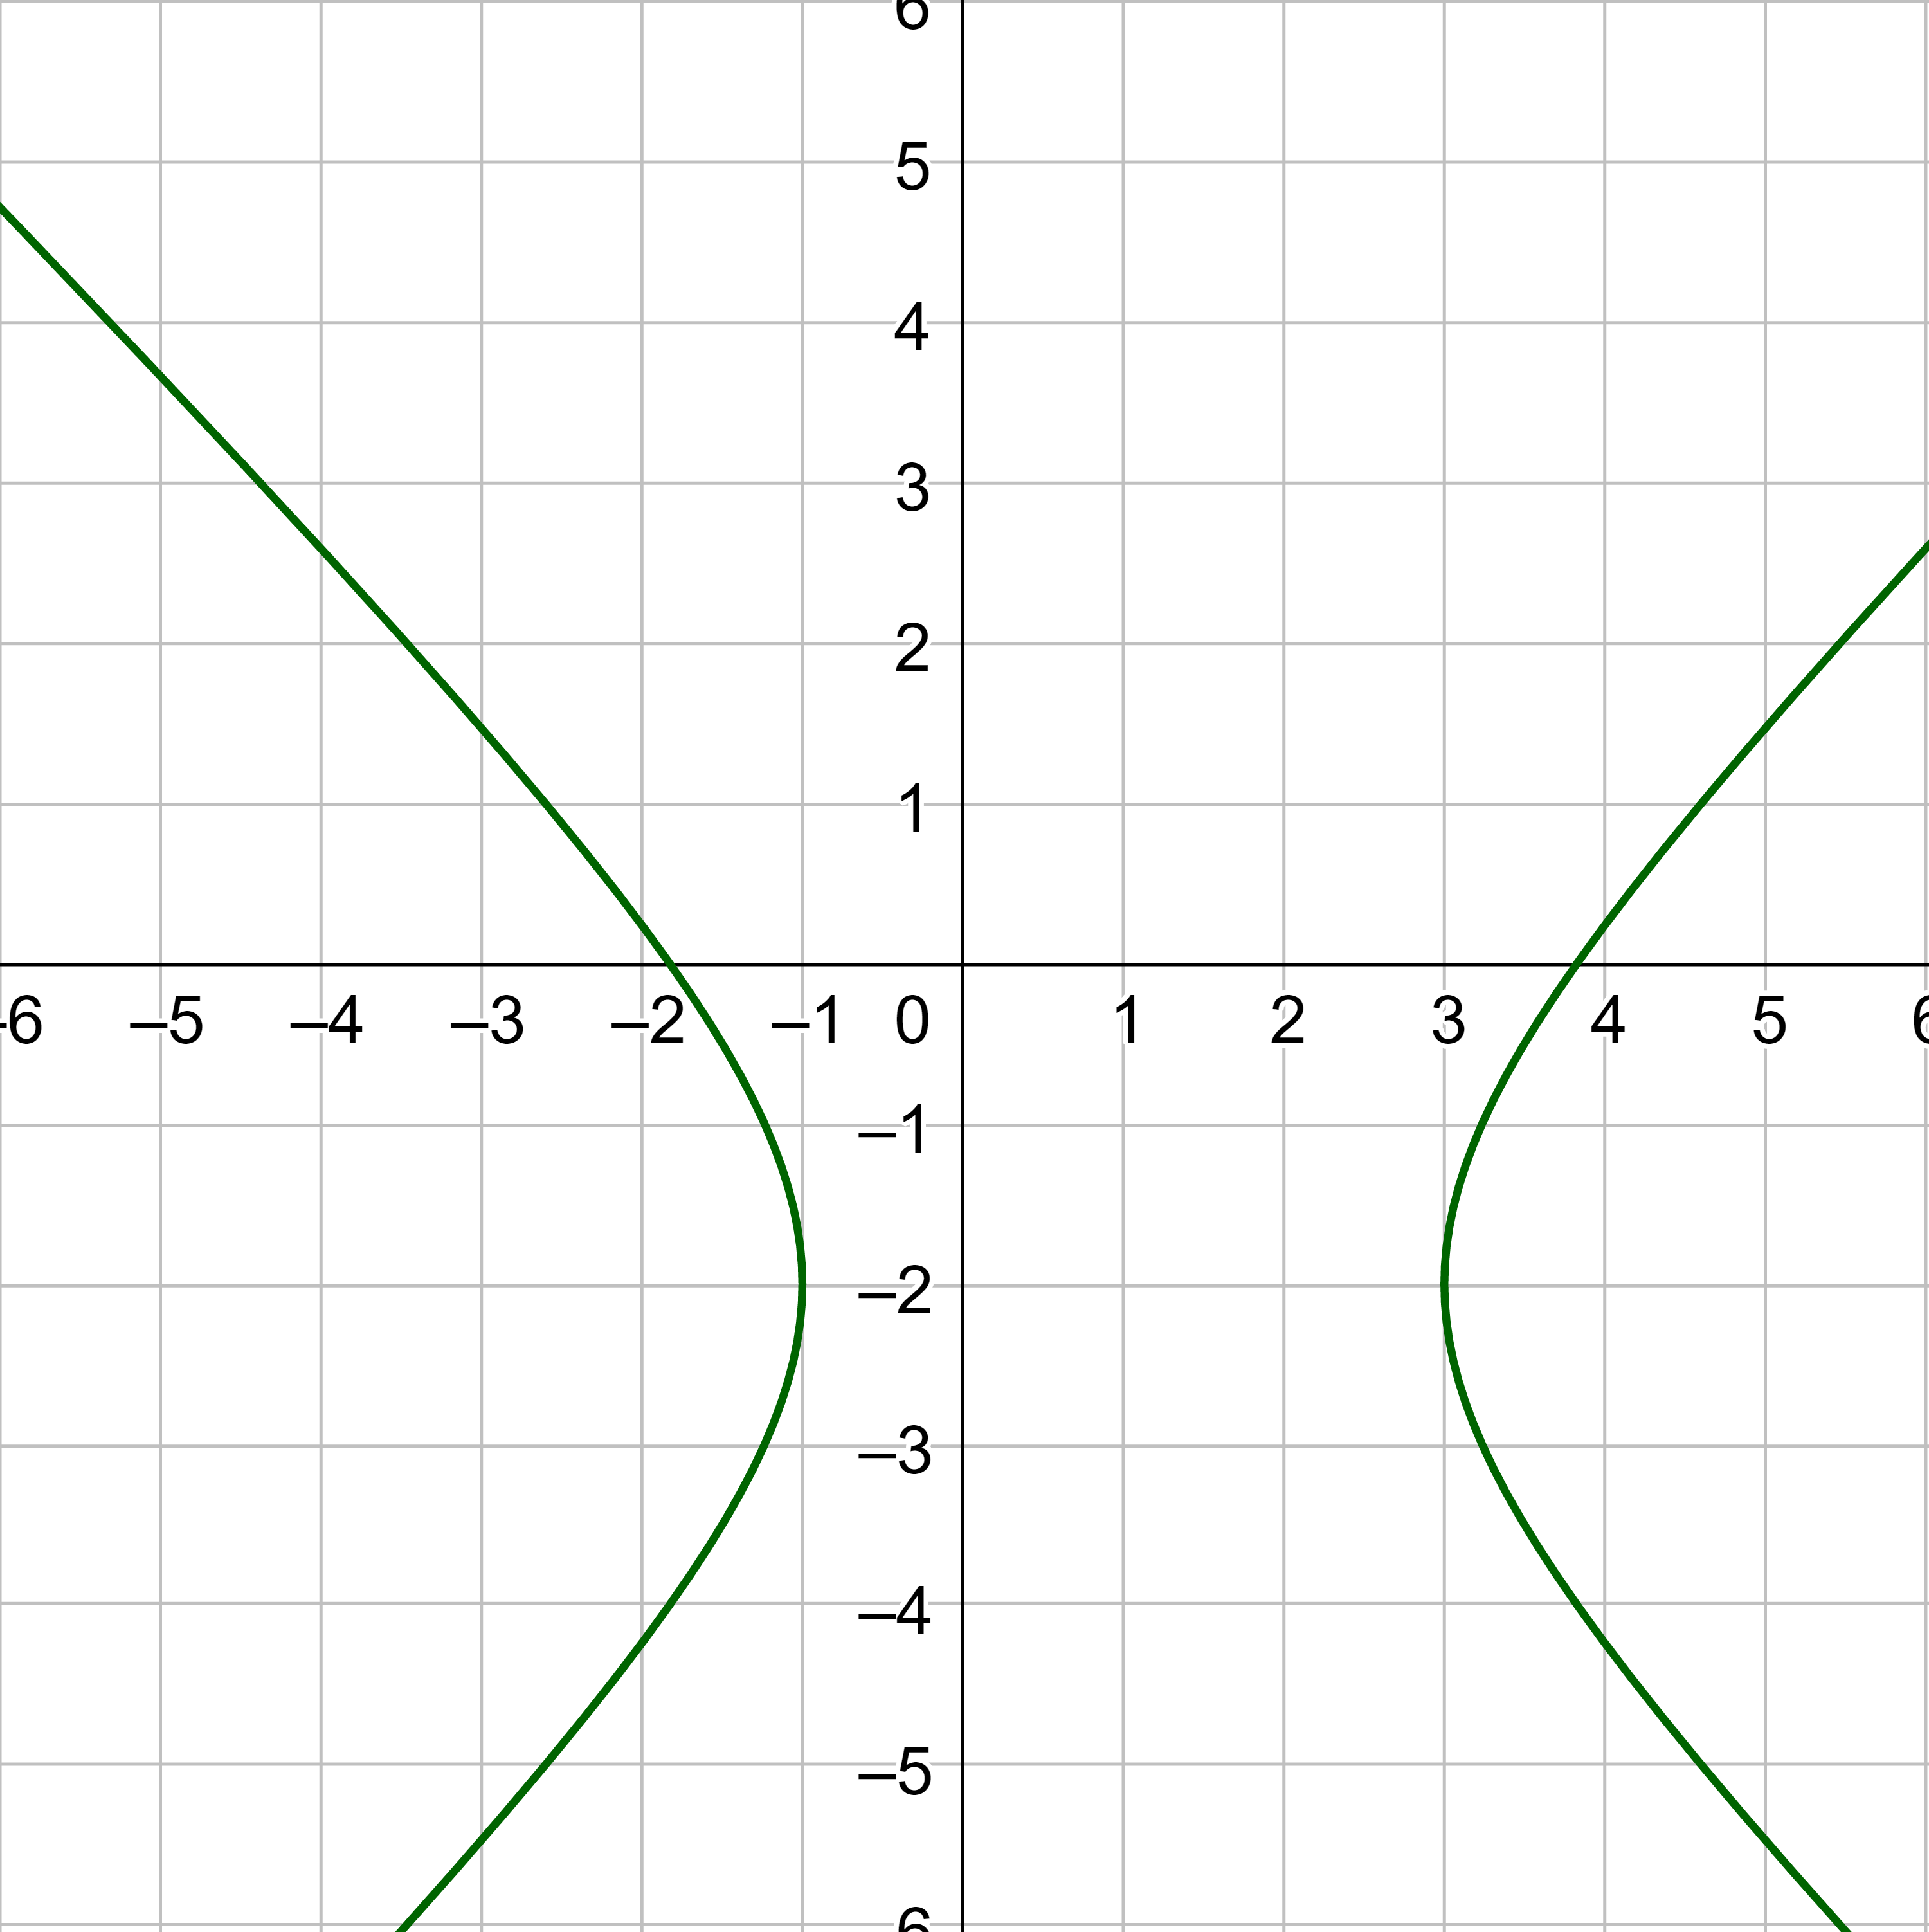
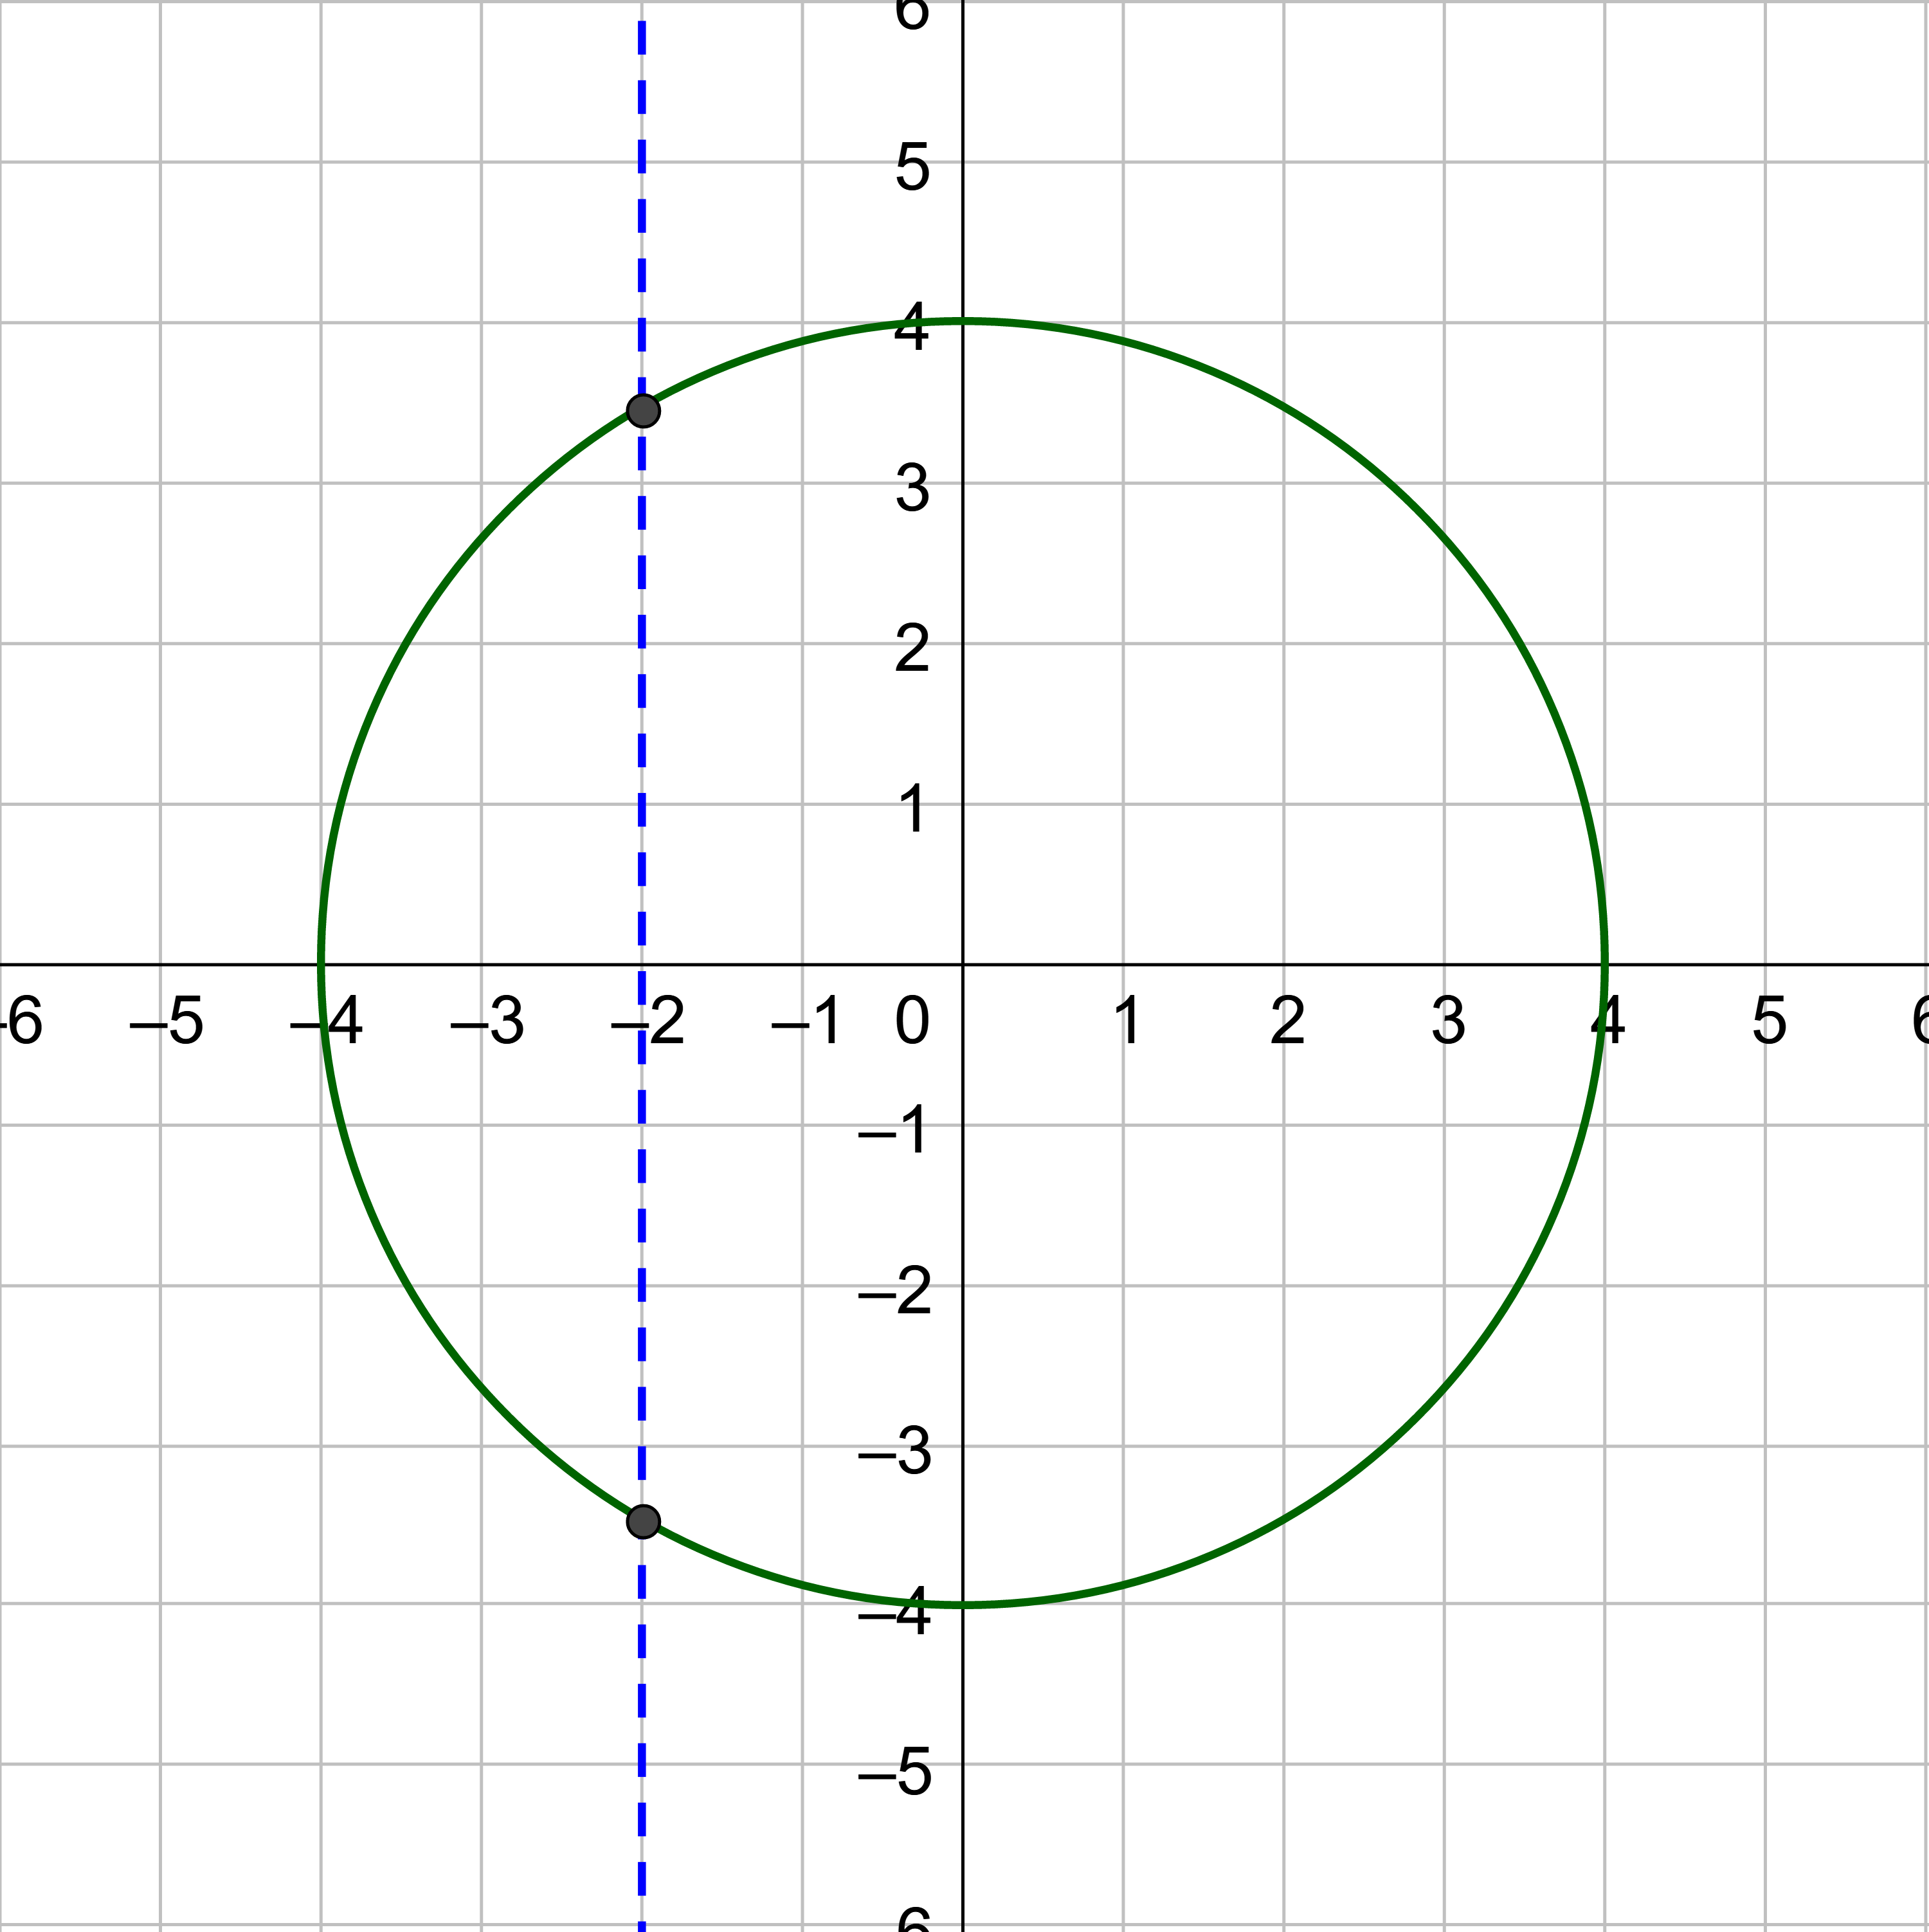
Which of the graphs represent a function?
Solution
The vertical line test says that if any vertical line intersects a graph more than once, then the graph does not represent a function.
The first two graphs are functions because no vertical line can intersect the graph more than one. The circle is not a function because a vertical line can intersect it twice.
Does the graph represent a function?
Answer
Yes, it passes the vertical line test.
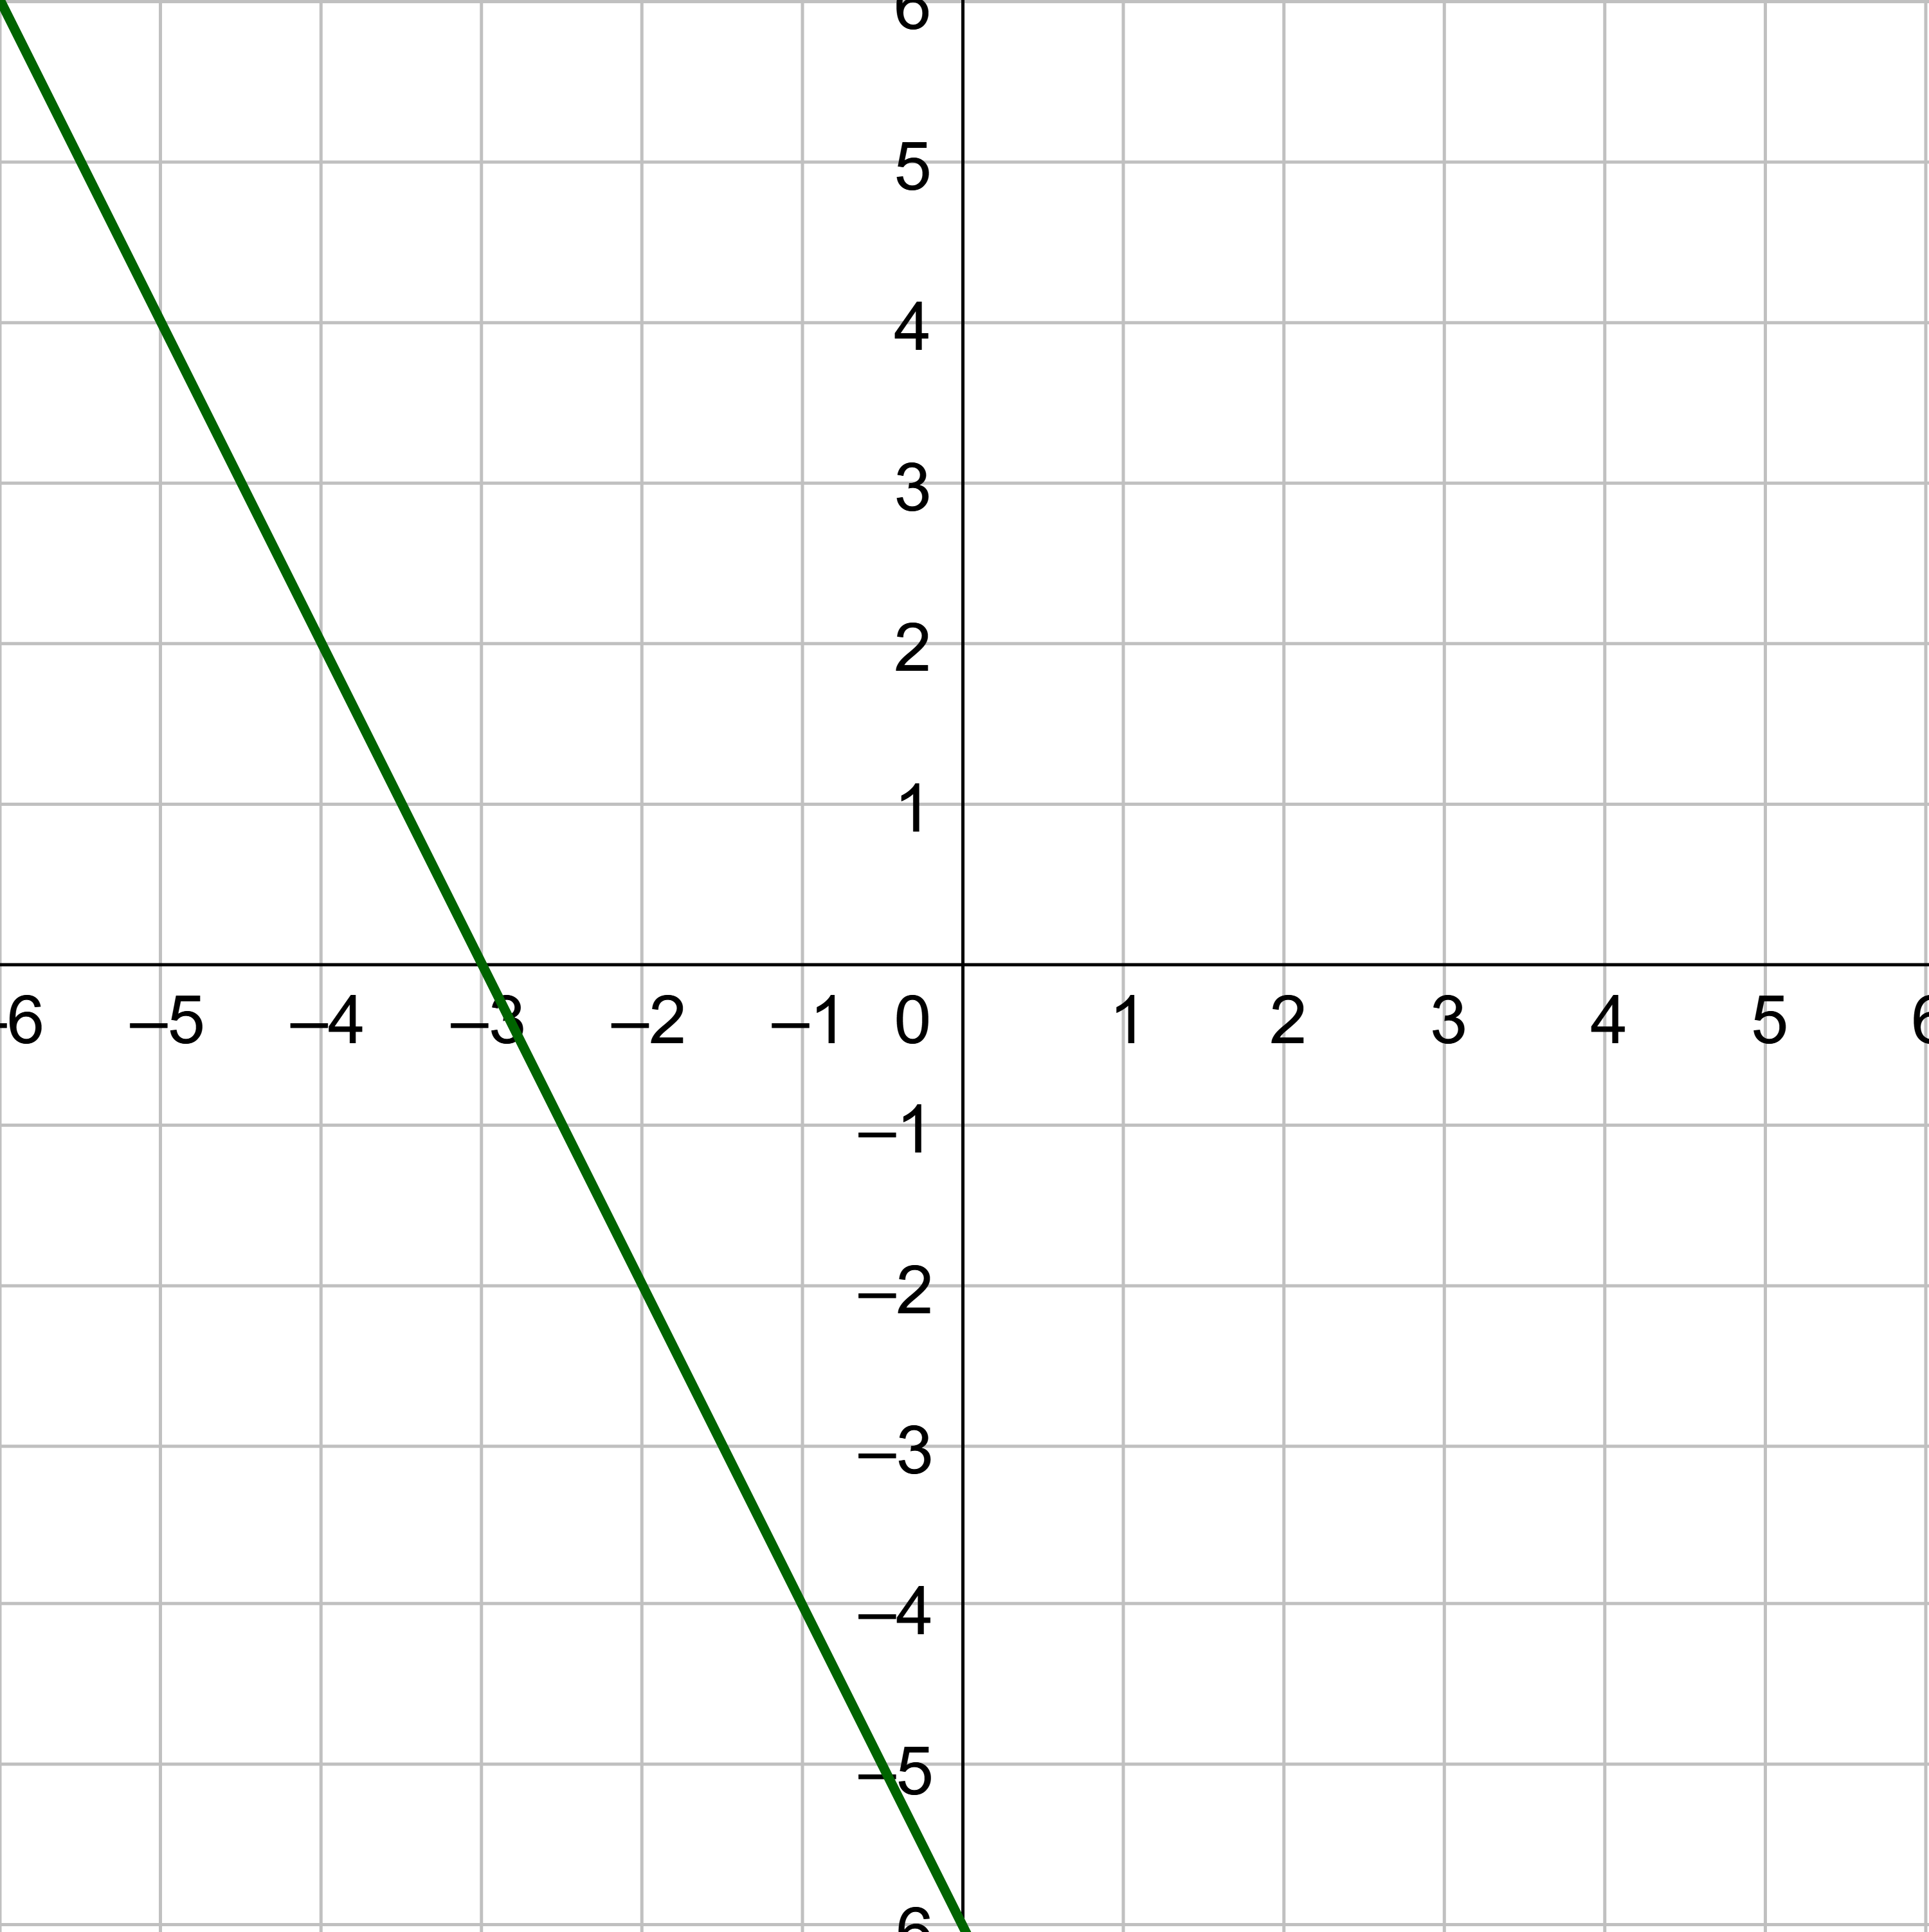
If the graph of f has an x-intercept at (a, 0), then it has a zero at a. The zeros of a function are the values of x that make f(x) = 0. Since f(x) replaced y in the equation, then the zeros occur where the y-values are 0 which is on the x-axis.
The zeros of a function, f(x), are the x-values for which f(x) = 0.
Find the zeros of the following functions.
Solution
Replace the f(x) with 0 and solve for x.
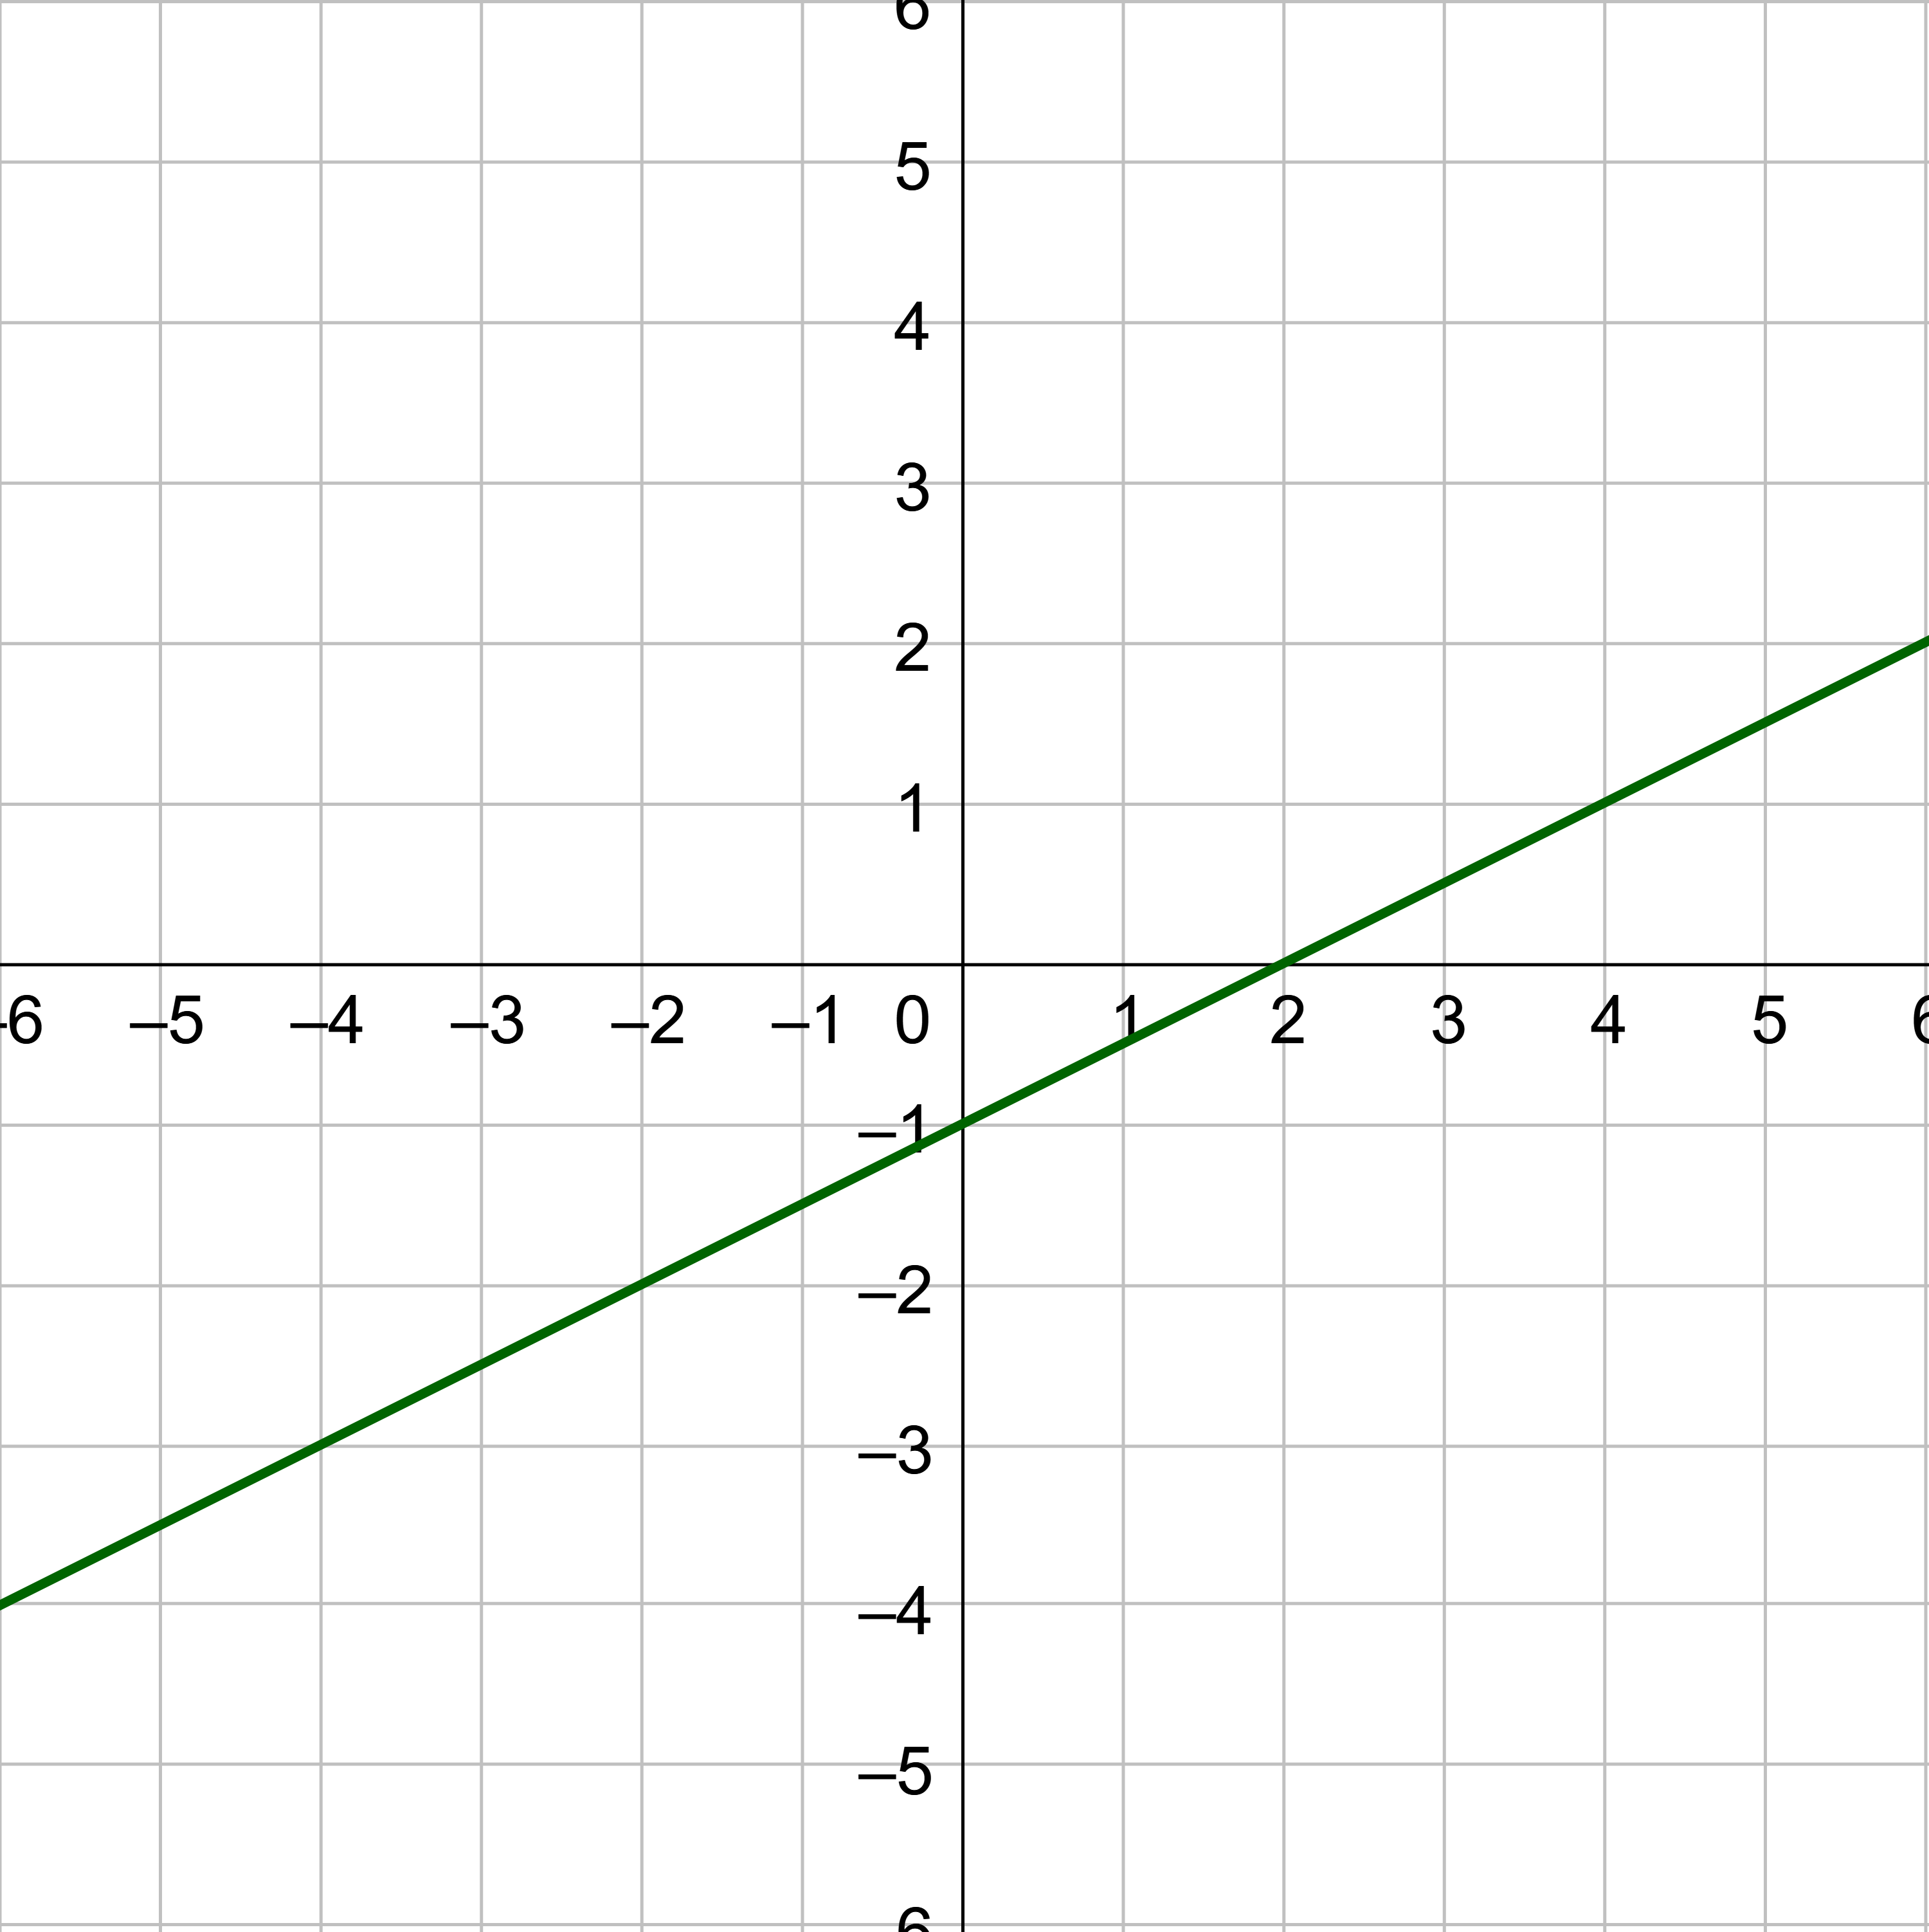
0 = −2x − 6
6 = −2x
−3 = x
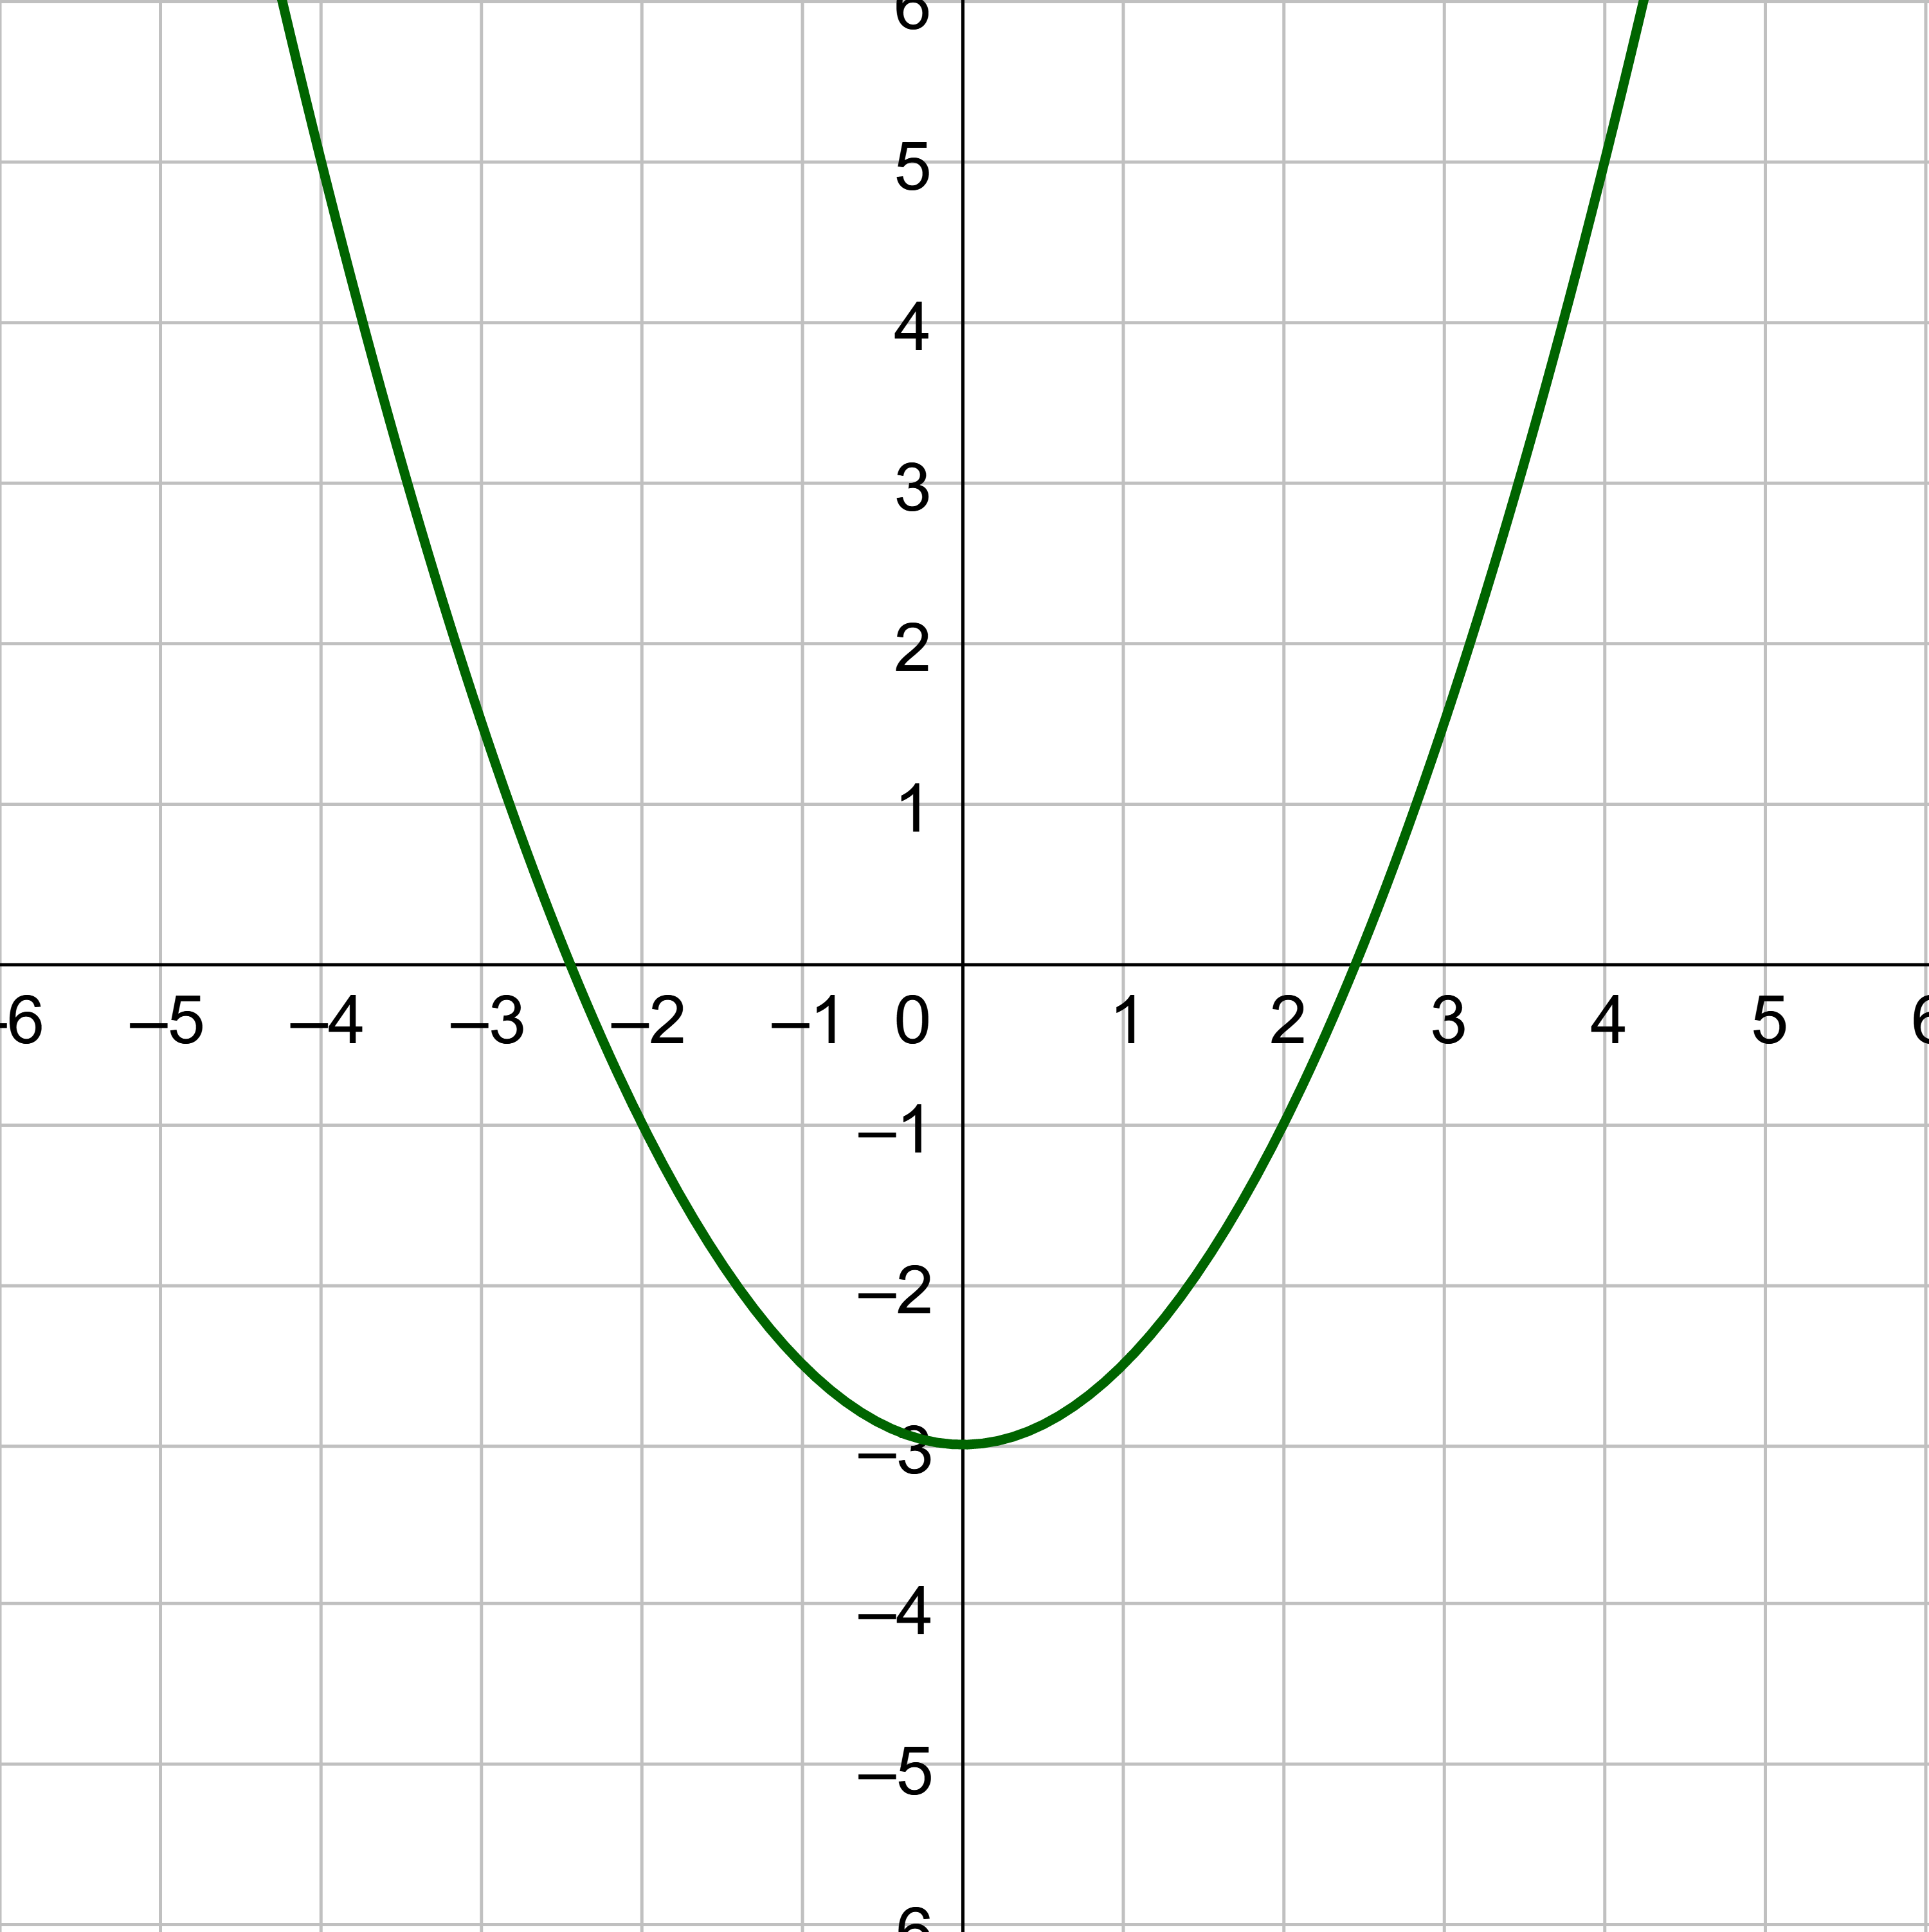
The zero of f(x) is x = −3. Notice the graph in figure 9 has x-intercept (−3, 0).
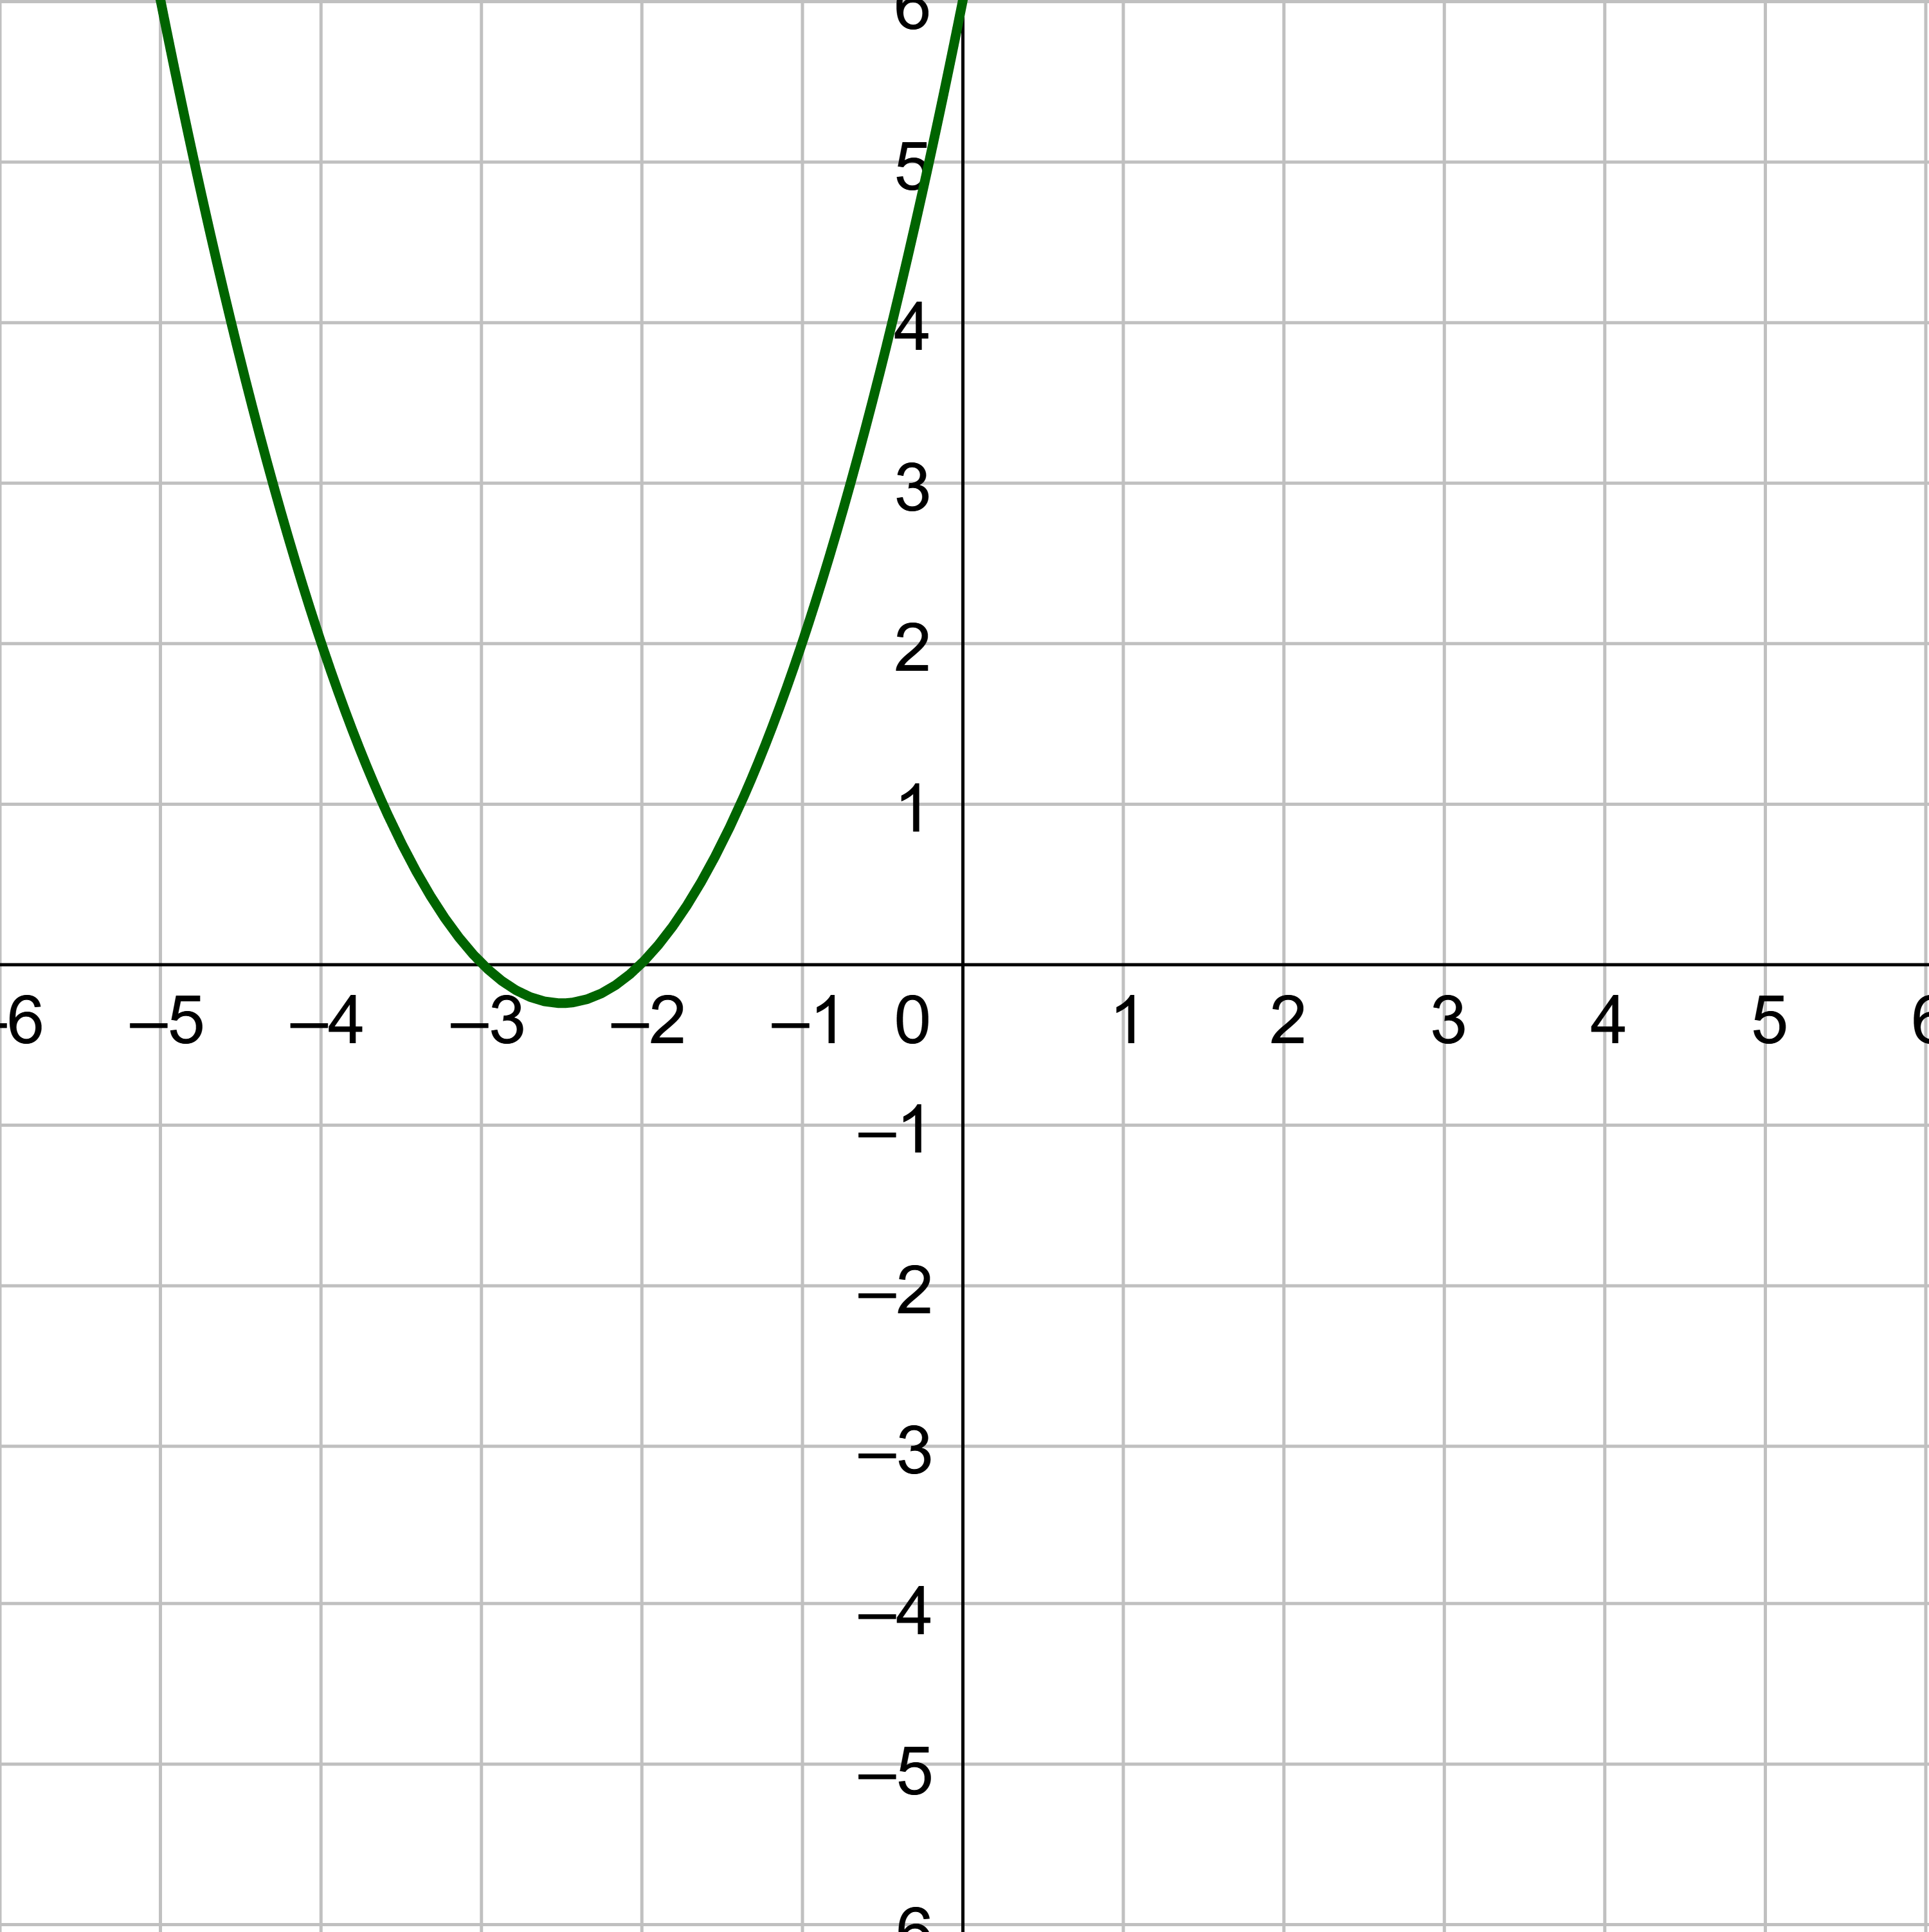
Replace the g(x) with 0 and solve for x.
0 = x2 + 5x + 6
0 = (x + 2)(x + 3)
x + 2 = 0 → x = −2
x + 3 = 0 → x = −3
The zeros of g(x) are x = −3 and x = −2. Notice the graph in figure 10 has x-intercepts (−3, 0) and (−2, 0).
Find the zeros of f(x) = −x + 5.
Answer
x = 5
Think about a relation describing the price of gas as a function of the year. The price fluctuates during each year and between years. By looking at how quickly the price changes, prices in the future can be predicted. The price changes day-by-day, but long-term trends can be found by using widely separated data such as the beginning and end of an experiment or study. The long-term change is called the average rate of change. This is the ratio of the change in the output over the change of the input. Thus, the rate of change is the same as the slope.
$$ \text{Average rate of change } = \text{ slope } = \frac{\text{Change in output}}{\text{Change in input}} $$
$$ = \frac{Δy}{Δx} $$
$$ = \frac{y_2 - y_1}{x_2 - x_1} $$
$$ = \frac{f(x_2) - f(x_1)}{x_2 - x_1} $$
The Greek letter Δ (delta) stands for "change in", so the average rate of change is the "change in y" over the "change in x".
Examples of rates of change include:
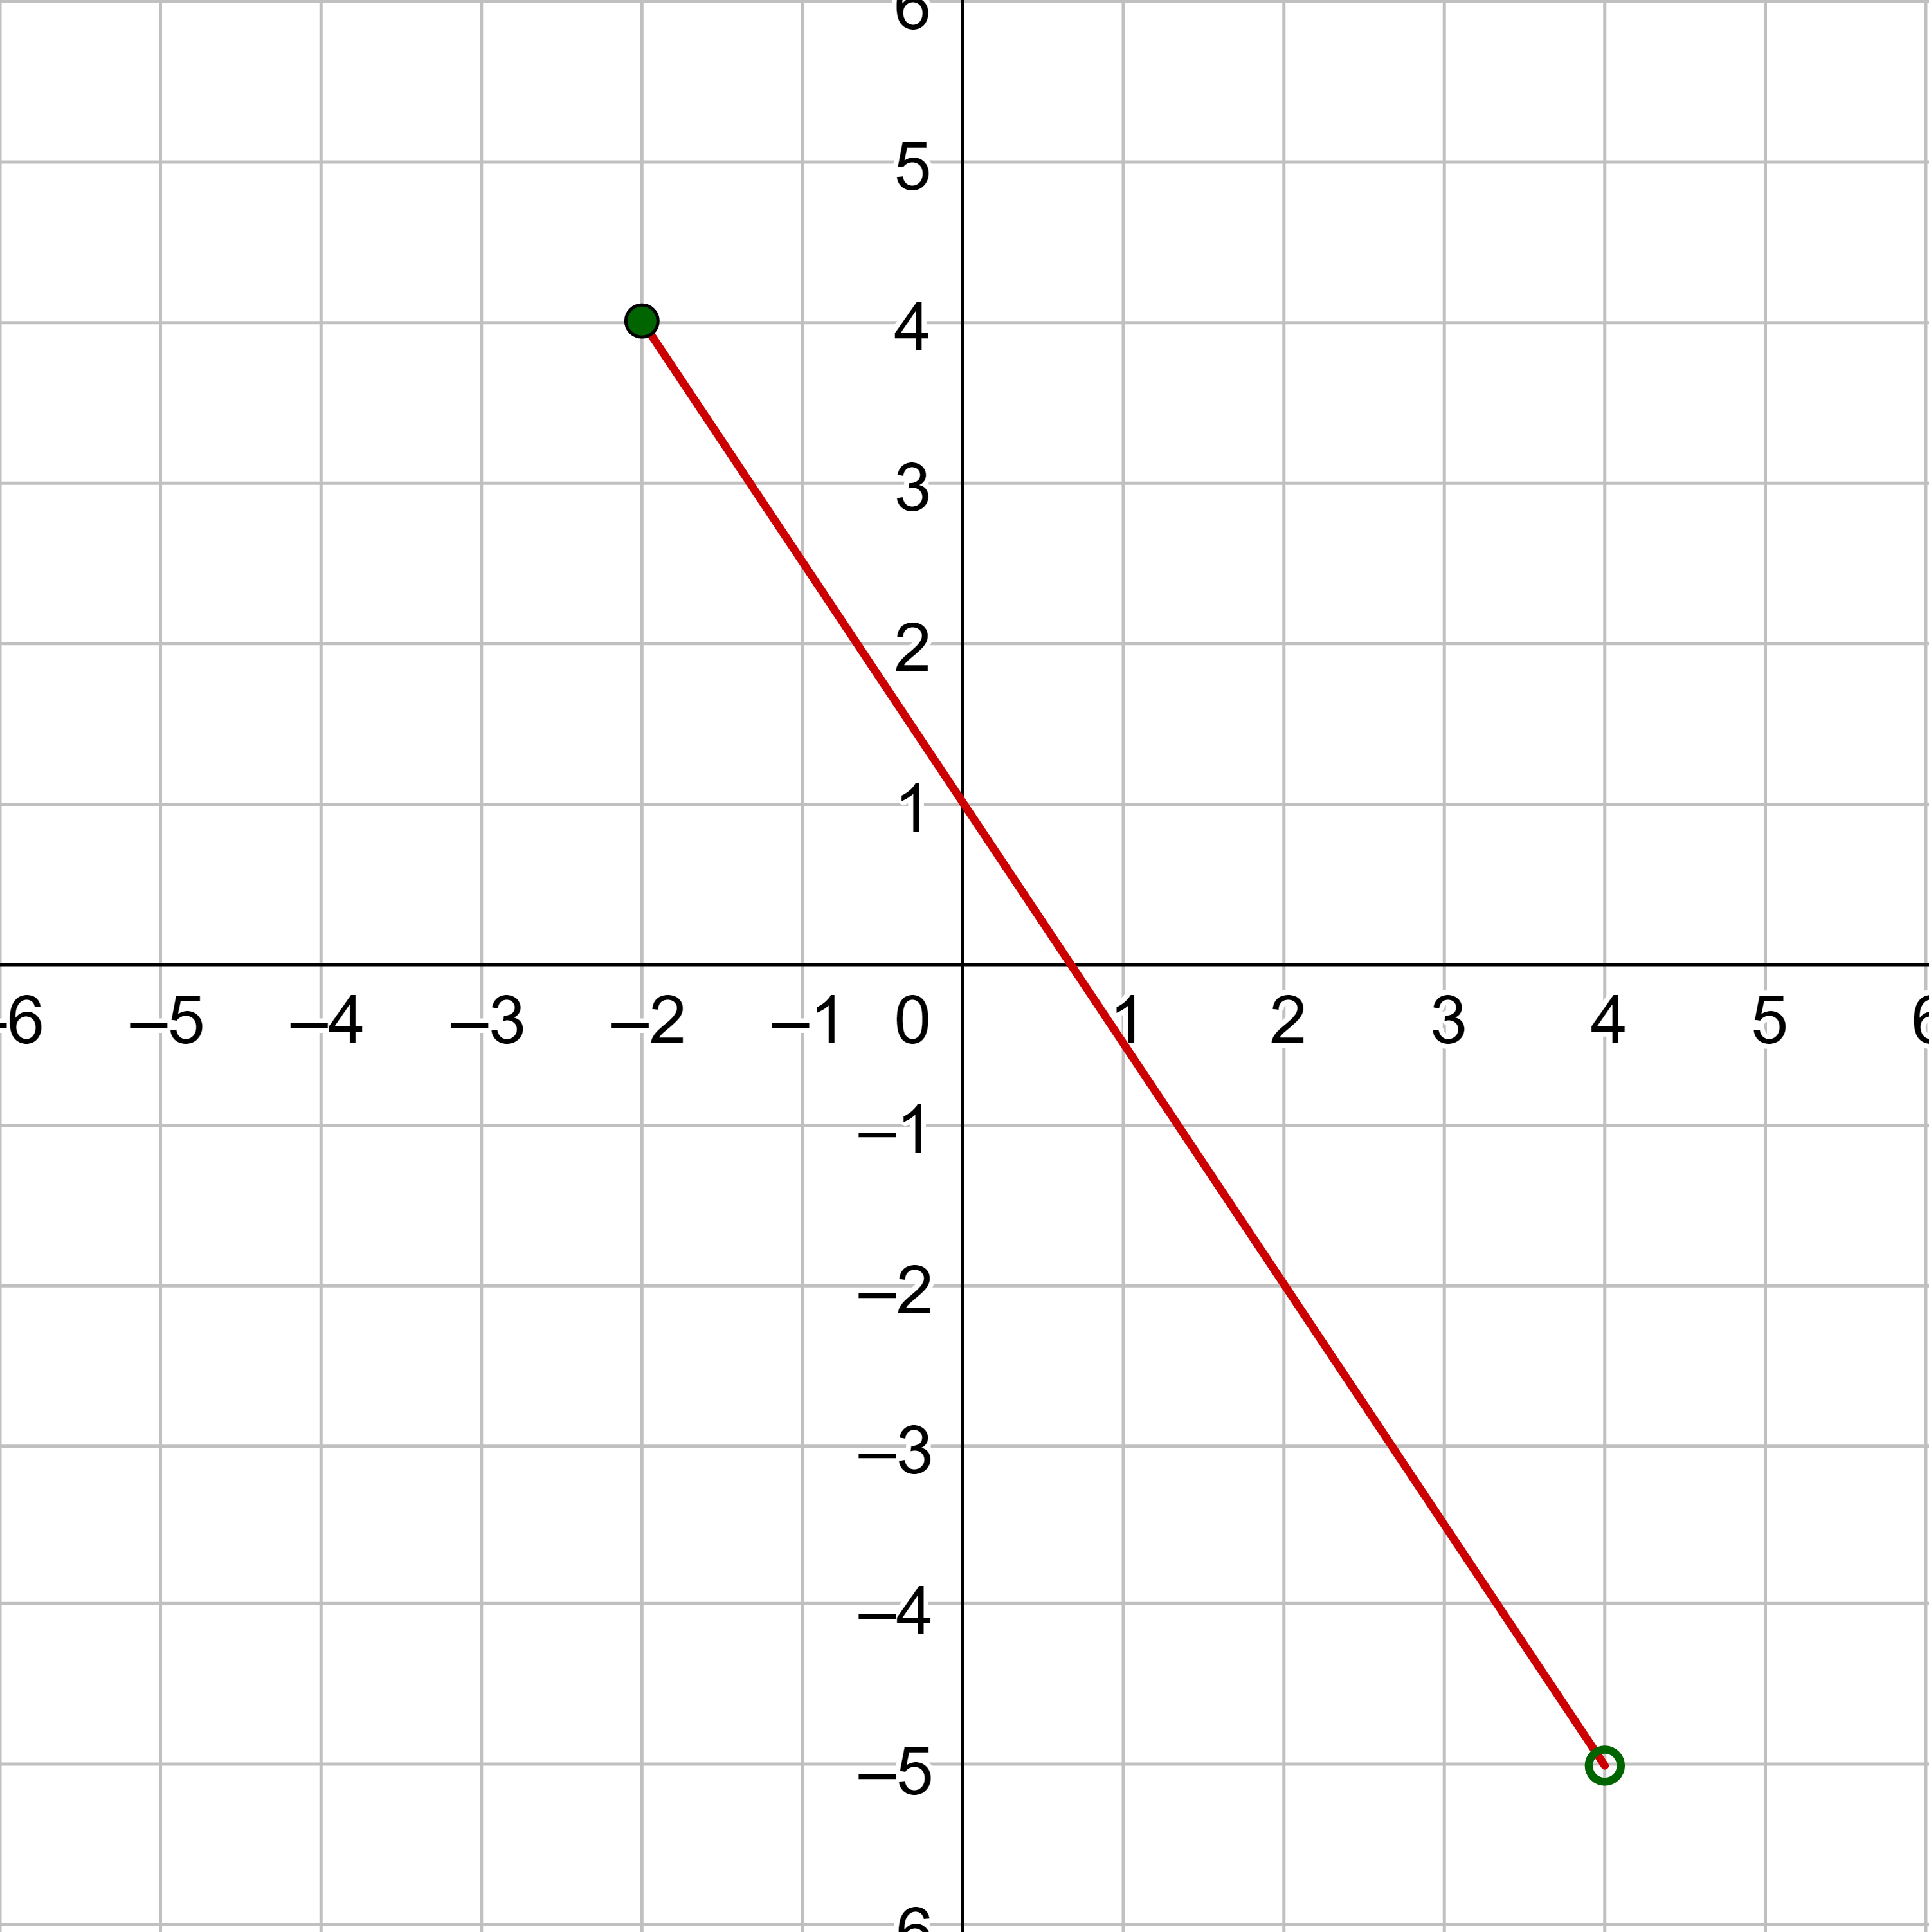
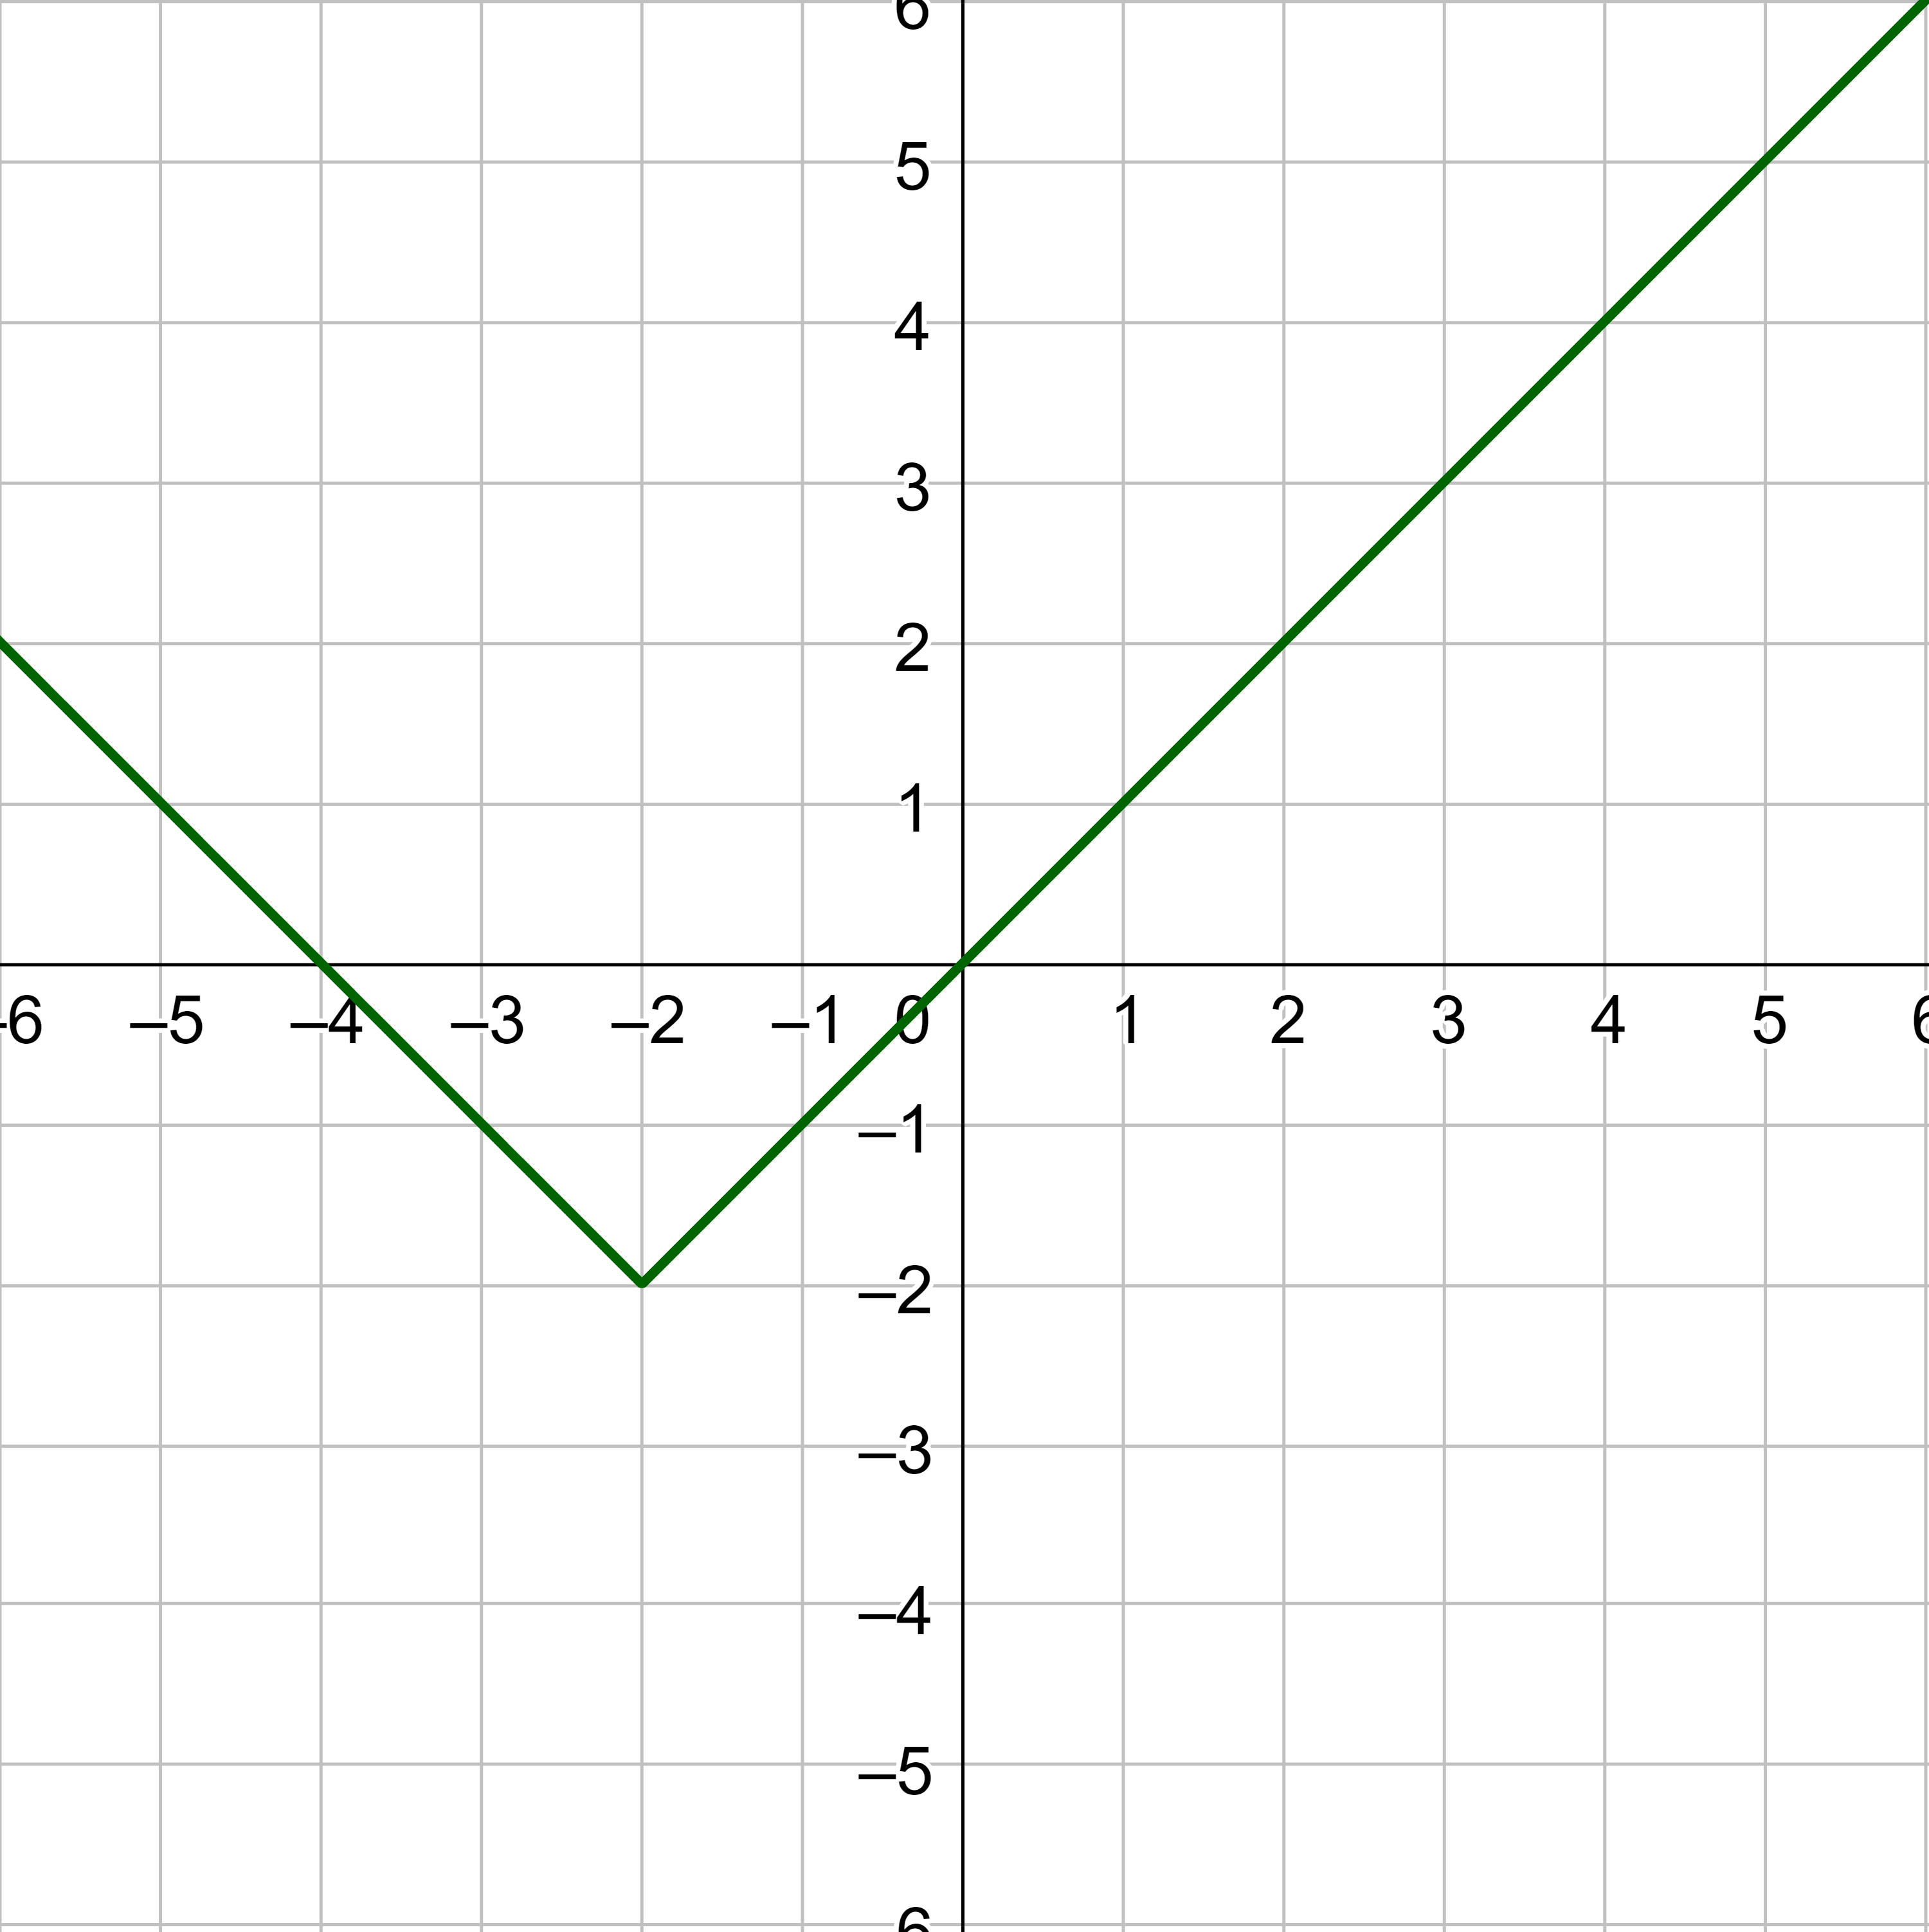
Find the average rate of change on the interval [−2, 4] for the function in the graph.
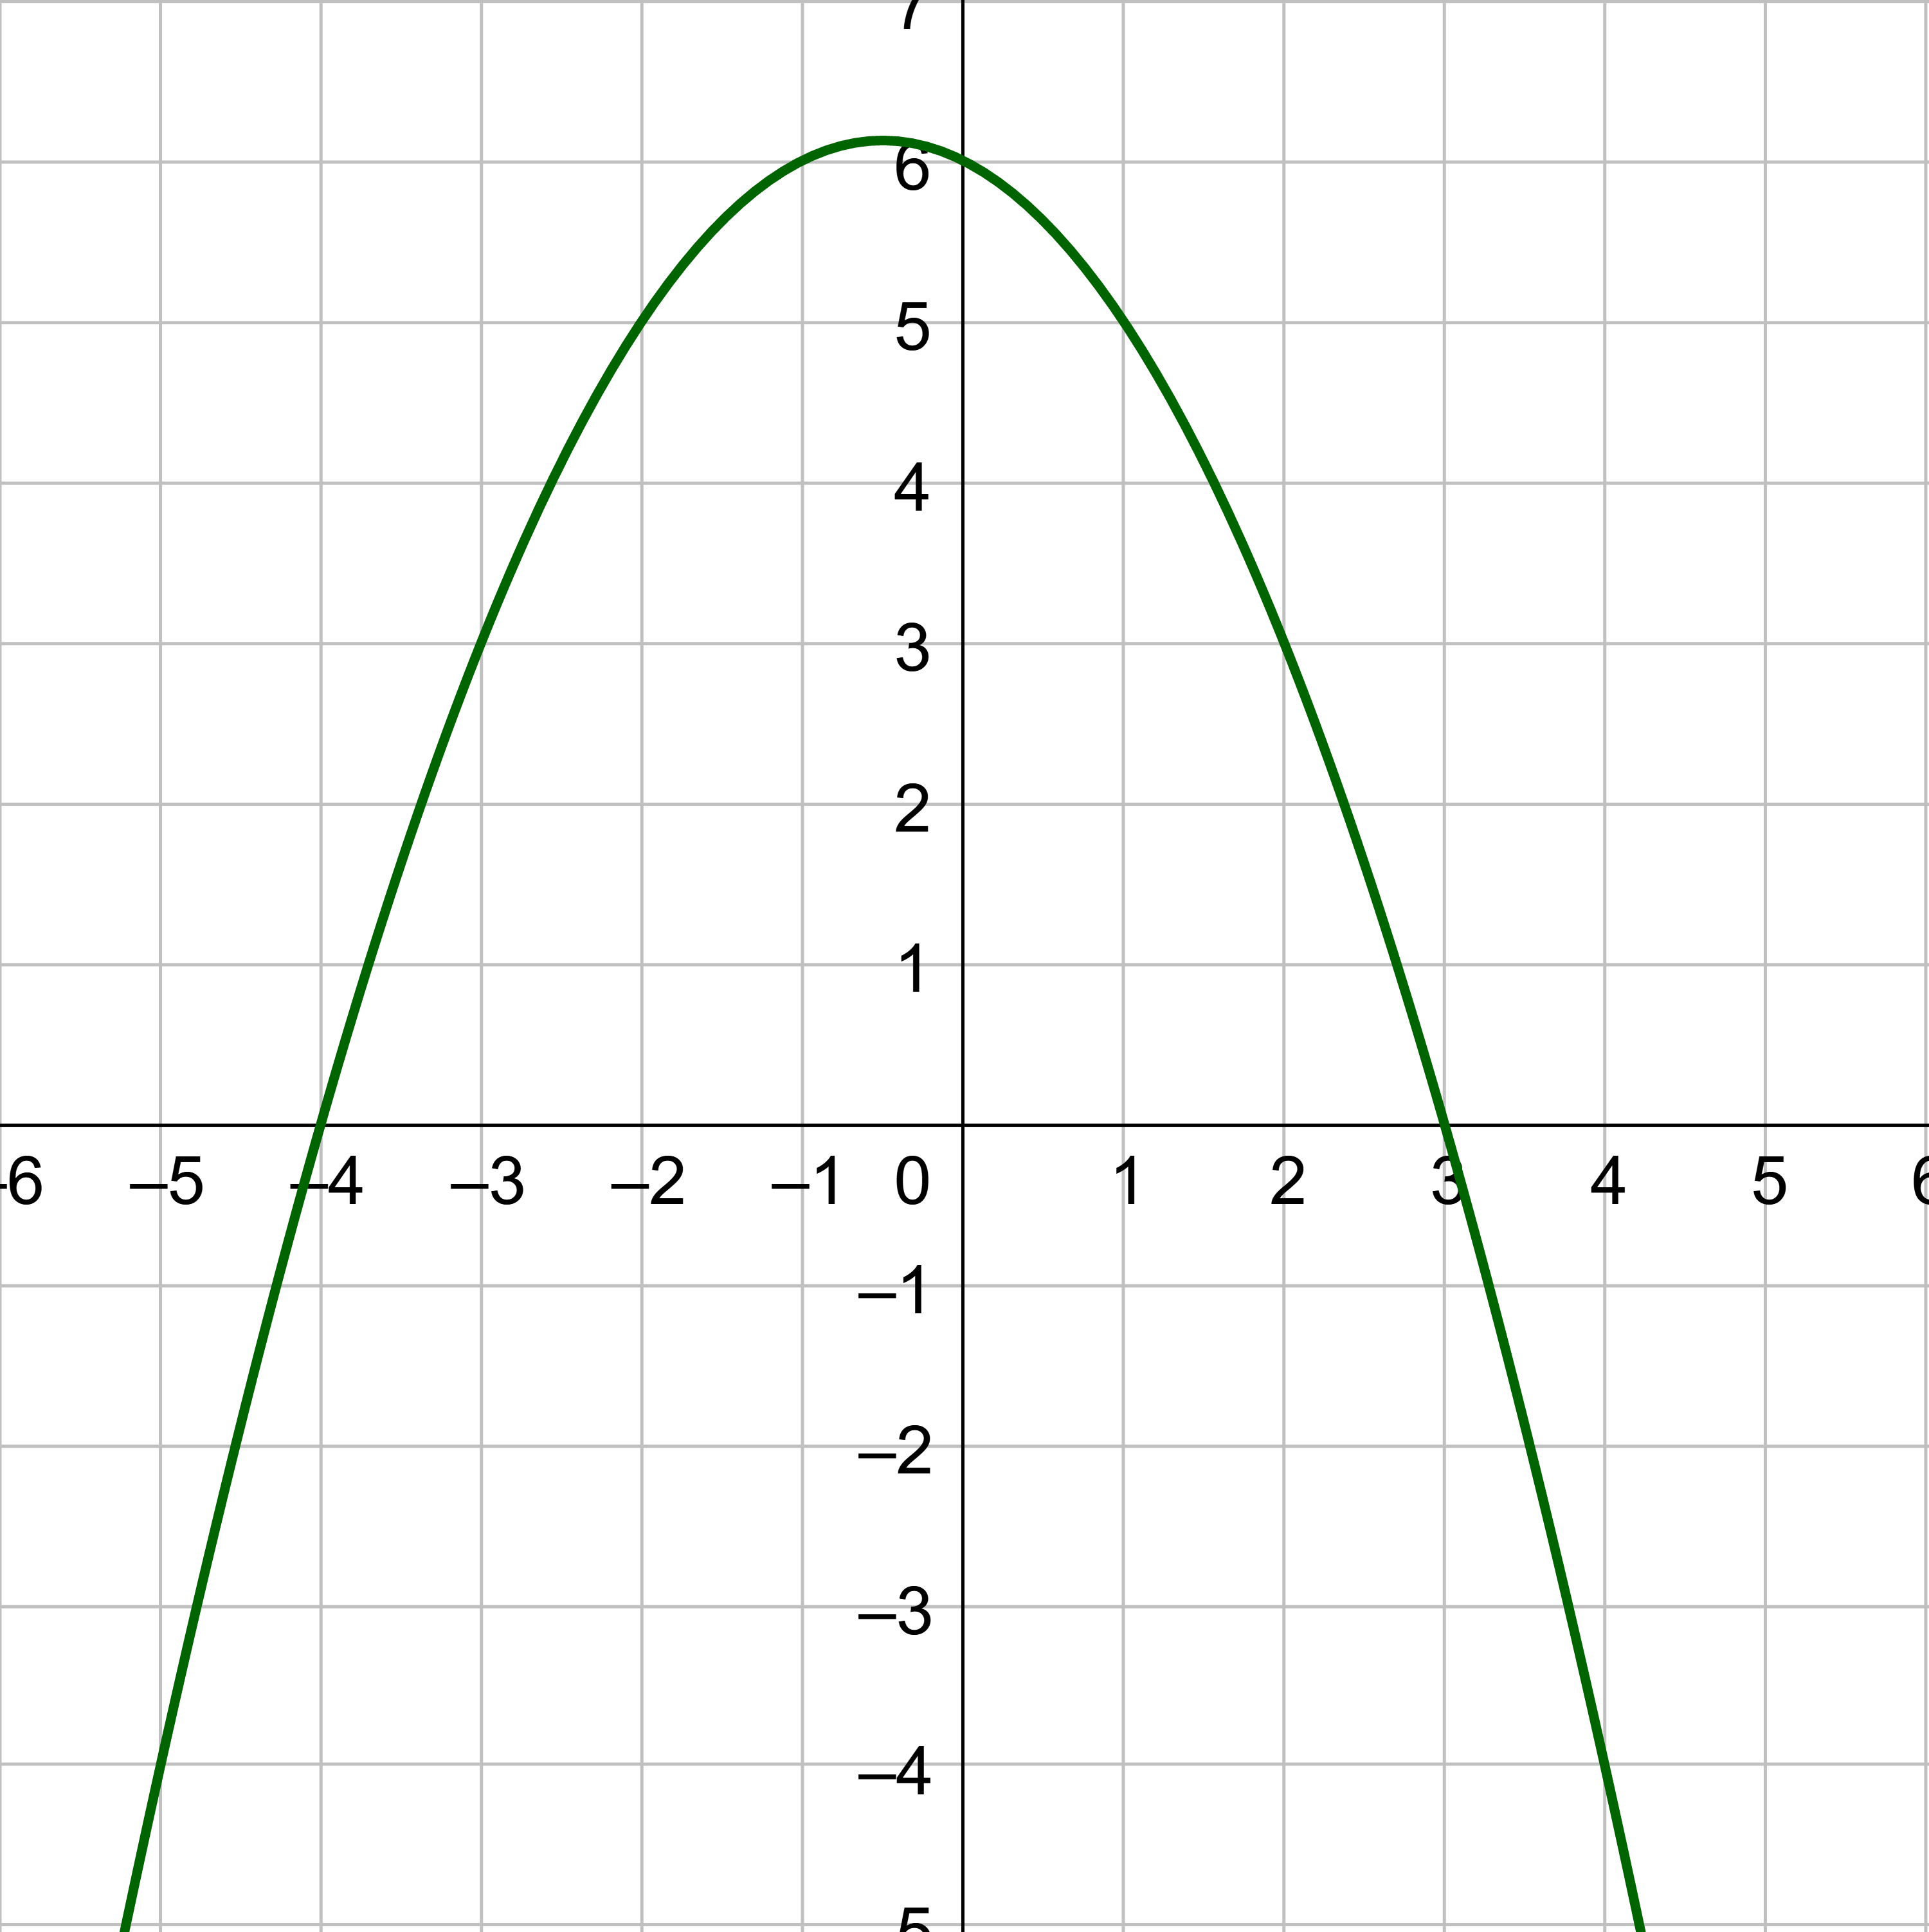
Solution
Start by finding the two points where x = −2 and x = 4. They are (−2, 5) and (4, −4).
Substitute those points into the slope formula.
$$ m = \frac{y_2 - y_1}{x_2 - x_1} $$
$$ m = \frac{-4 - 5}{4 - (-2)} $$
$$ m = -\frac{3}{2} $$
Cheetahs have amazing acceleration and top speed. A video was taken of a cheetah accelerating and the speed data is displayed in the table. Acceleration is the rate of change of speed with time. Find the average acceleration for the first 3 seconds.
t (s) |
0 |
0.5 |
1 |
1.5 |
2 |
2.5 |
3 |
3.5 |
v (m/s) |
0 |
4.63 |
9.25 |
13.88 |
18.5 |
23.13 |
27.75 |
28.33 |
Solution
The acceleration is the average rate of change. The problem asks for the first 3 seconds, so use the points at t = 0 and t = 3 which are (0, 0) and (3, 27.75).
$$ m = \frac{y_2 - y_1}{x_2 - x_1} $$
$$ a = \frac{27.75 \text{ m/s } - 0}{3 \text{ s } - 0} $$
$$ a = 9.25 \text{ m/s}^2 $$
The cheetah can accelerate at 9.25 m/s2 which is faster than some car's acceleration.
Notice that the average acceleration would be different if a different time frame were chosen. For example, the average acceleration from 3 to 3.5 seconds is 1.16 m/s2.
Find the average rate of change for the function f(x) = x3 + 5 from x = 1 and x = 4.
Answer
21
As part of the investigation of how functions change, the graphs show intervals where the functions change in specific ways. A function is increasing if it rises left to right and has a positive rate of change. A function is decreasing if it falls from left to right and has a negative rate of change. A function can also be constant if it is horizontal and does not rise or fall. Constant functions have zero rate of change.
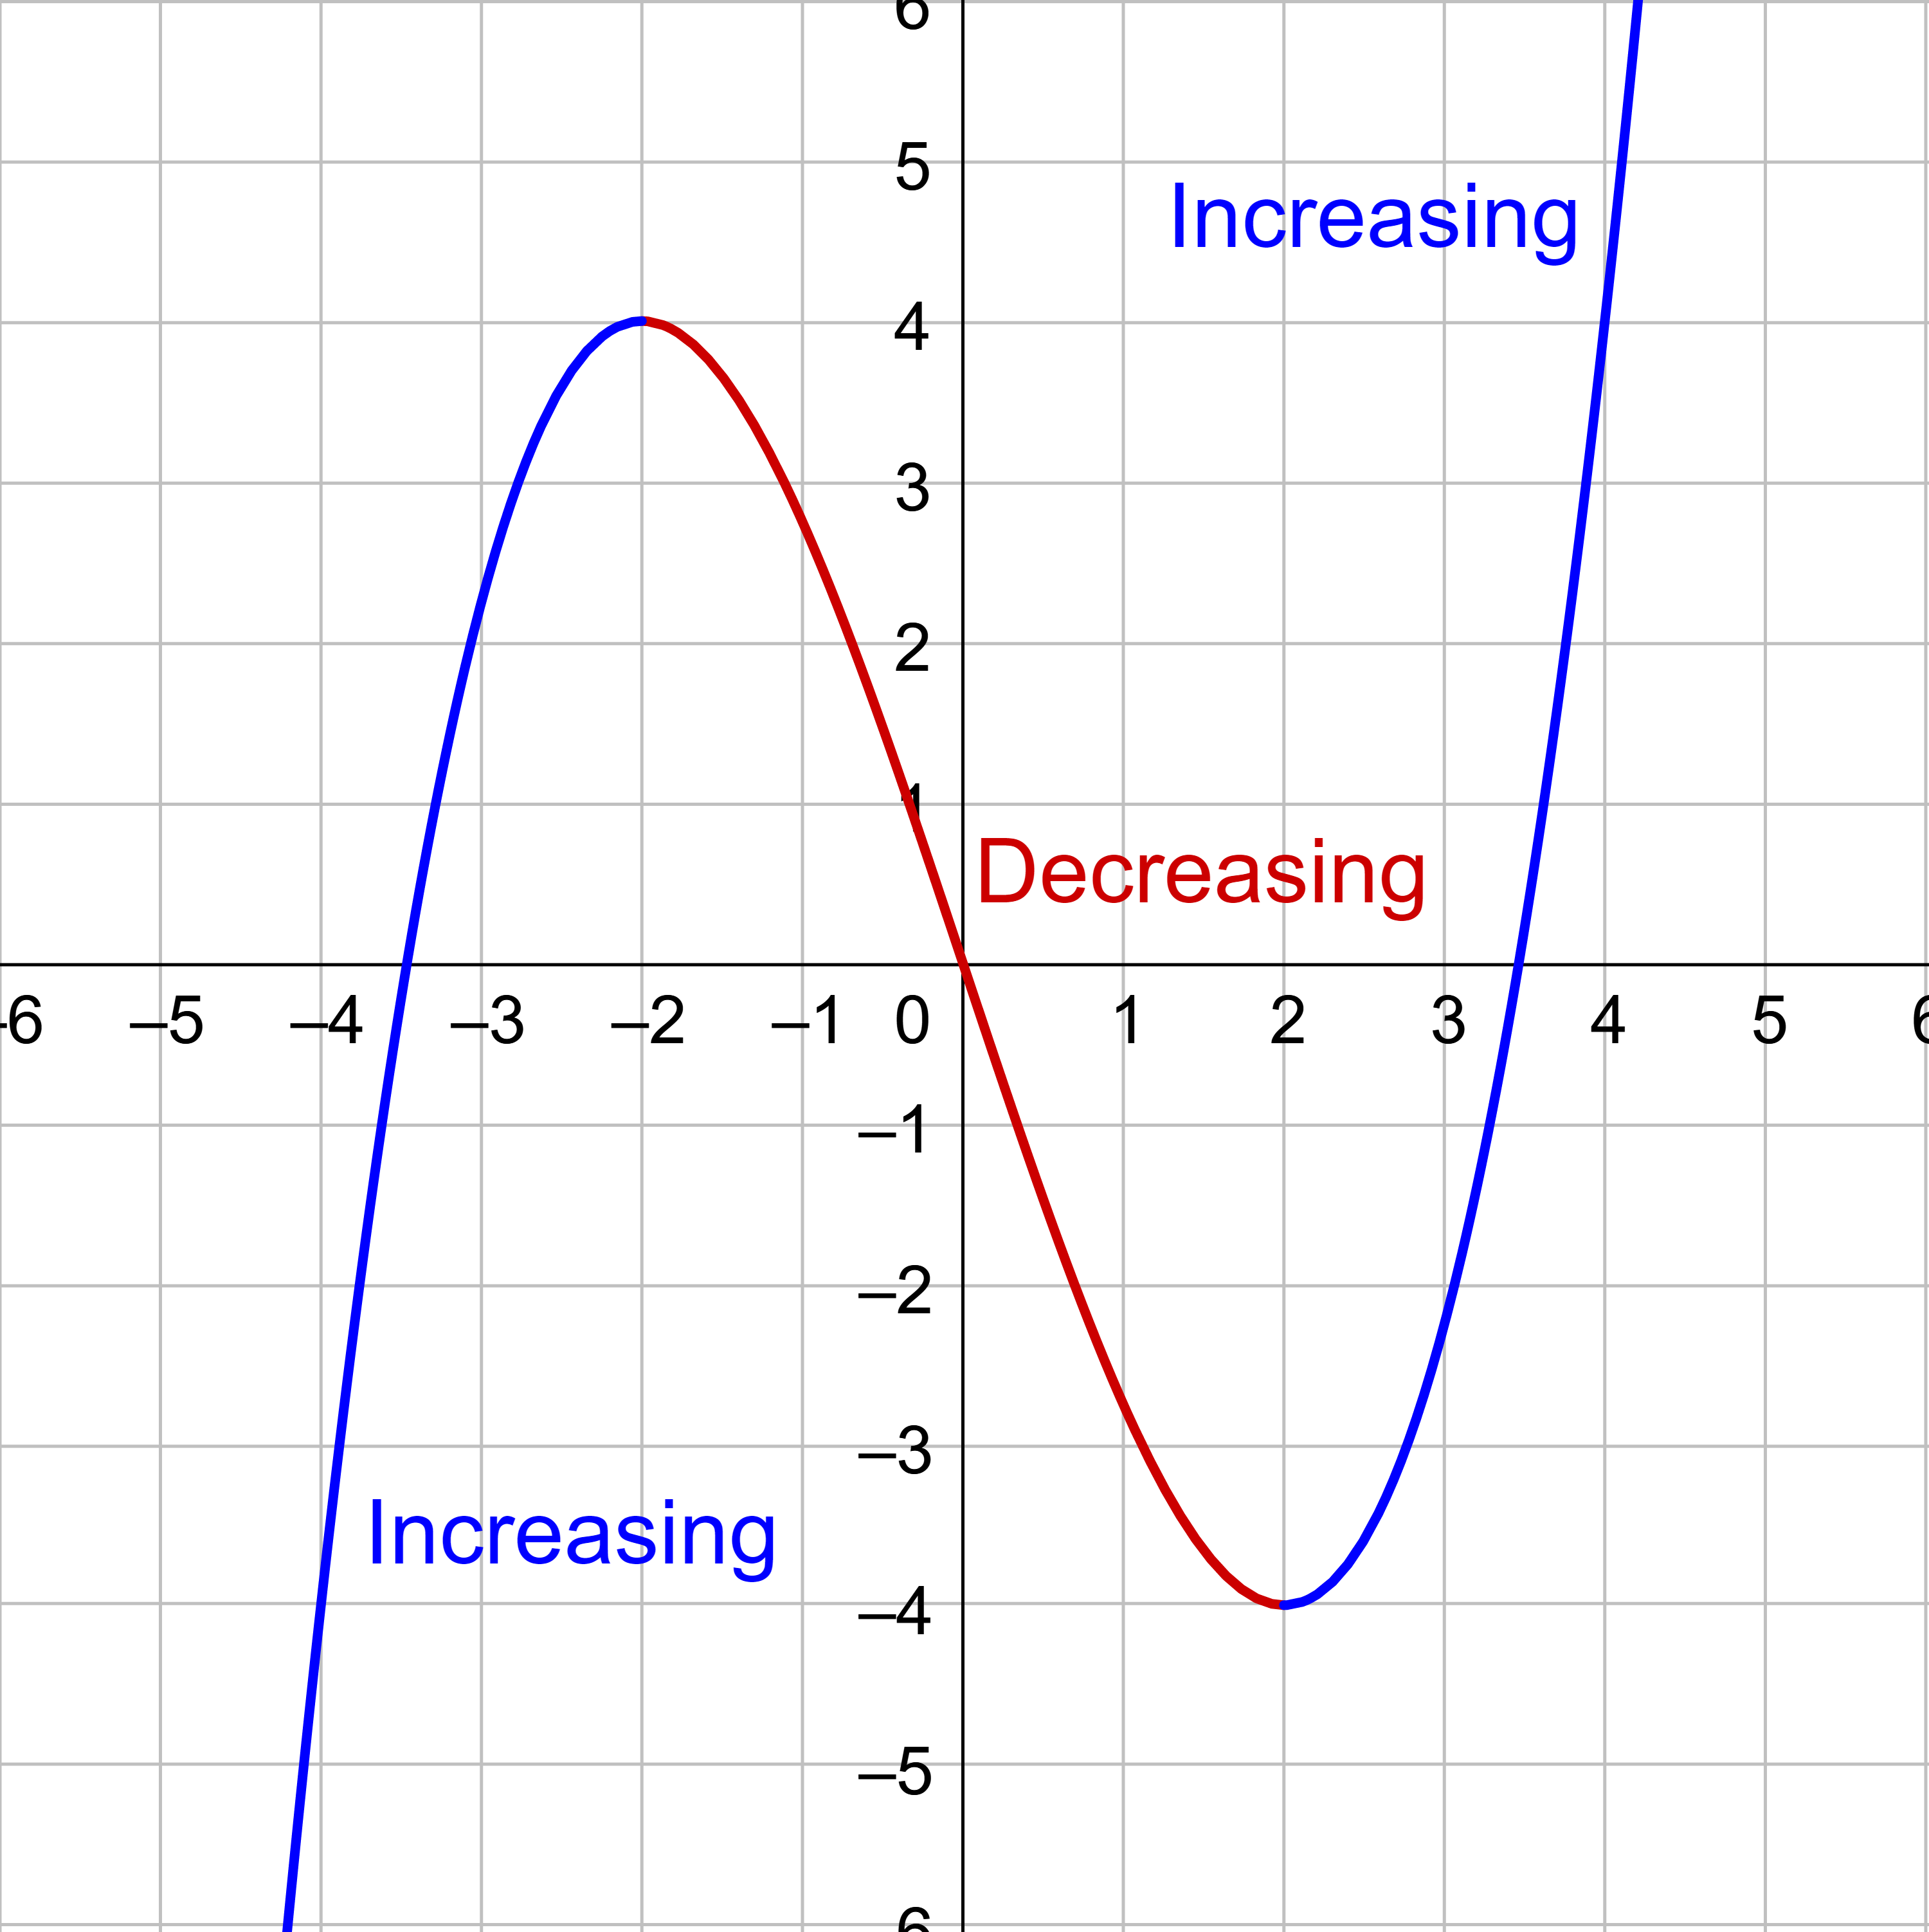
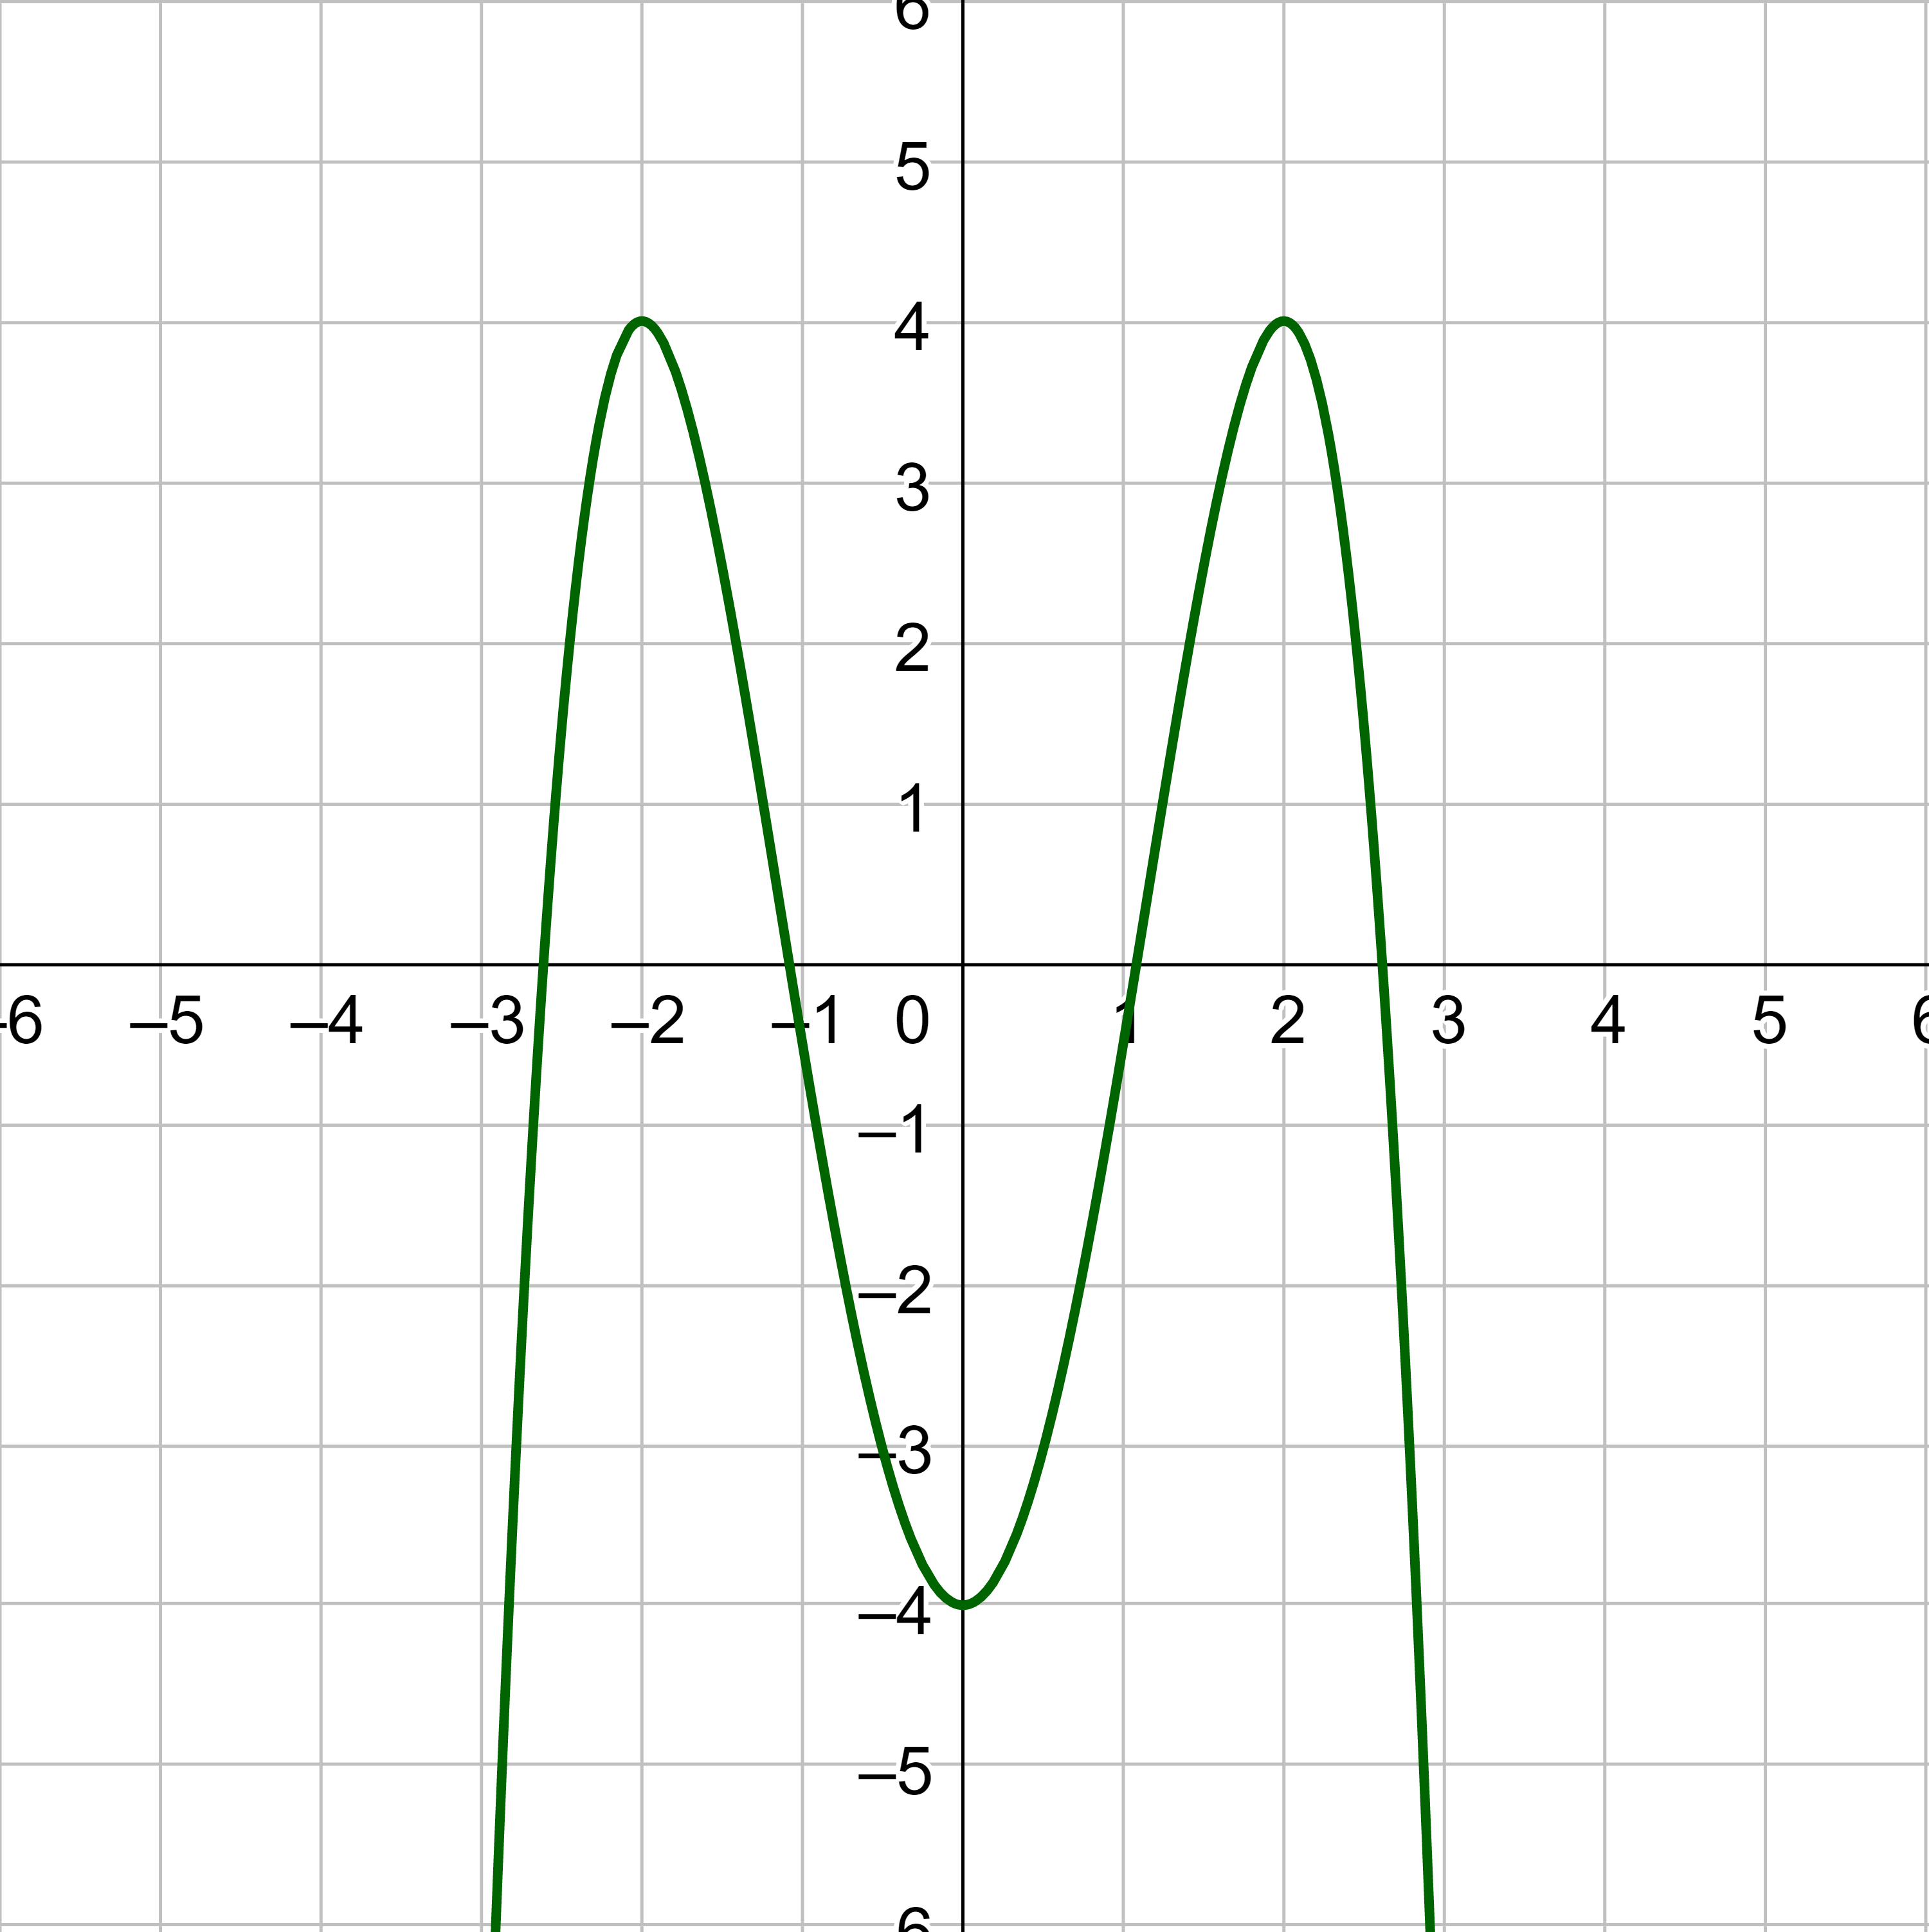
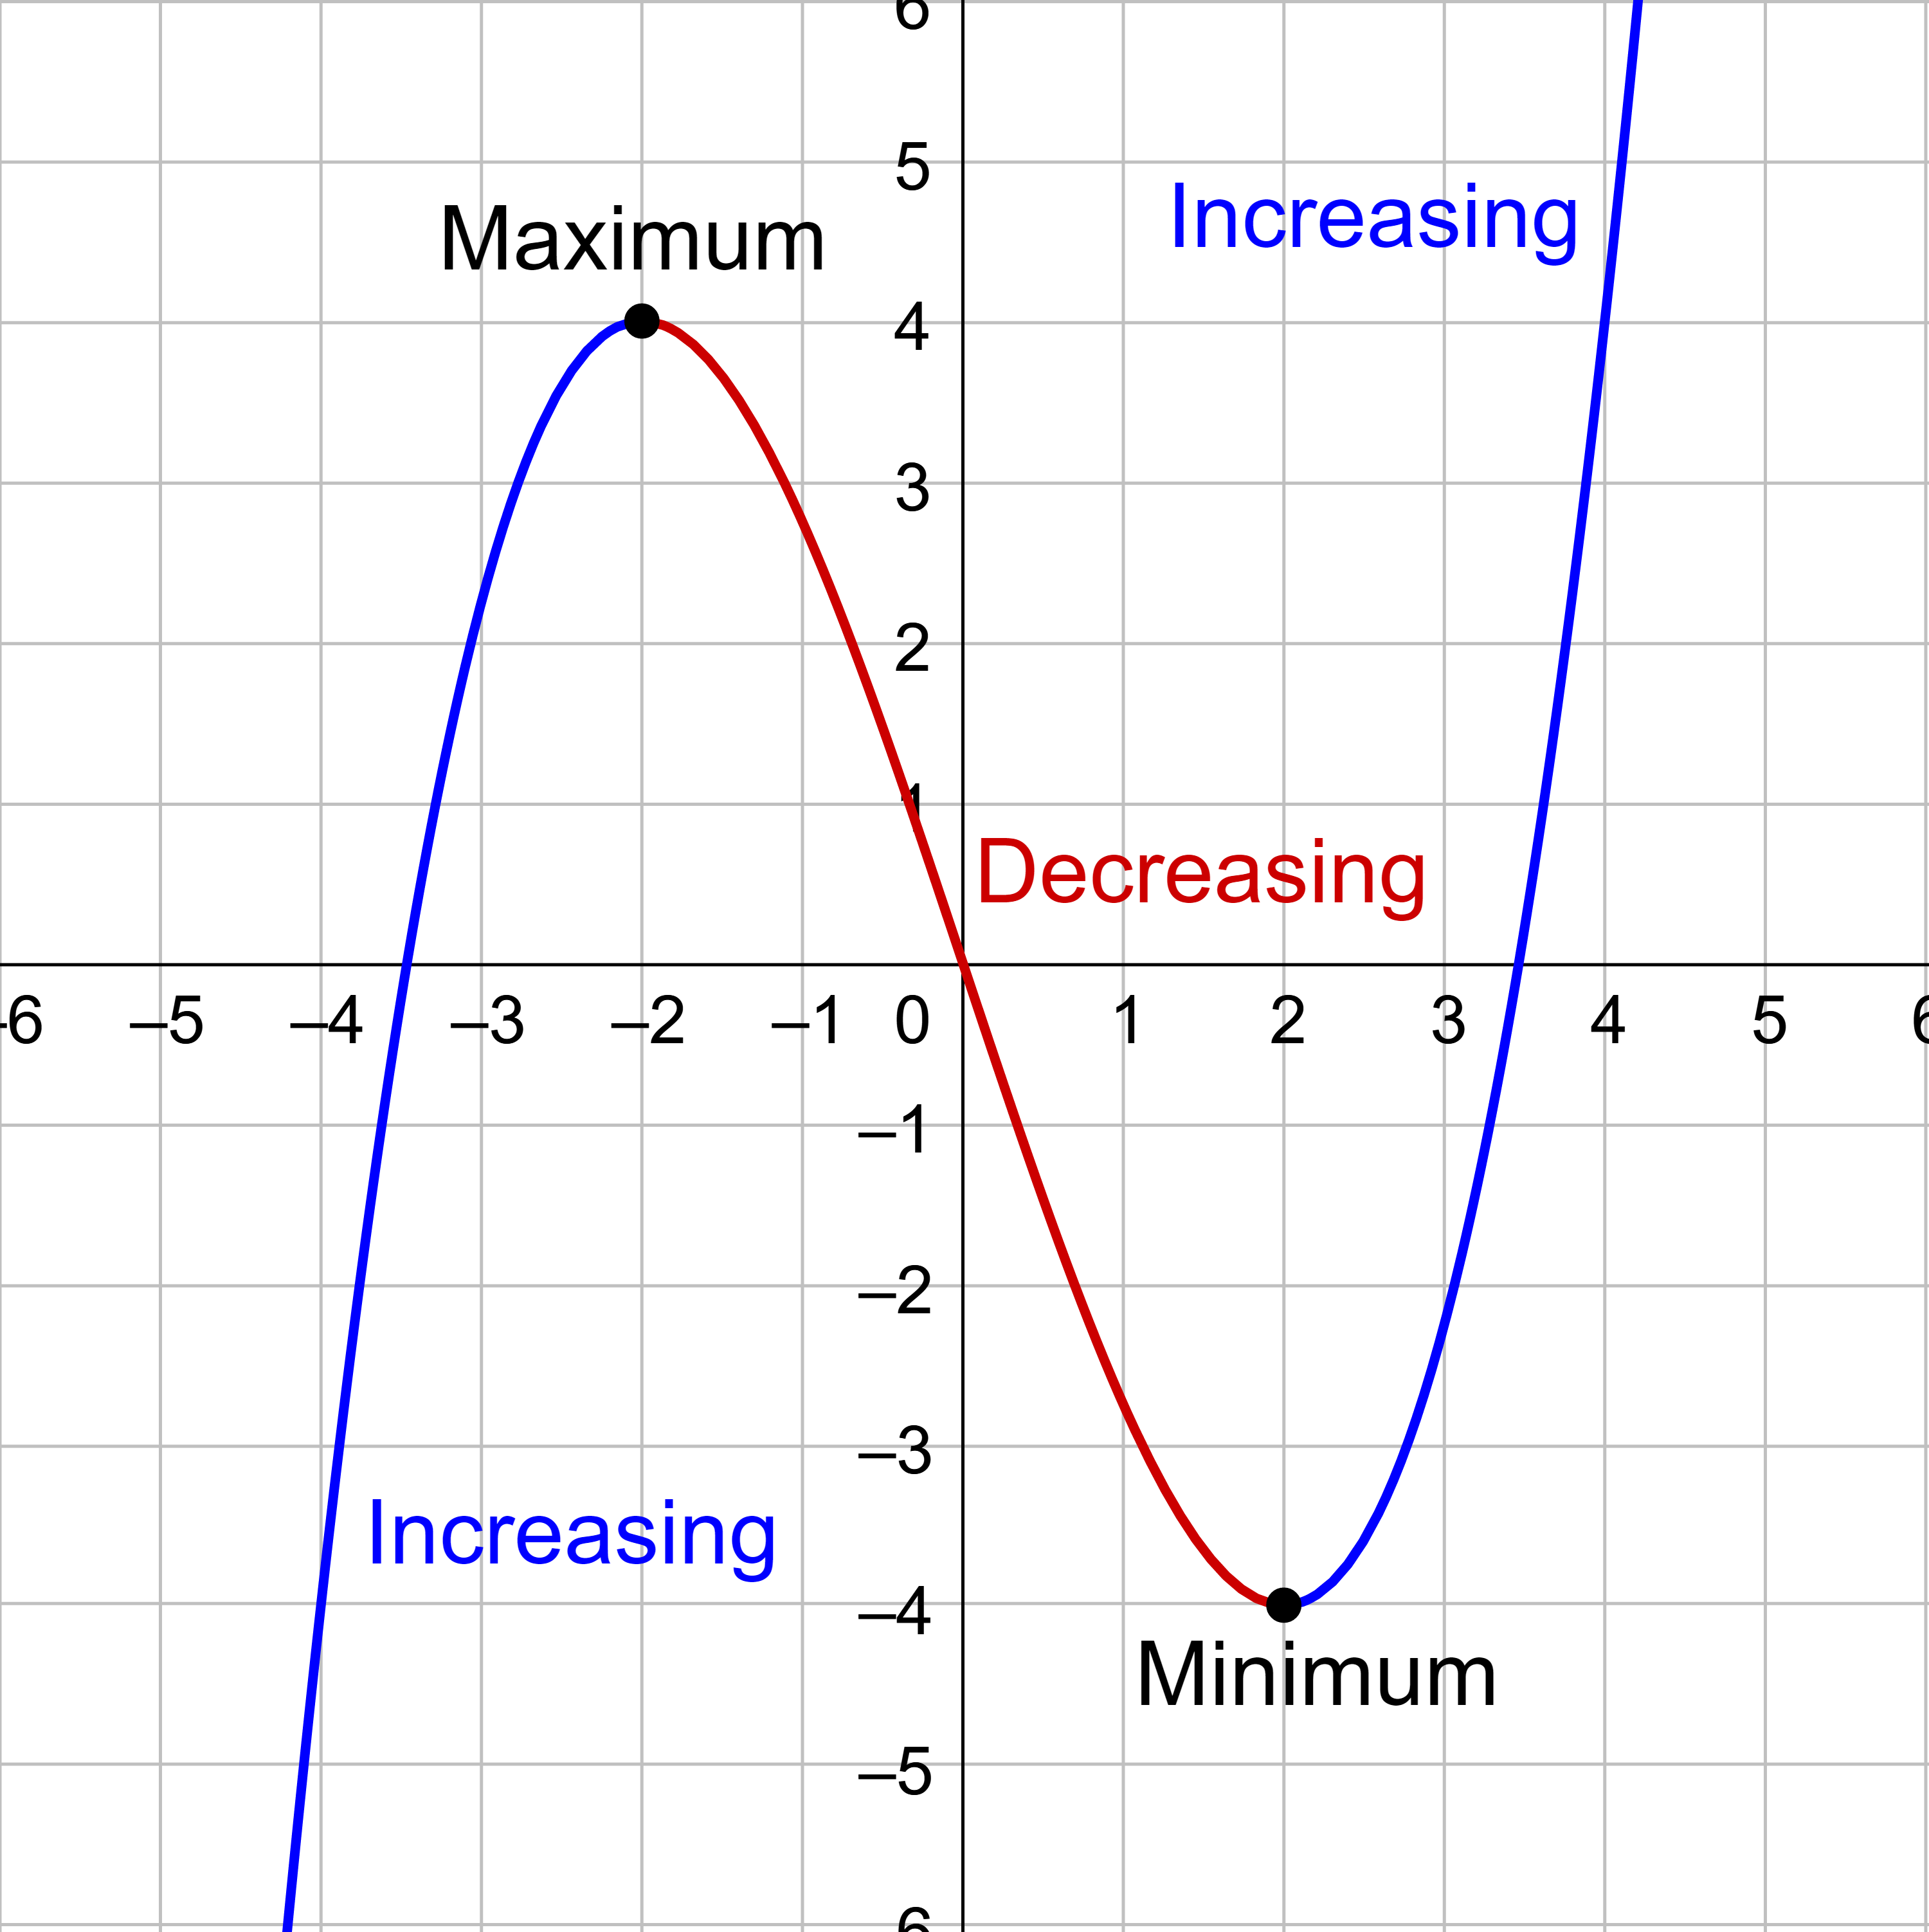
Some functions, such as the one in figure 12, change from increasing to decreasing. This produces the highest point in the area called a local maximum. Likewise, when a function changes from decreasing to increasing, it produces the lowest point in the area called a local minimum. Local maximums and minimums are called extrema. If a function is neither increasing or decreasing, then it is constant and graphs a horizontal line.
For the function whose graph is shown in figure 13, the local maximum is 4, and it occurs at x = −2. The local minimum is −4 and it occurs at x = 2.
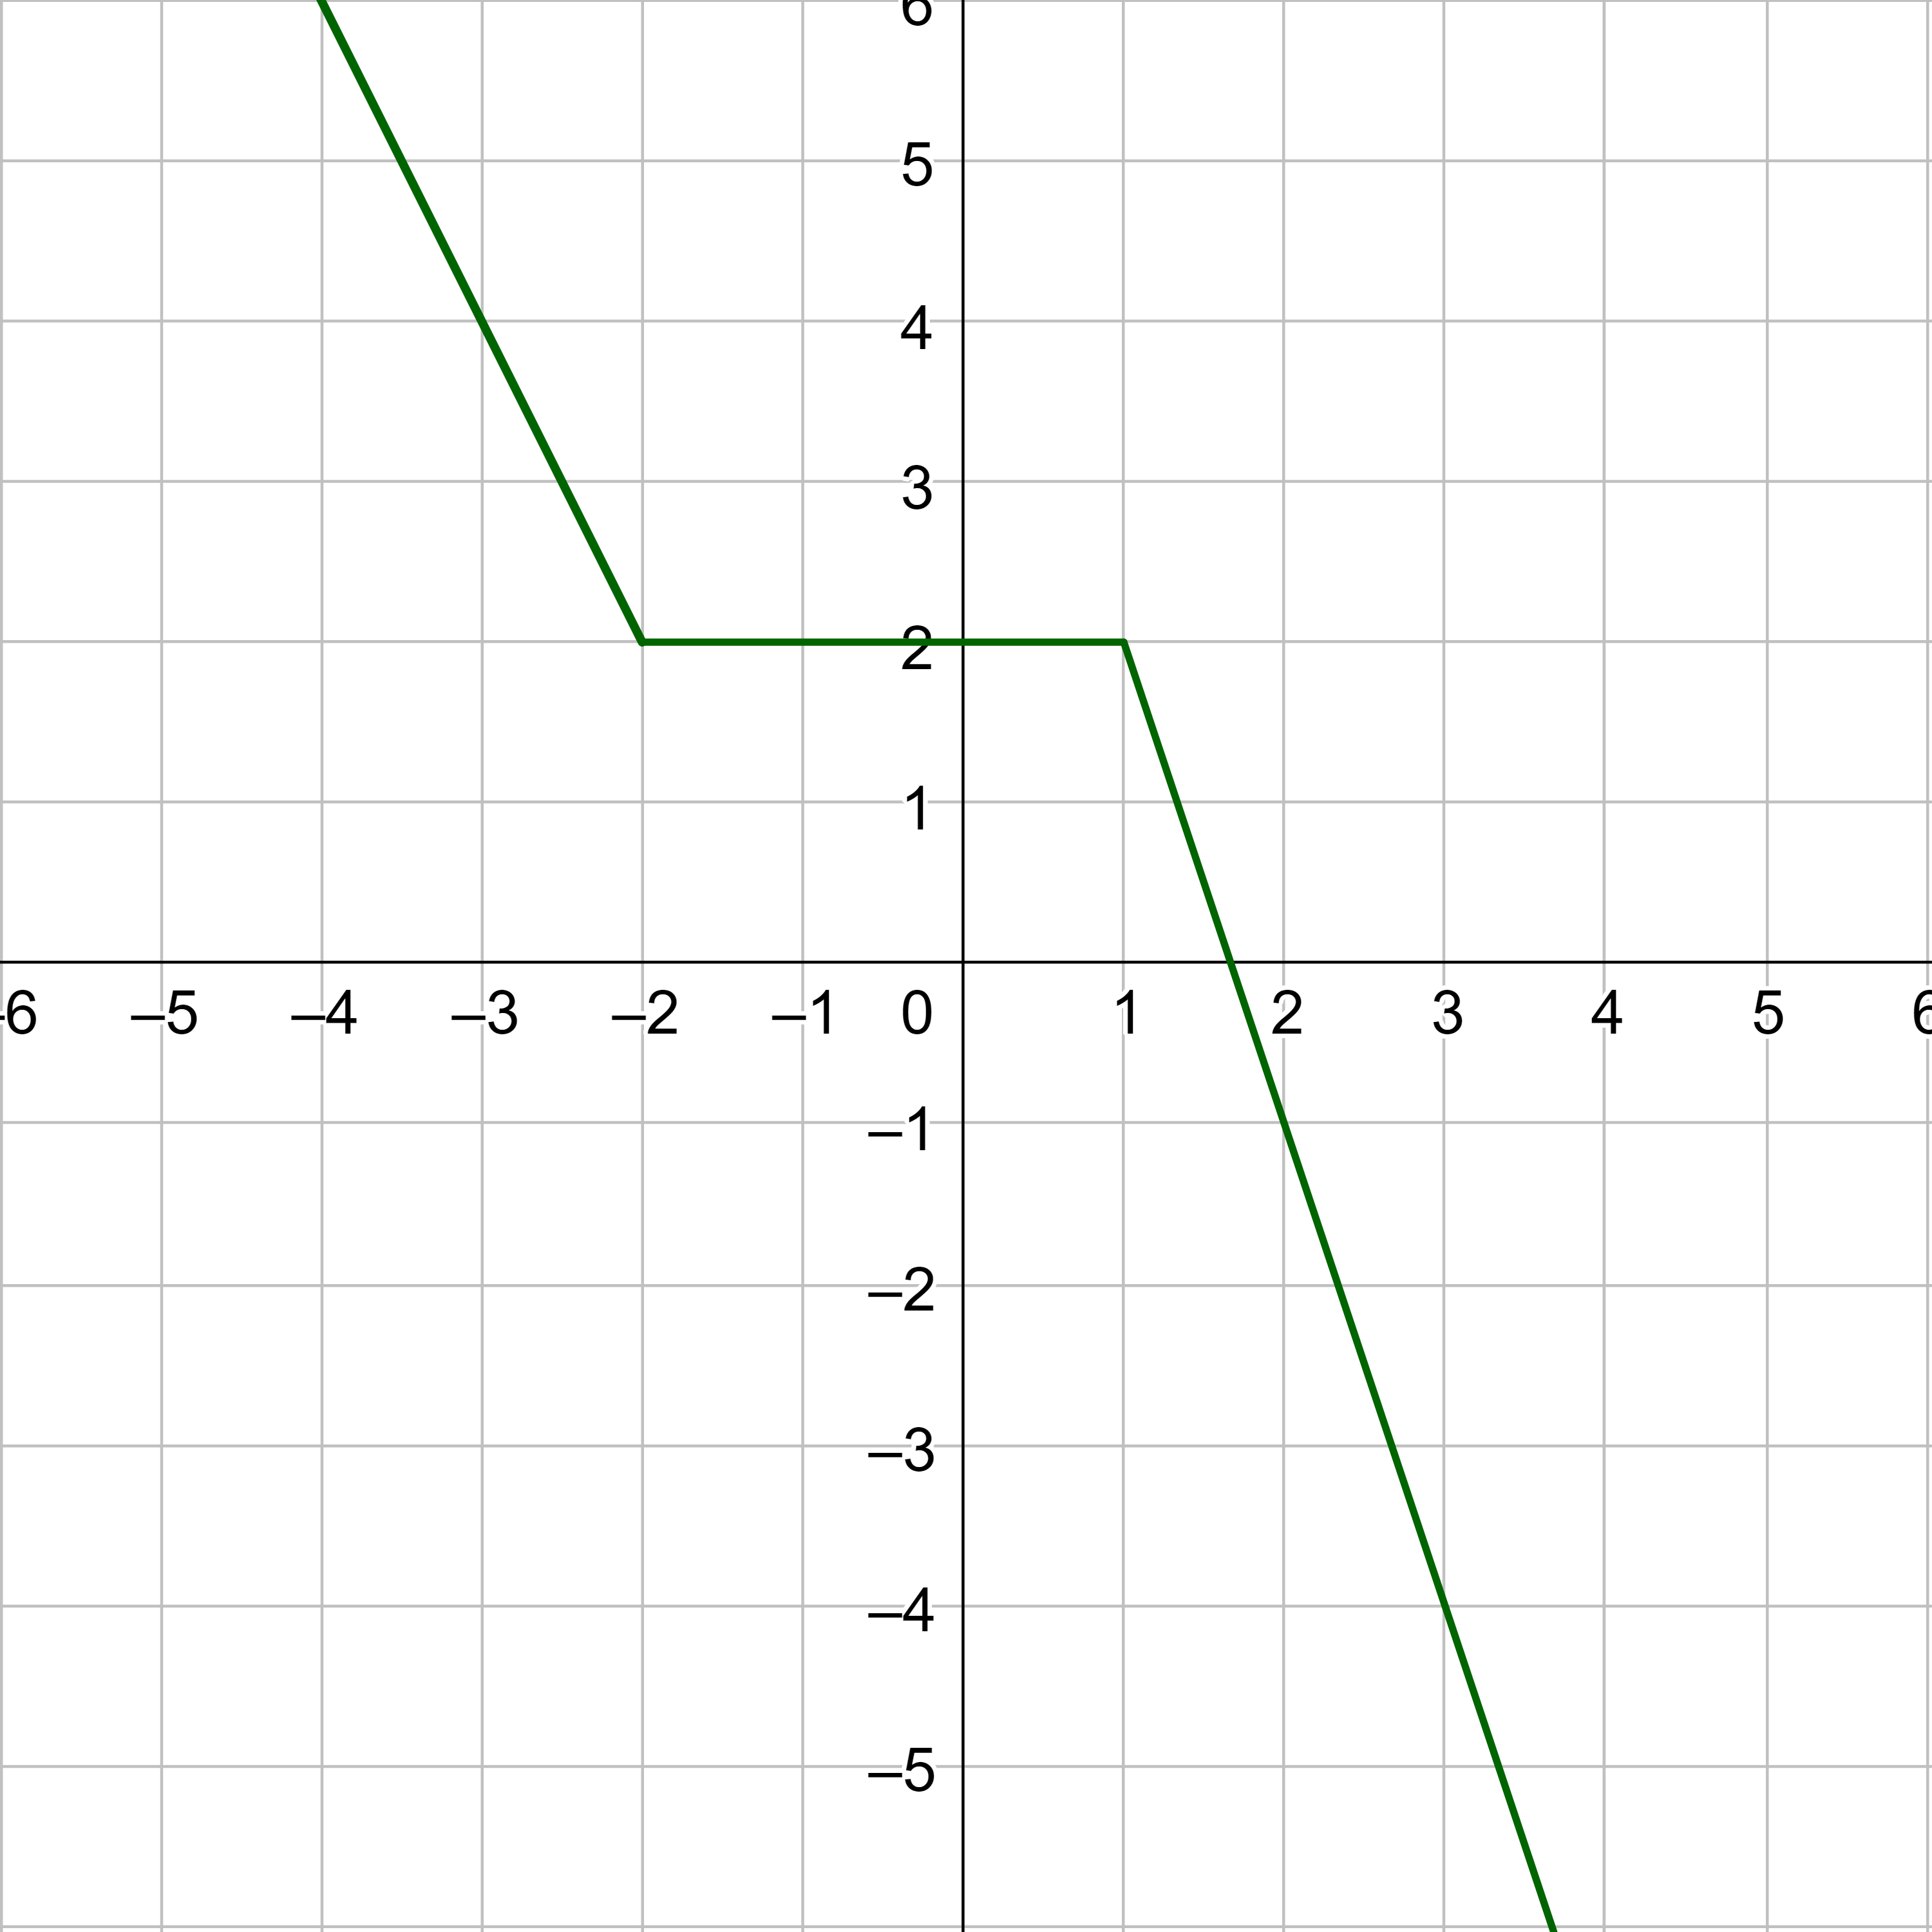
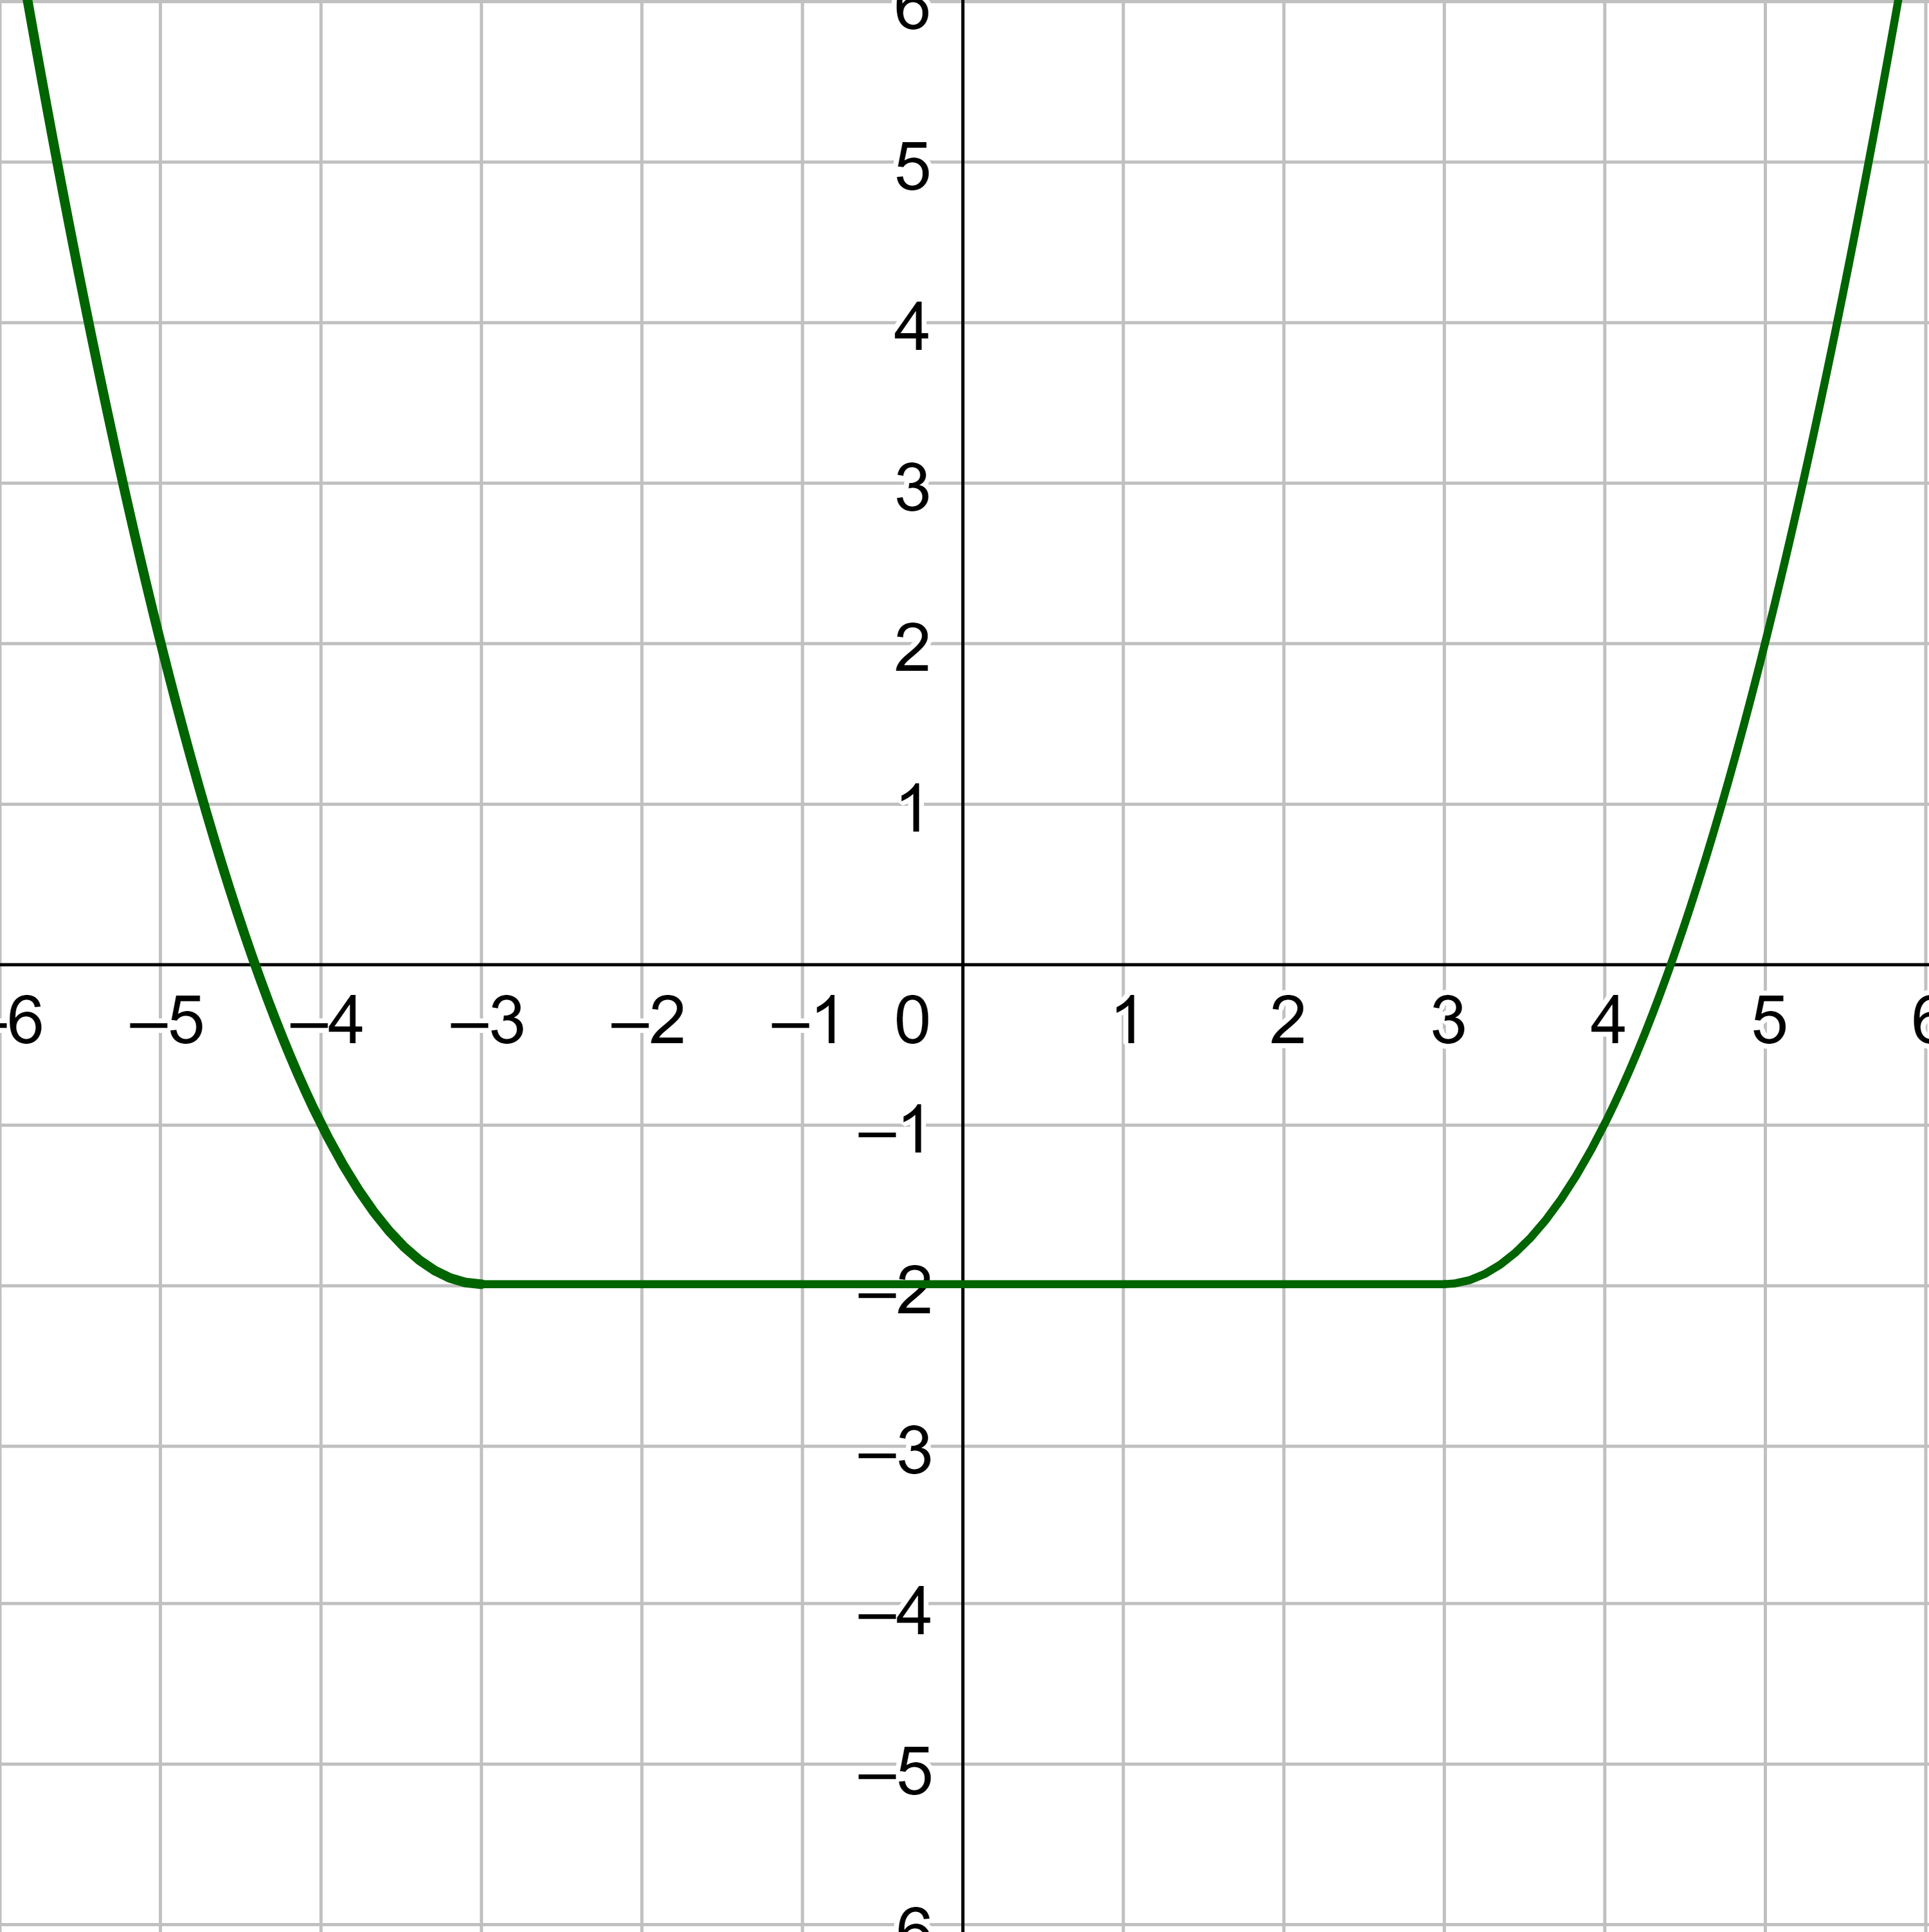
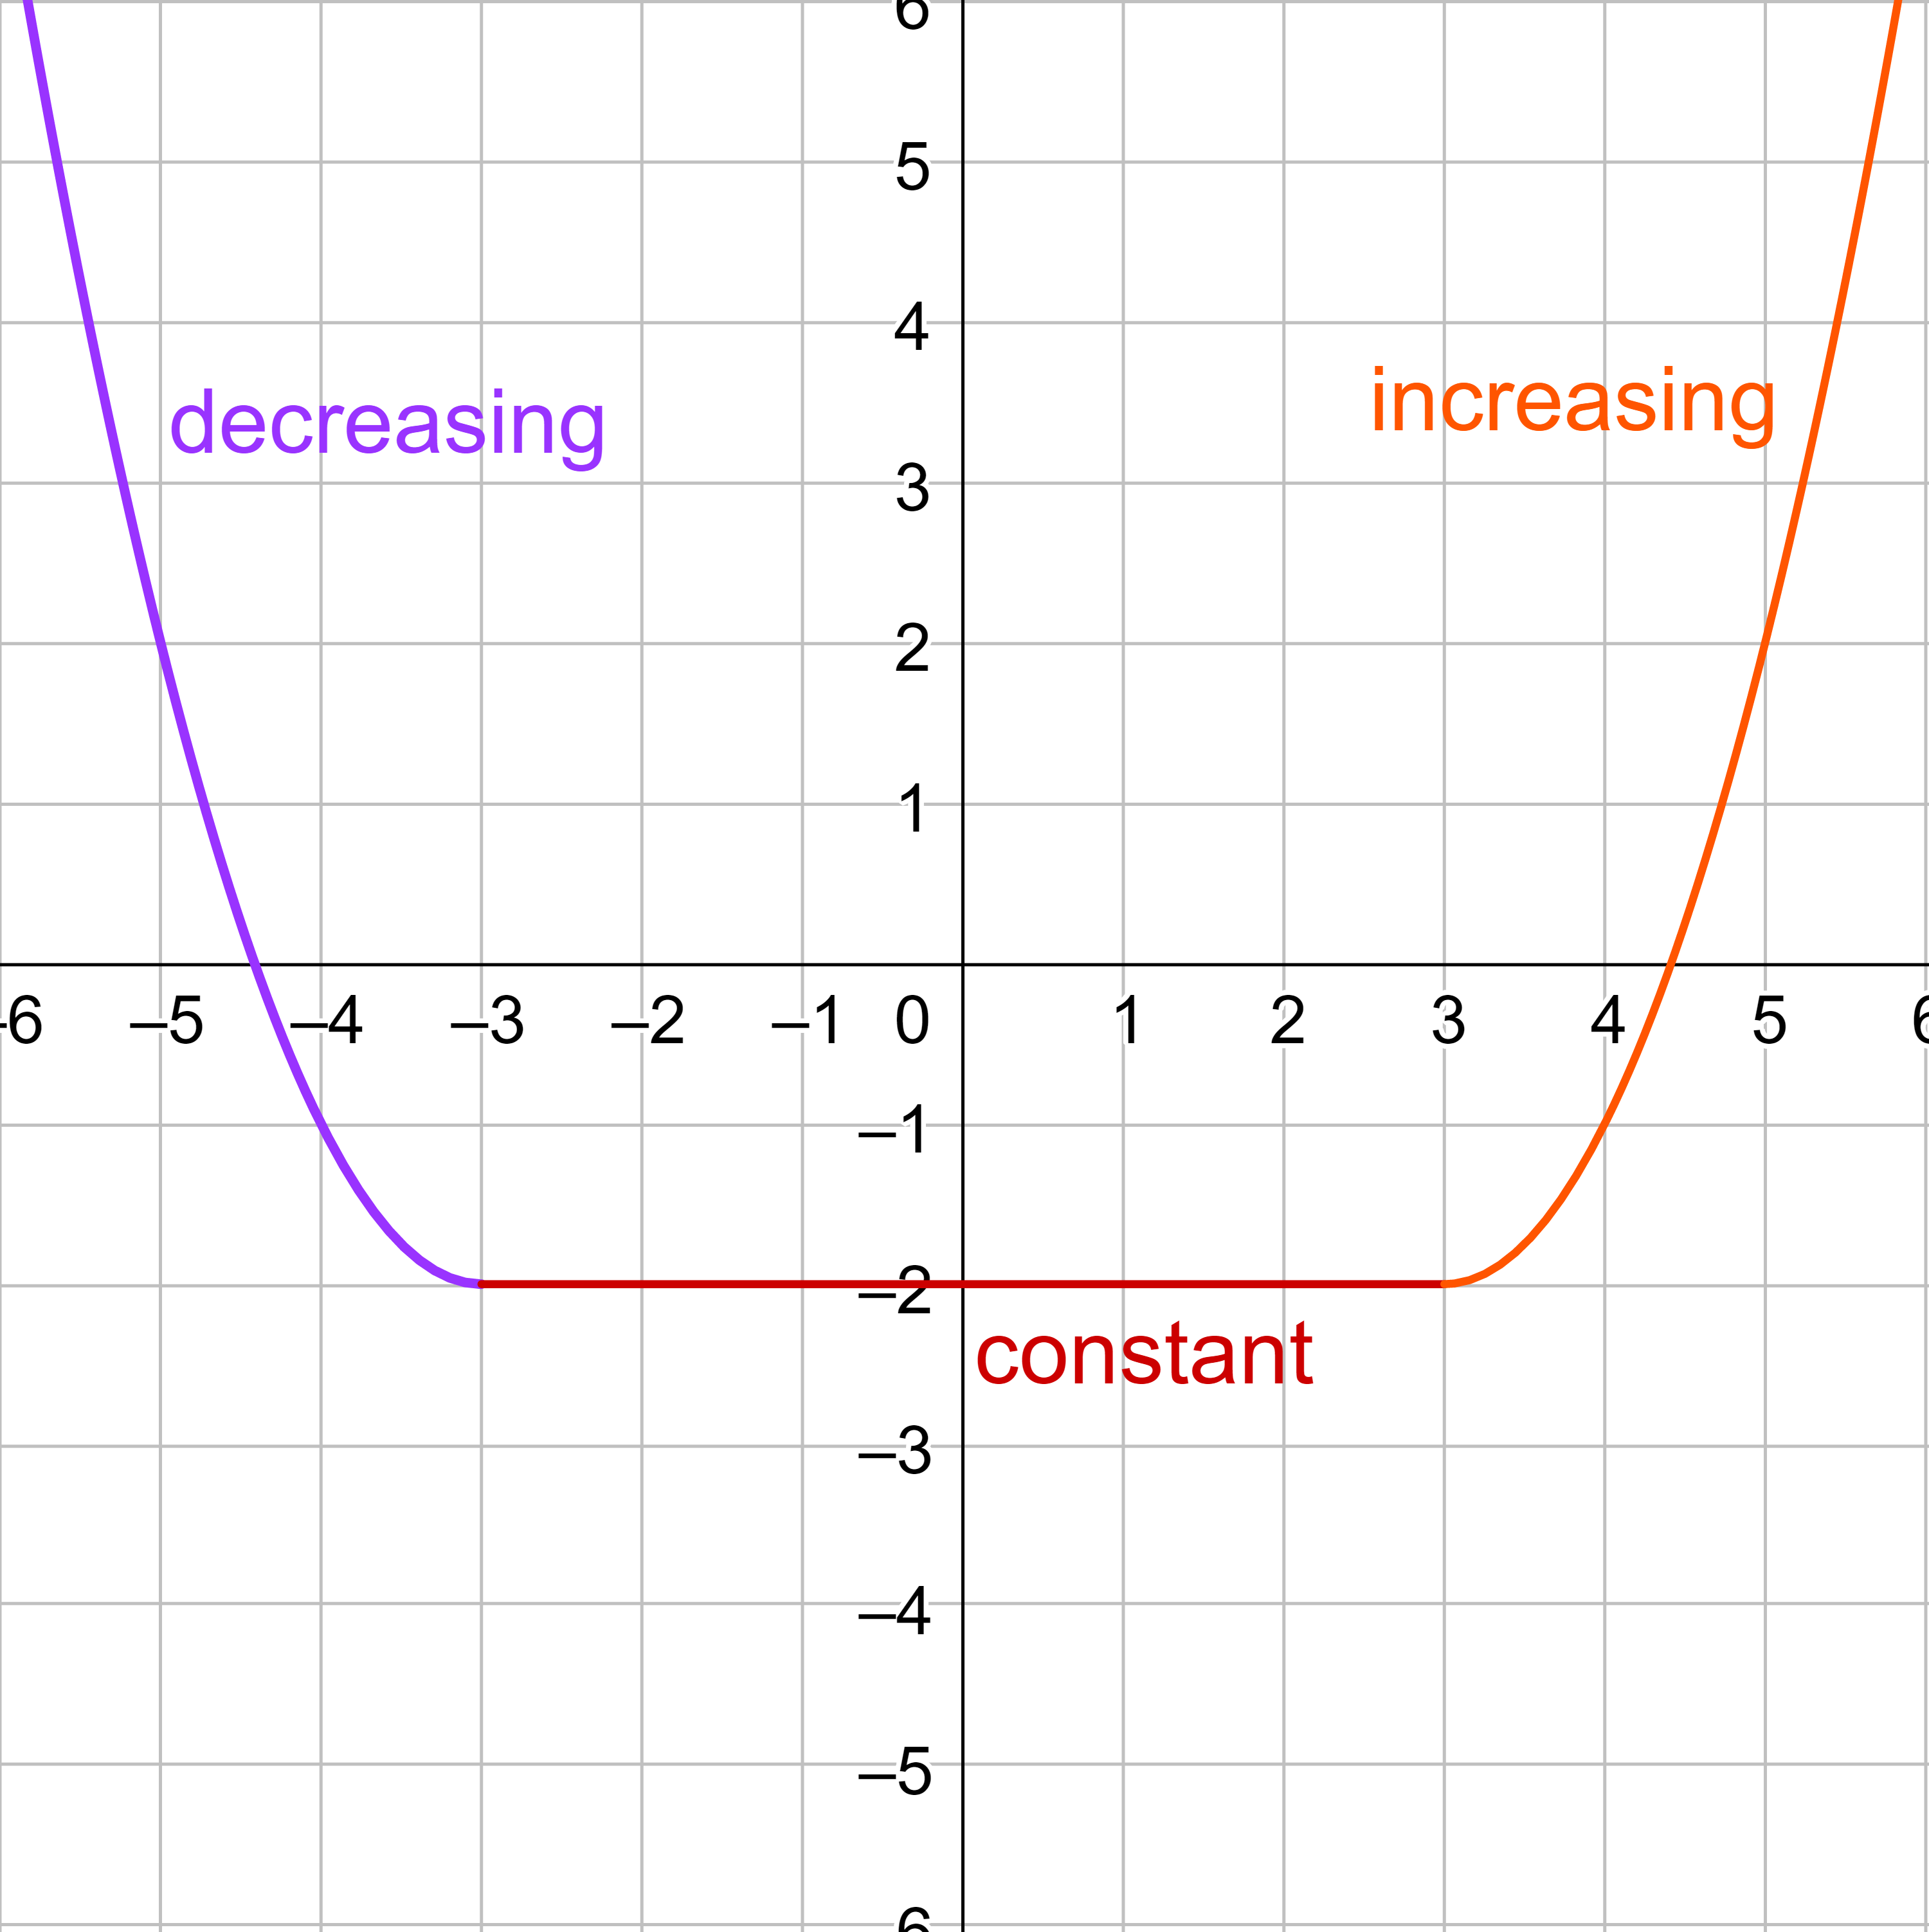
Identify the intervals on which the function appears to be increasing and decreasing.
Solution
The function appears to be three parts: the left part that slopes down, the middle horizontal part, and the right part that slopes up. Therefore, in interval notation, the function decreases on (−∞, −3), is constant on (−3, 3), and increases on (3, ∞).
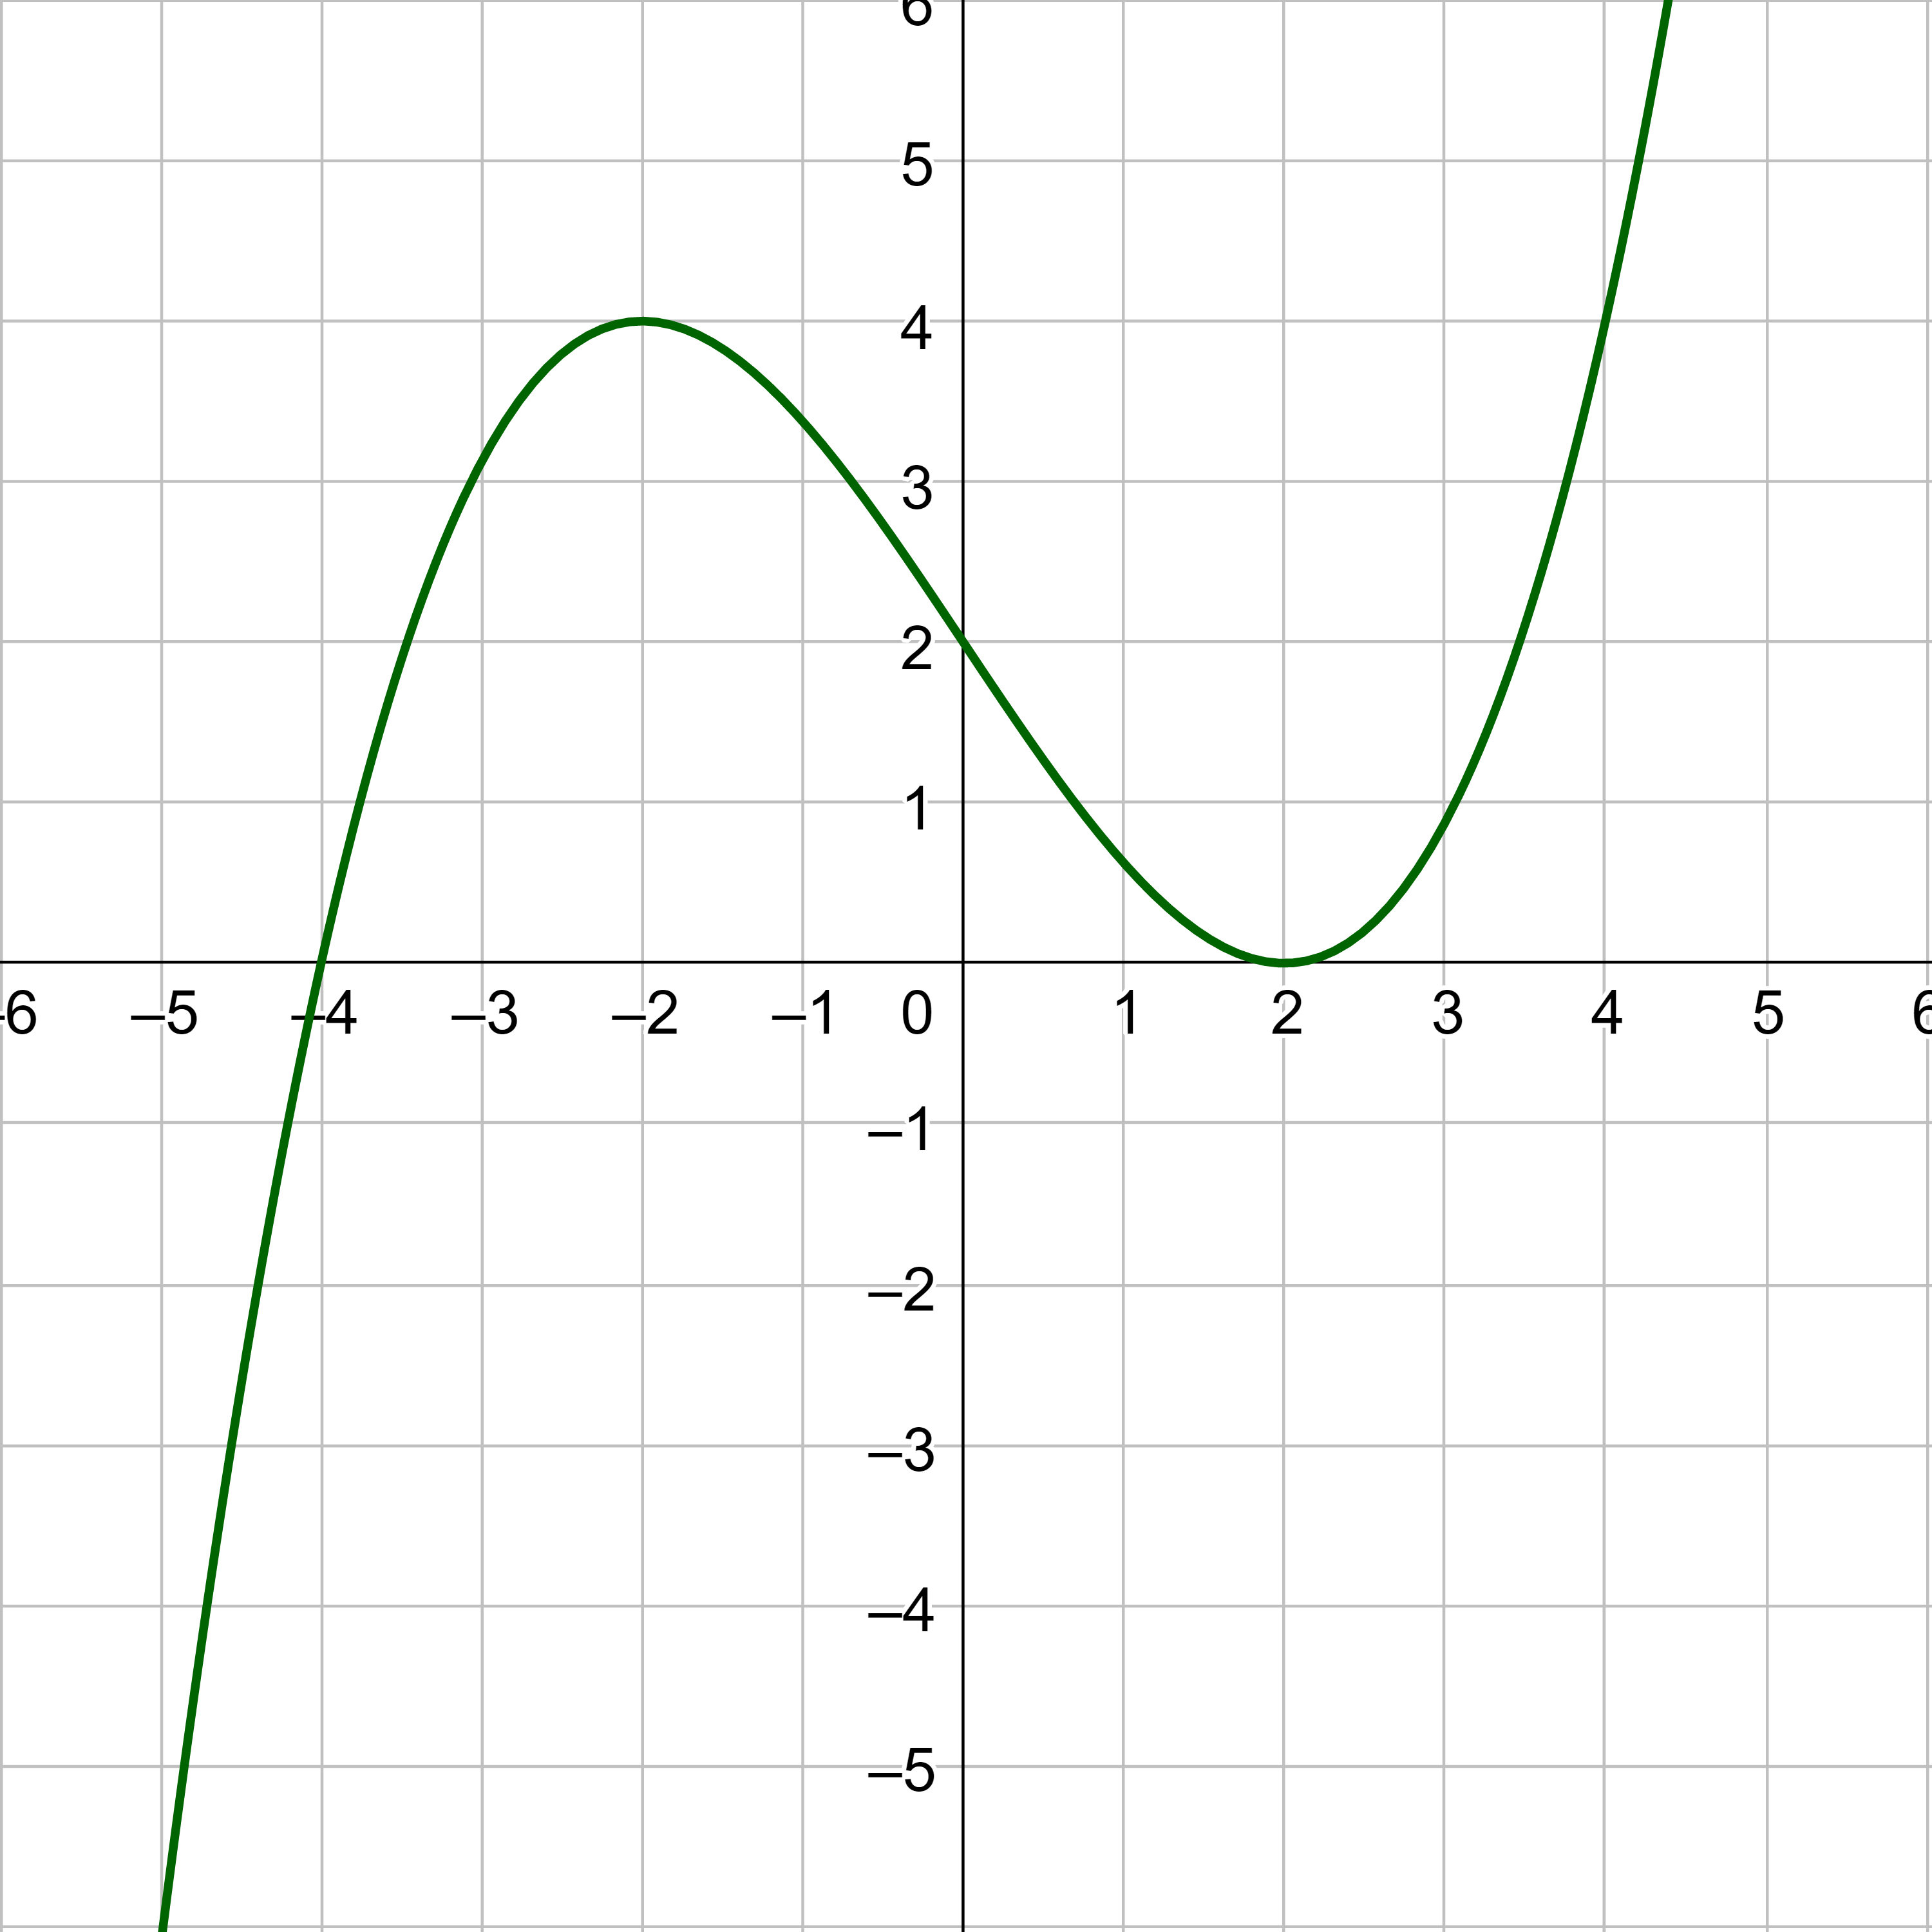
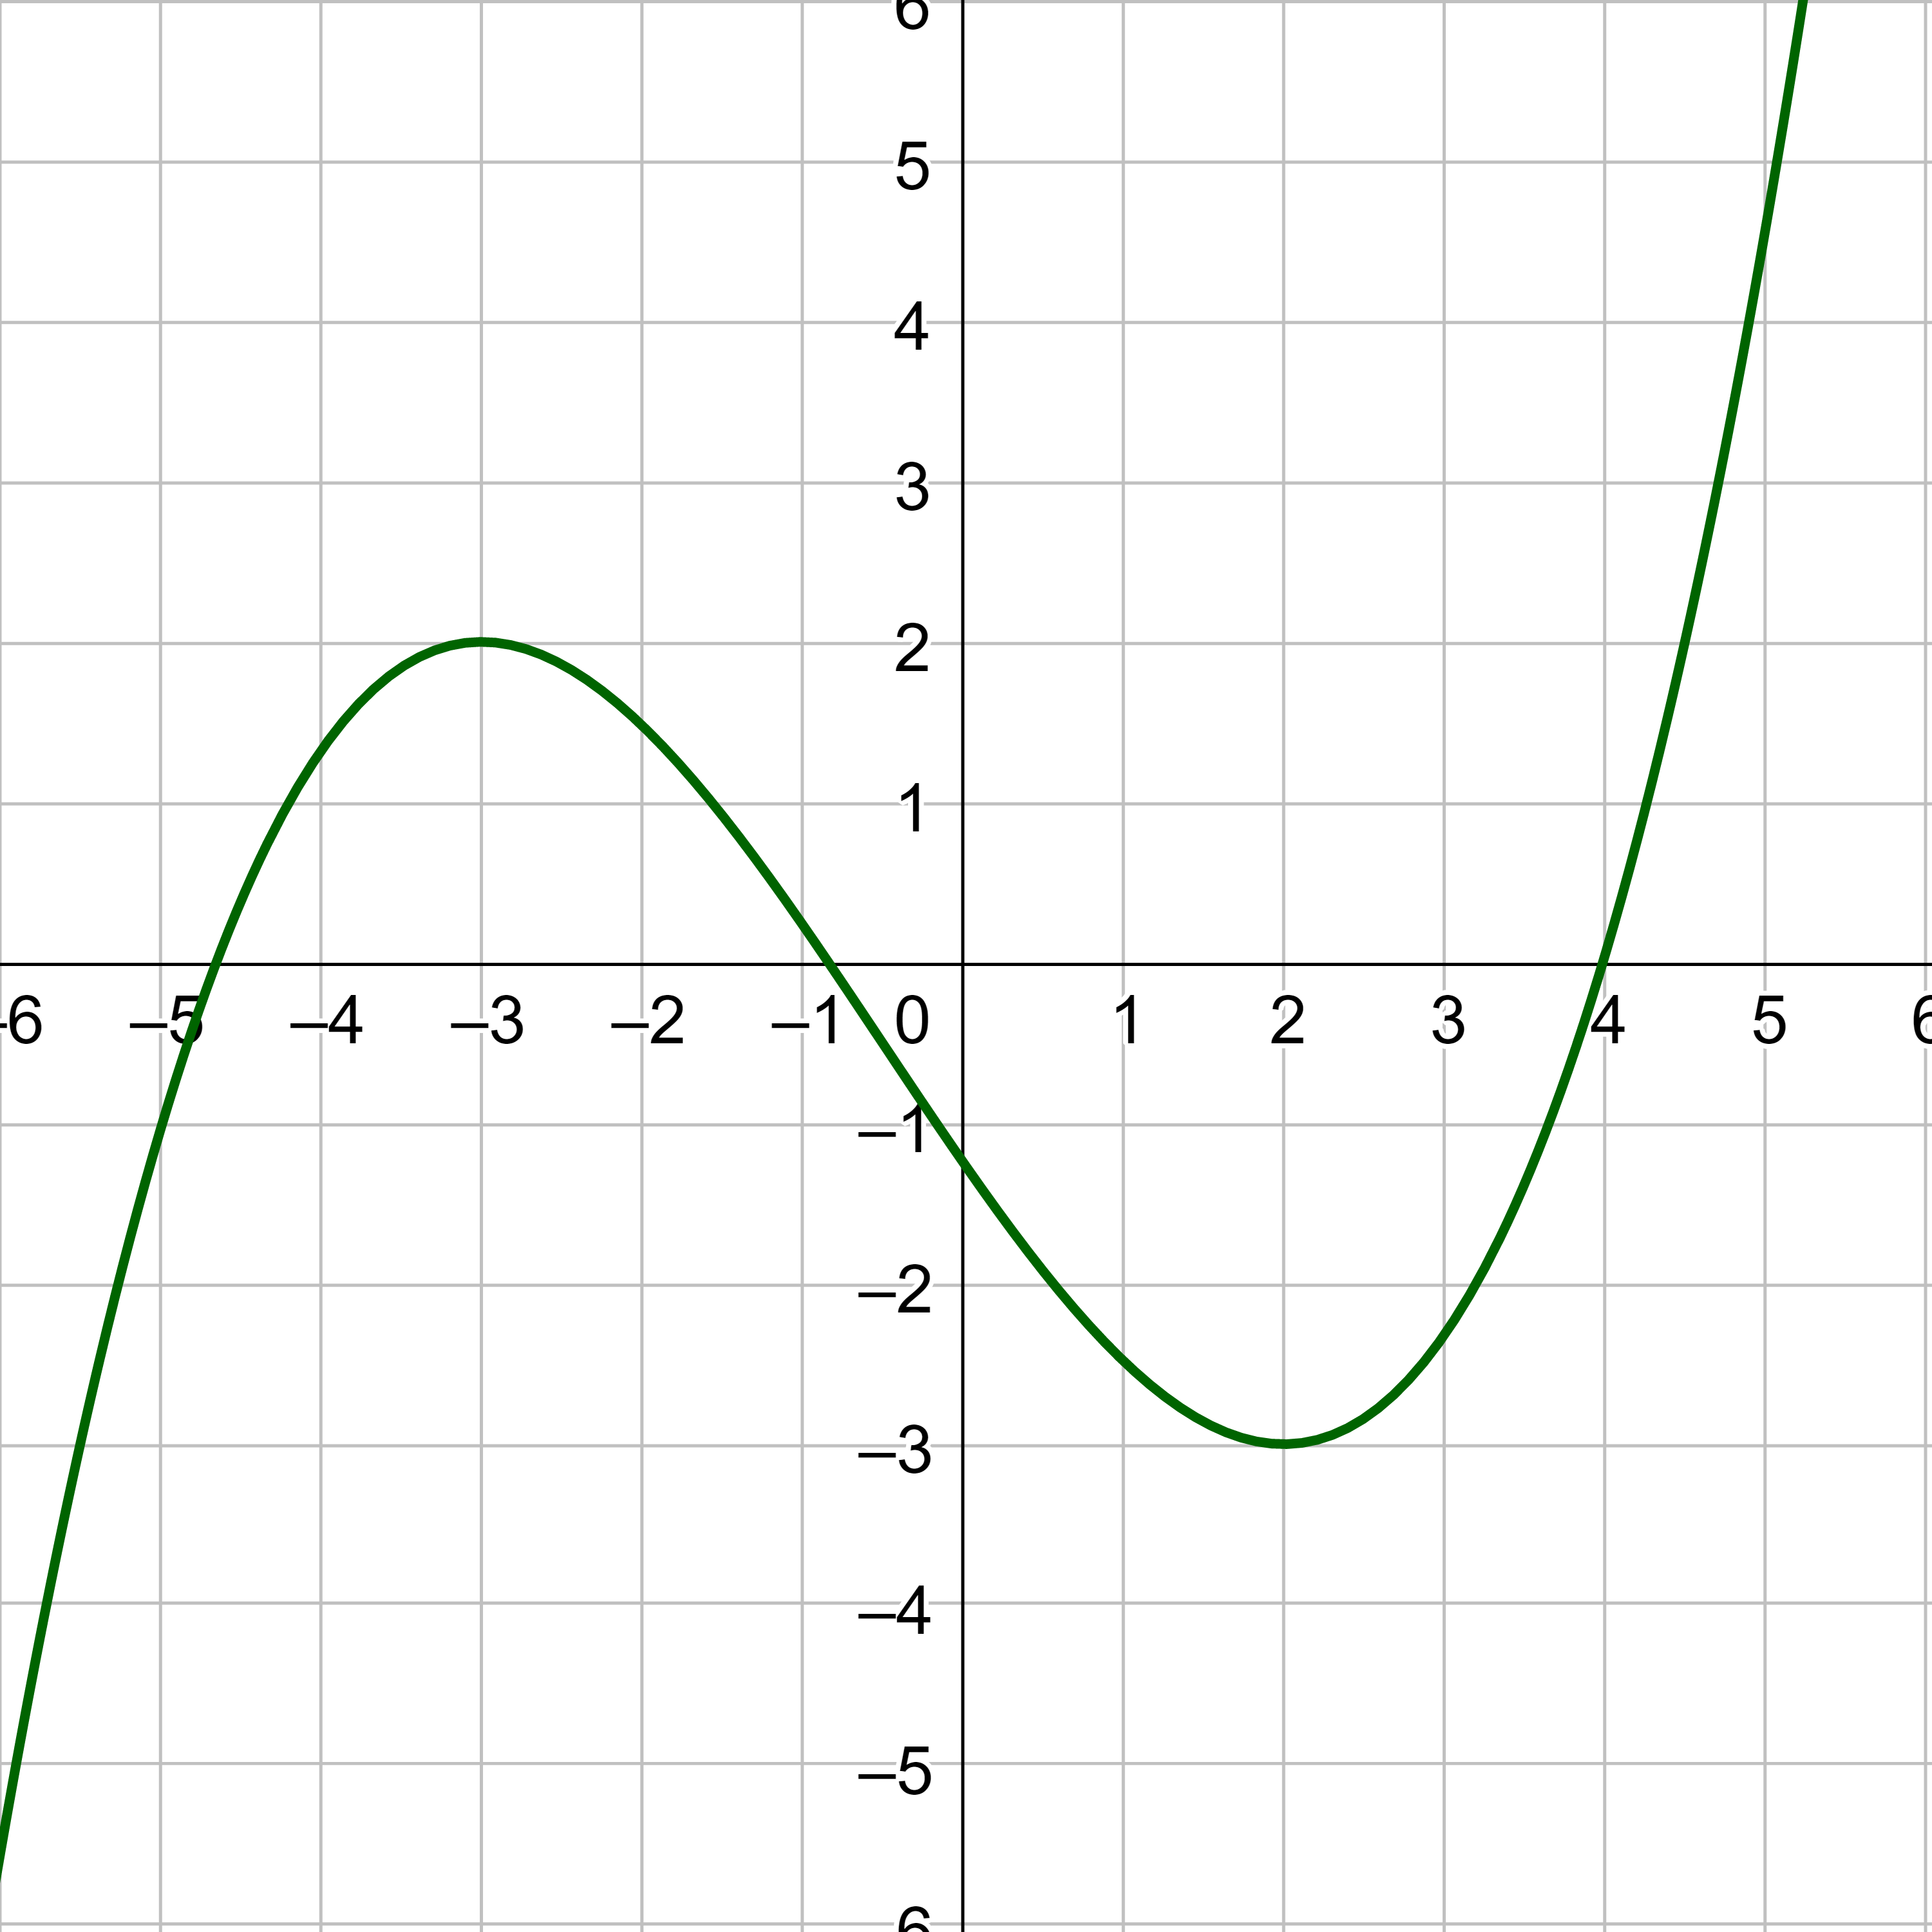
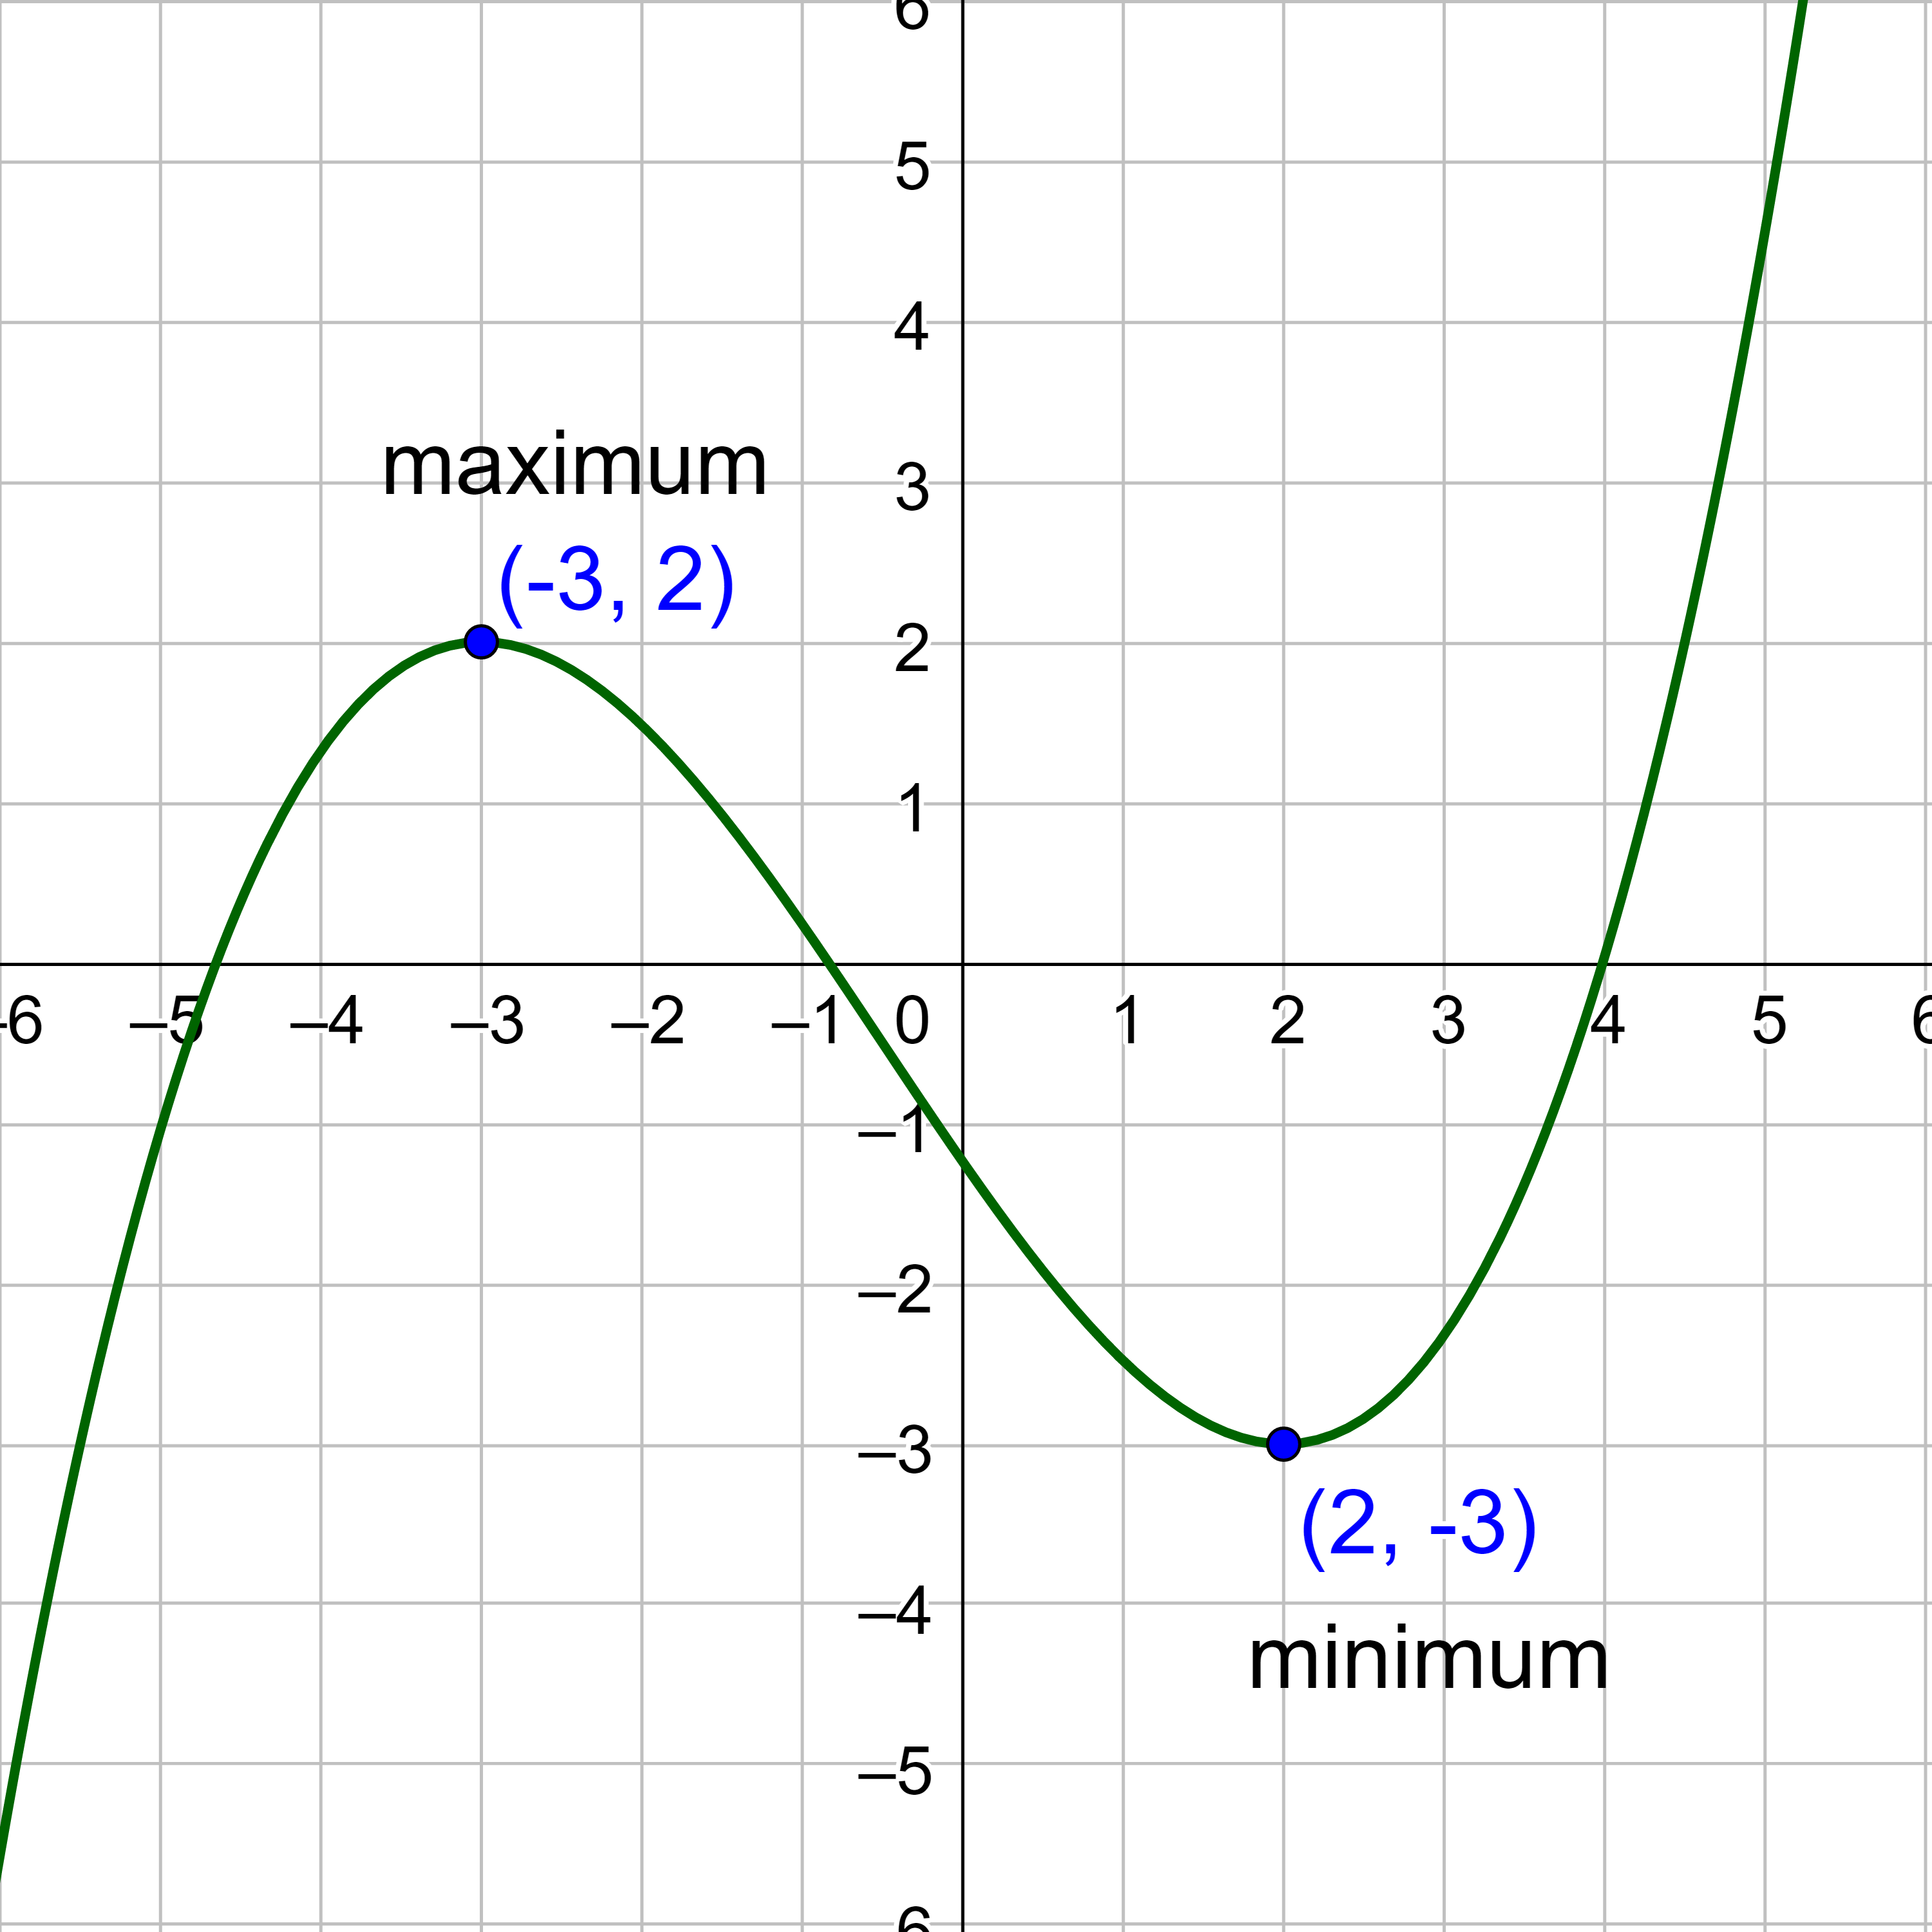
Find all local maximums and minimums.
Solution
The maximums are the highest points in the area. For this graph there is only one maximum, and it is (−3, 2).
The minimums are the lowest points in the area. For this graph there is only one minimum, and it is (2, −3).
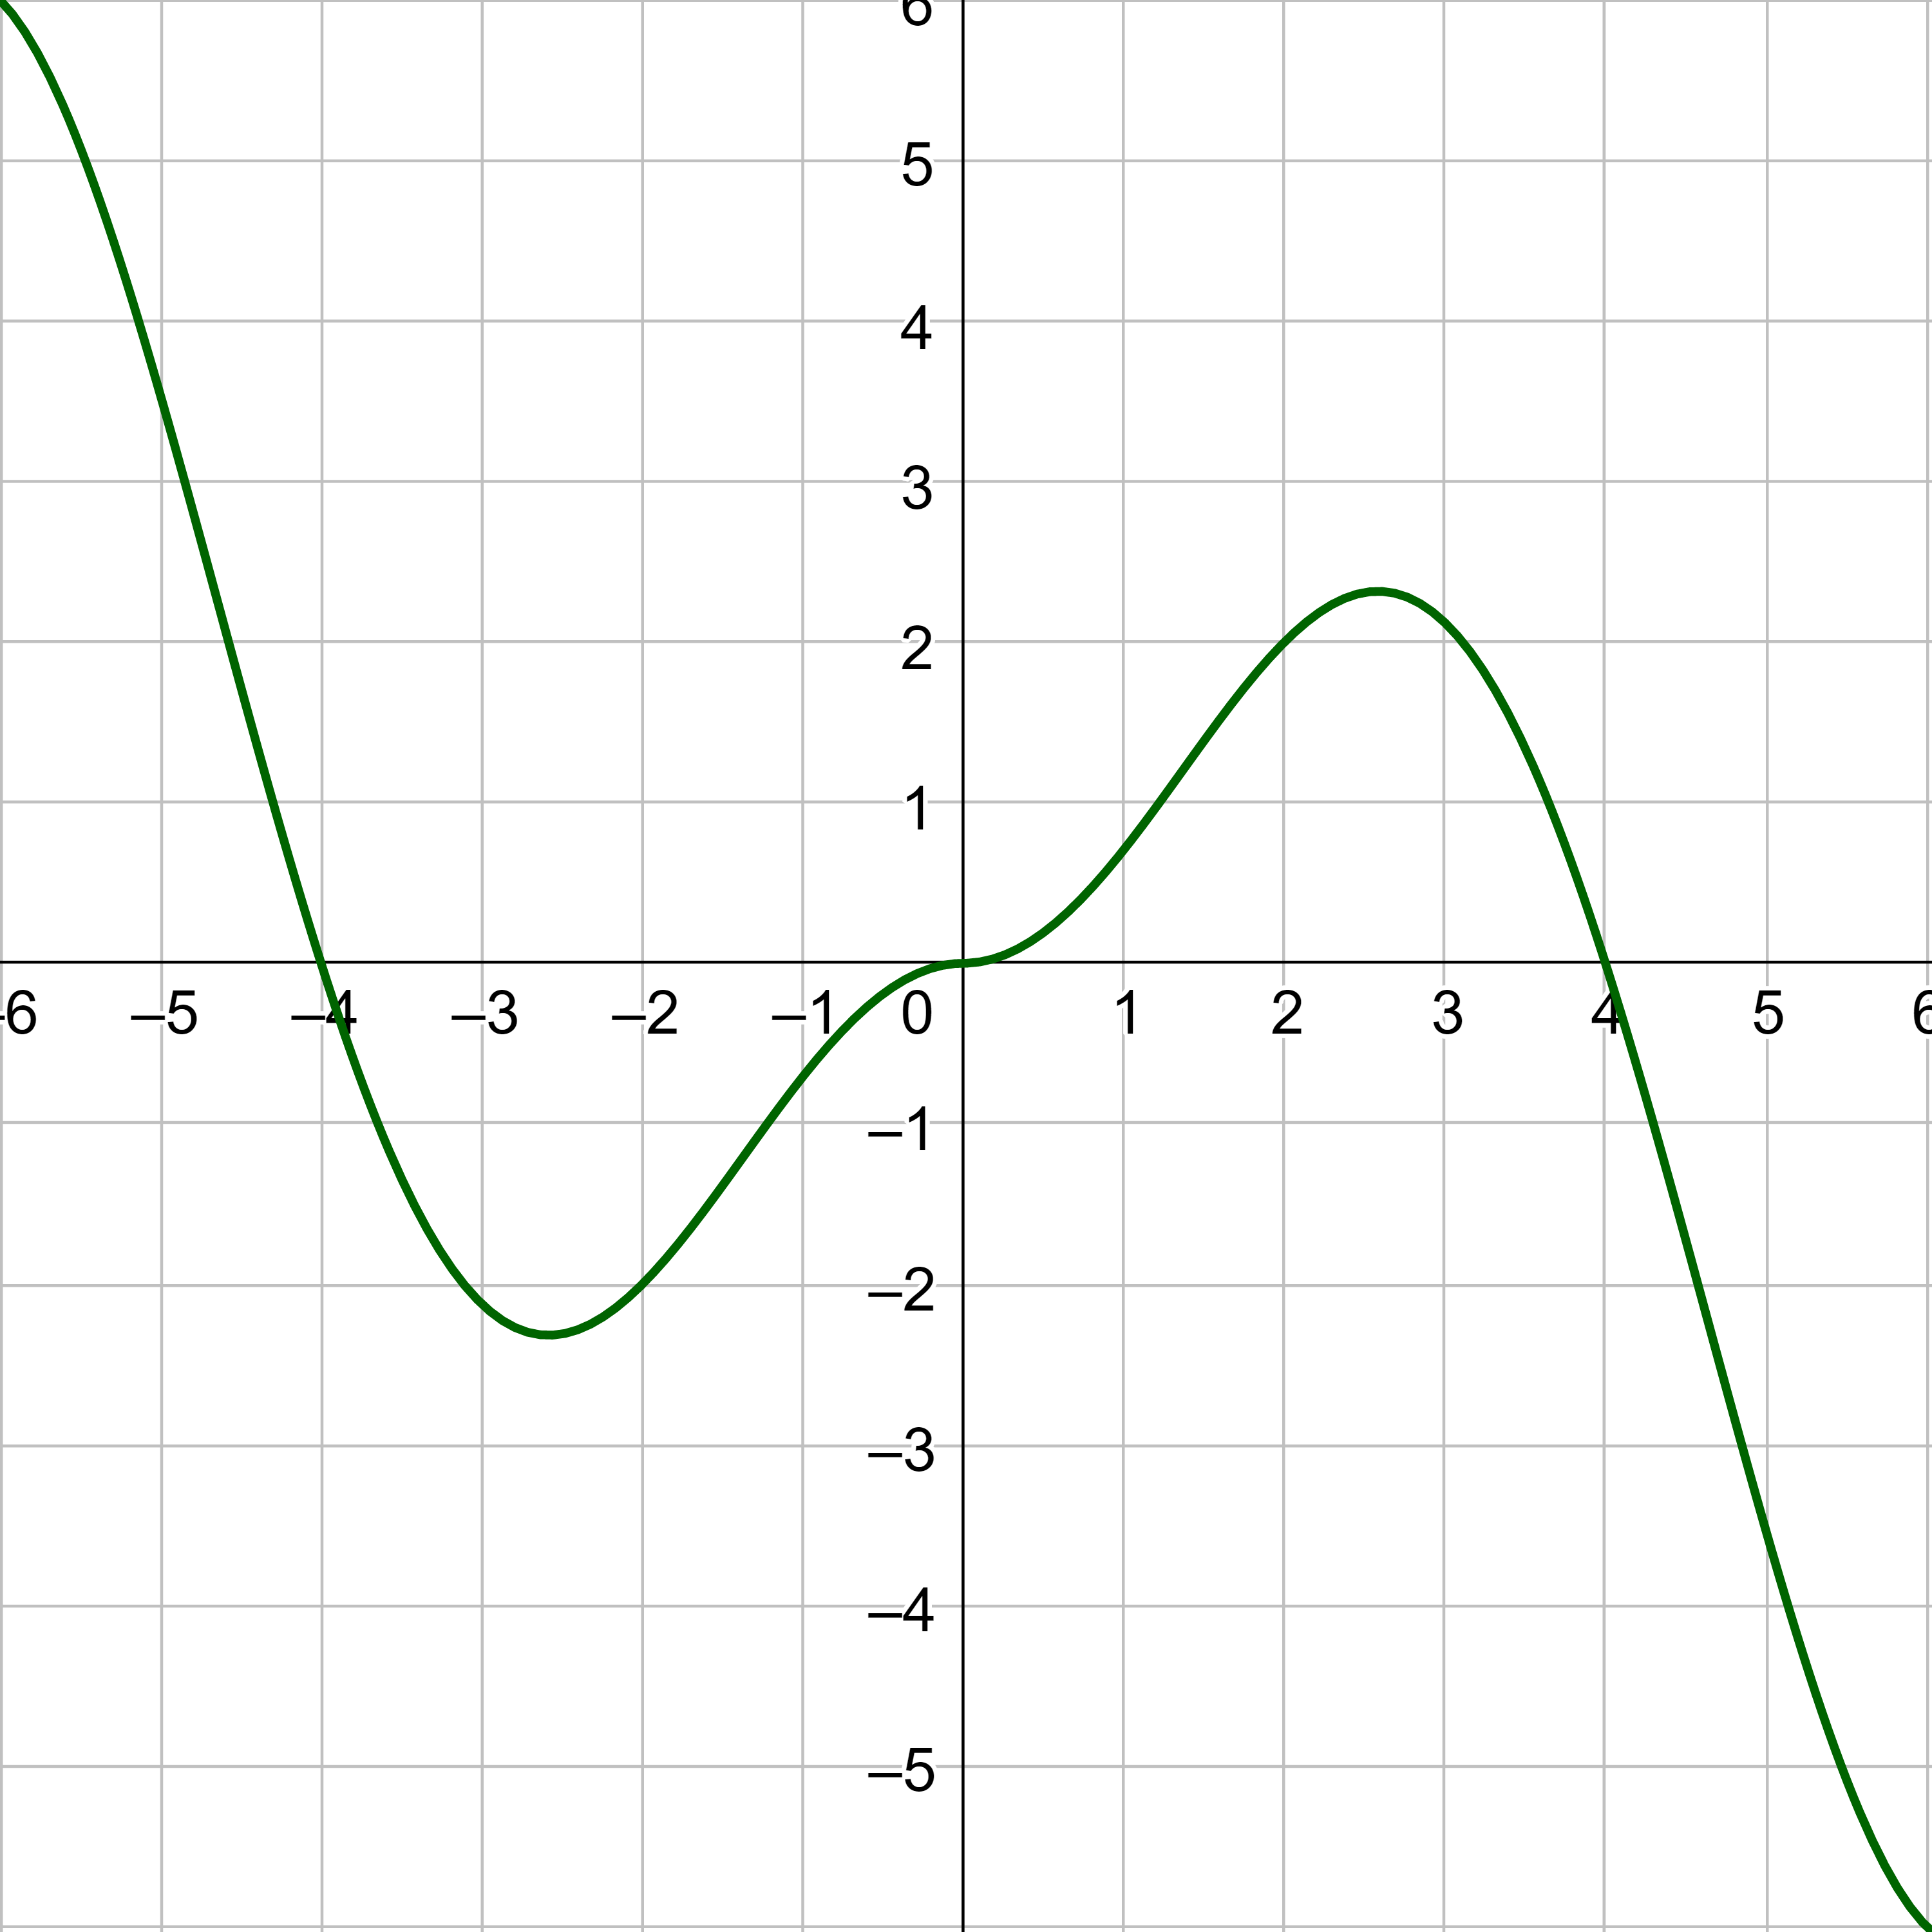
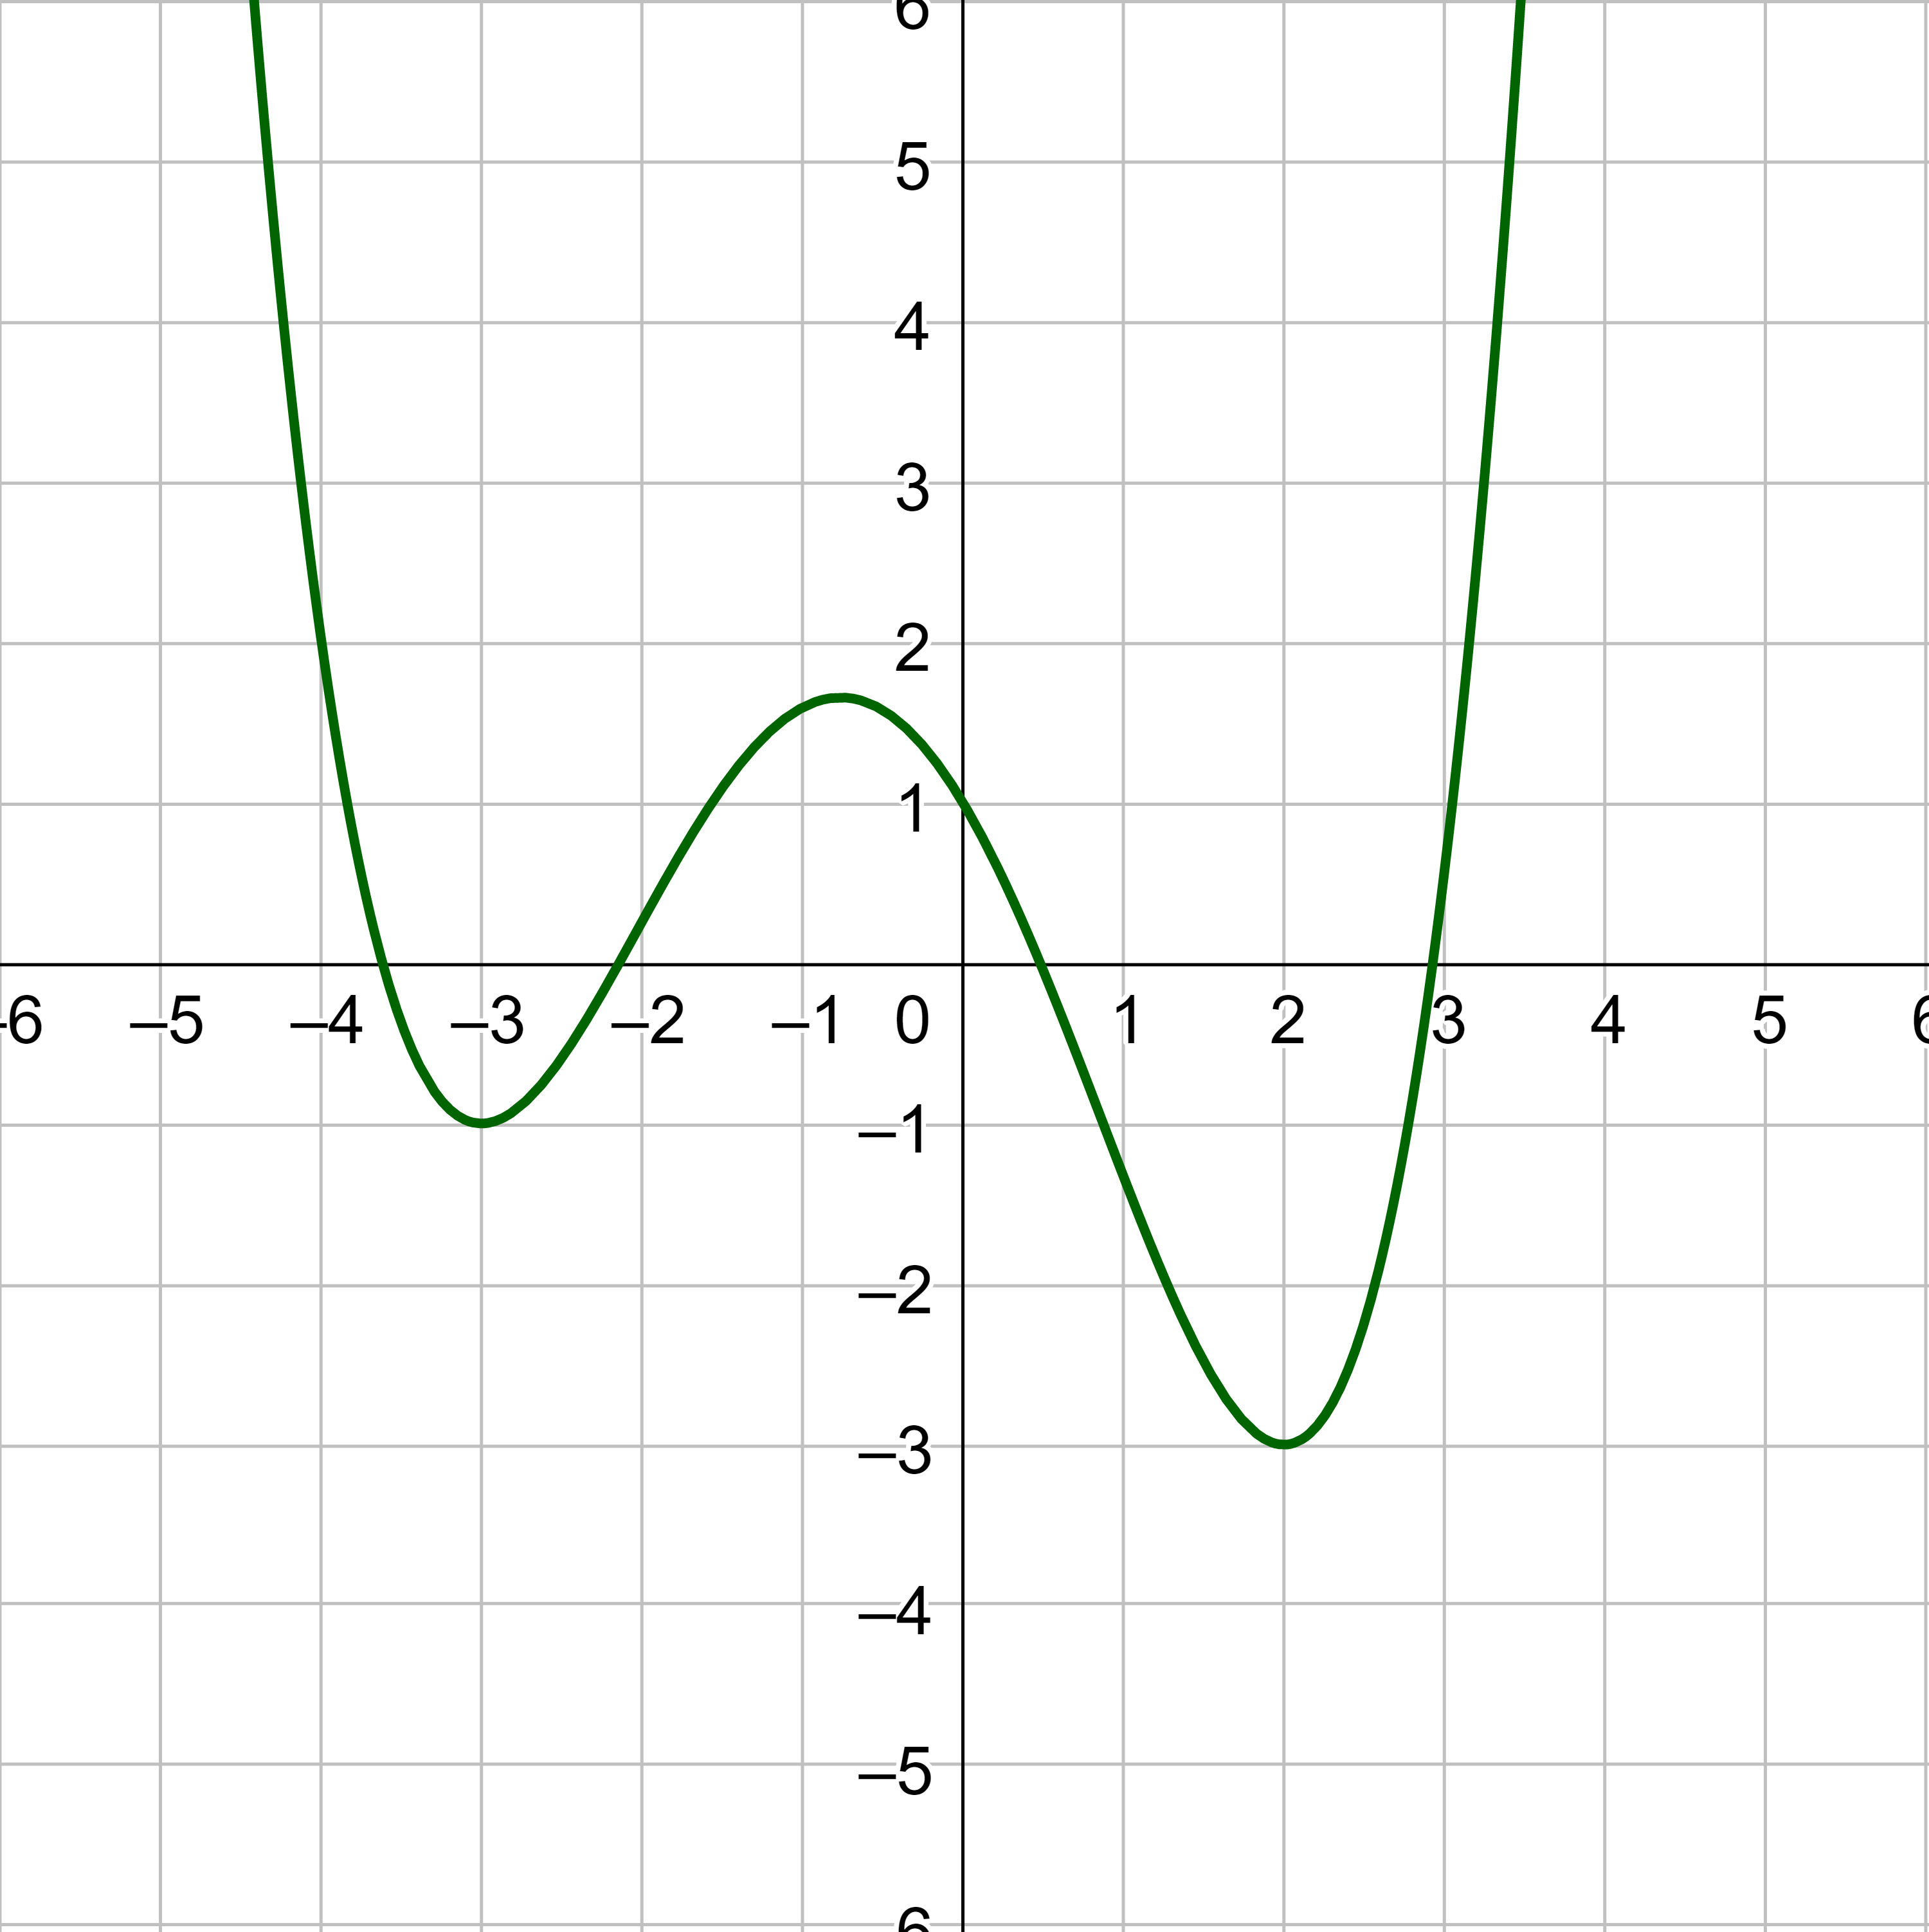
(a) Identify the intervals on which the function in the graph appears to be increasing and decreasing. (b) Find all the local maxima and minima.
Answer
Increasing: (−3, −0.76) ∪ (2, ∞); Decreasing: (−∞, −3) ∪ (−0.76, 2); Maximum: (−0.76, 1.65); Minimum: (−3, −1), (2, −3)
The zeros of a function, f(x), are the x-values for which f(x) = 0.
Helpful videos about this lesson.