Precalculus by Richard Wright

Previous Lesson Table of Contents Next Lesson

Are you not my student and
has this helped you?

This book is available
to download as an epub.


Jesus looked at them and said, “With man this is impossible, but with God all things are possible.” Matthew‬ ‭19‬:‭26‬ ‭NIV‬‬‬‬‬

8-05 Systems of Inequalities

Mr. Wright teaches the lesson.

Summary: In this section, you will:

SDA NAD Content Standards (2018): PC.6.1

boxes on conveyor belt
Figure 1: Boxes on a conveyor belt. credit (wallpaperflare.com)

Systems of inequalities usually have many solutions. These solutions are often described by a graph. Systems can be used to analyze supply and demand or to find ways to maximize or minimize profits and costs.

To solve systems of inequalities, graph all the inequalities on the same coordinate plane. The solution is the intersection of all the shaded areas of the individual inequalities.

Solve Systems of Inequalities
  1. Graph all the inequalities on the same coordinate plane.
  2. Find the intersection of the shaded areas.
Graph an Inequality
  1. Pretend the inequality sign is = and graph the line.
  2. Decide if the line is solid or dotted
  3. Shade

Example 1: Solve a System of Inequalities

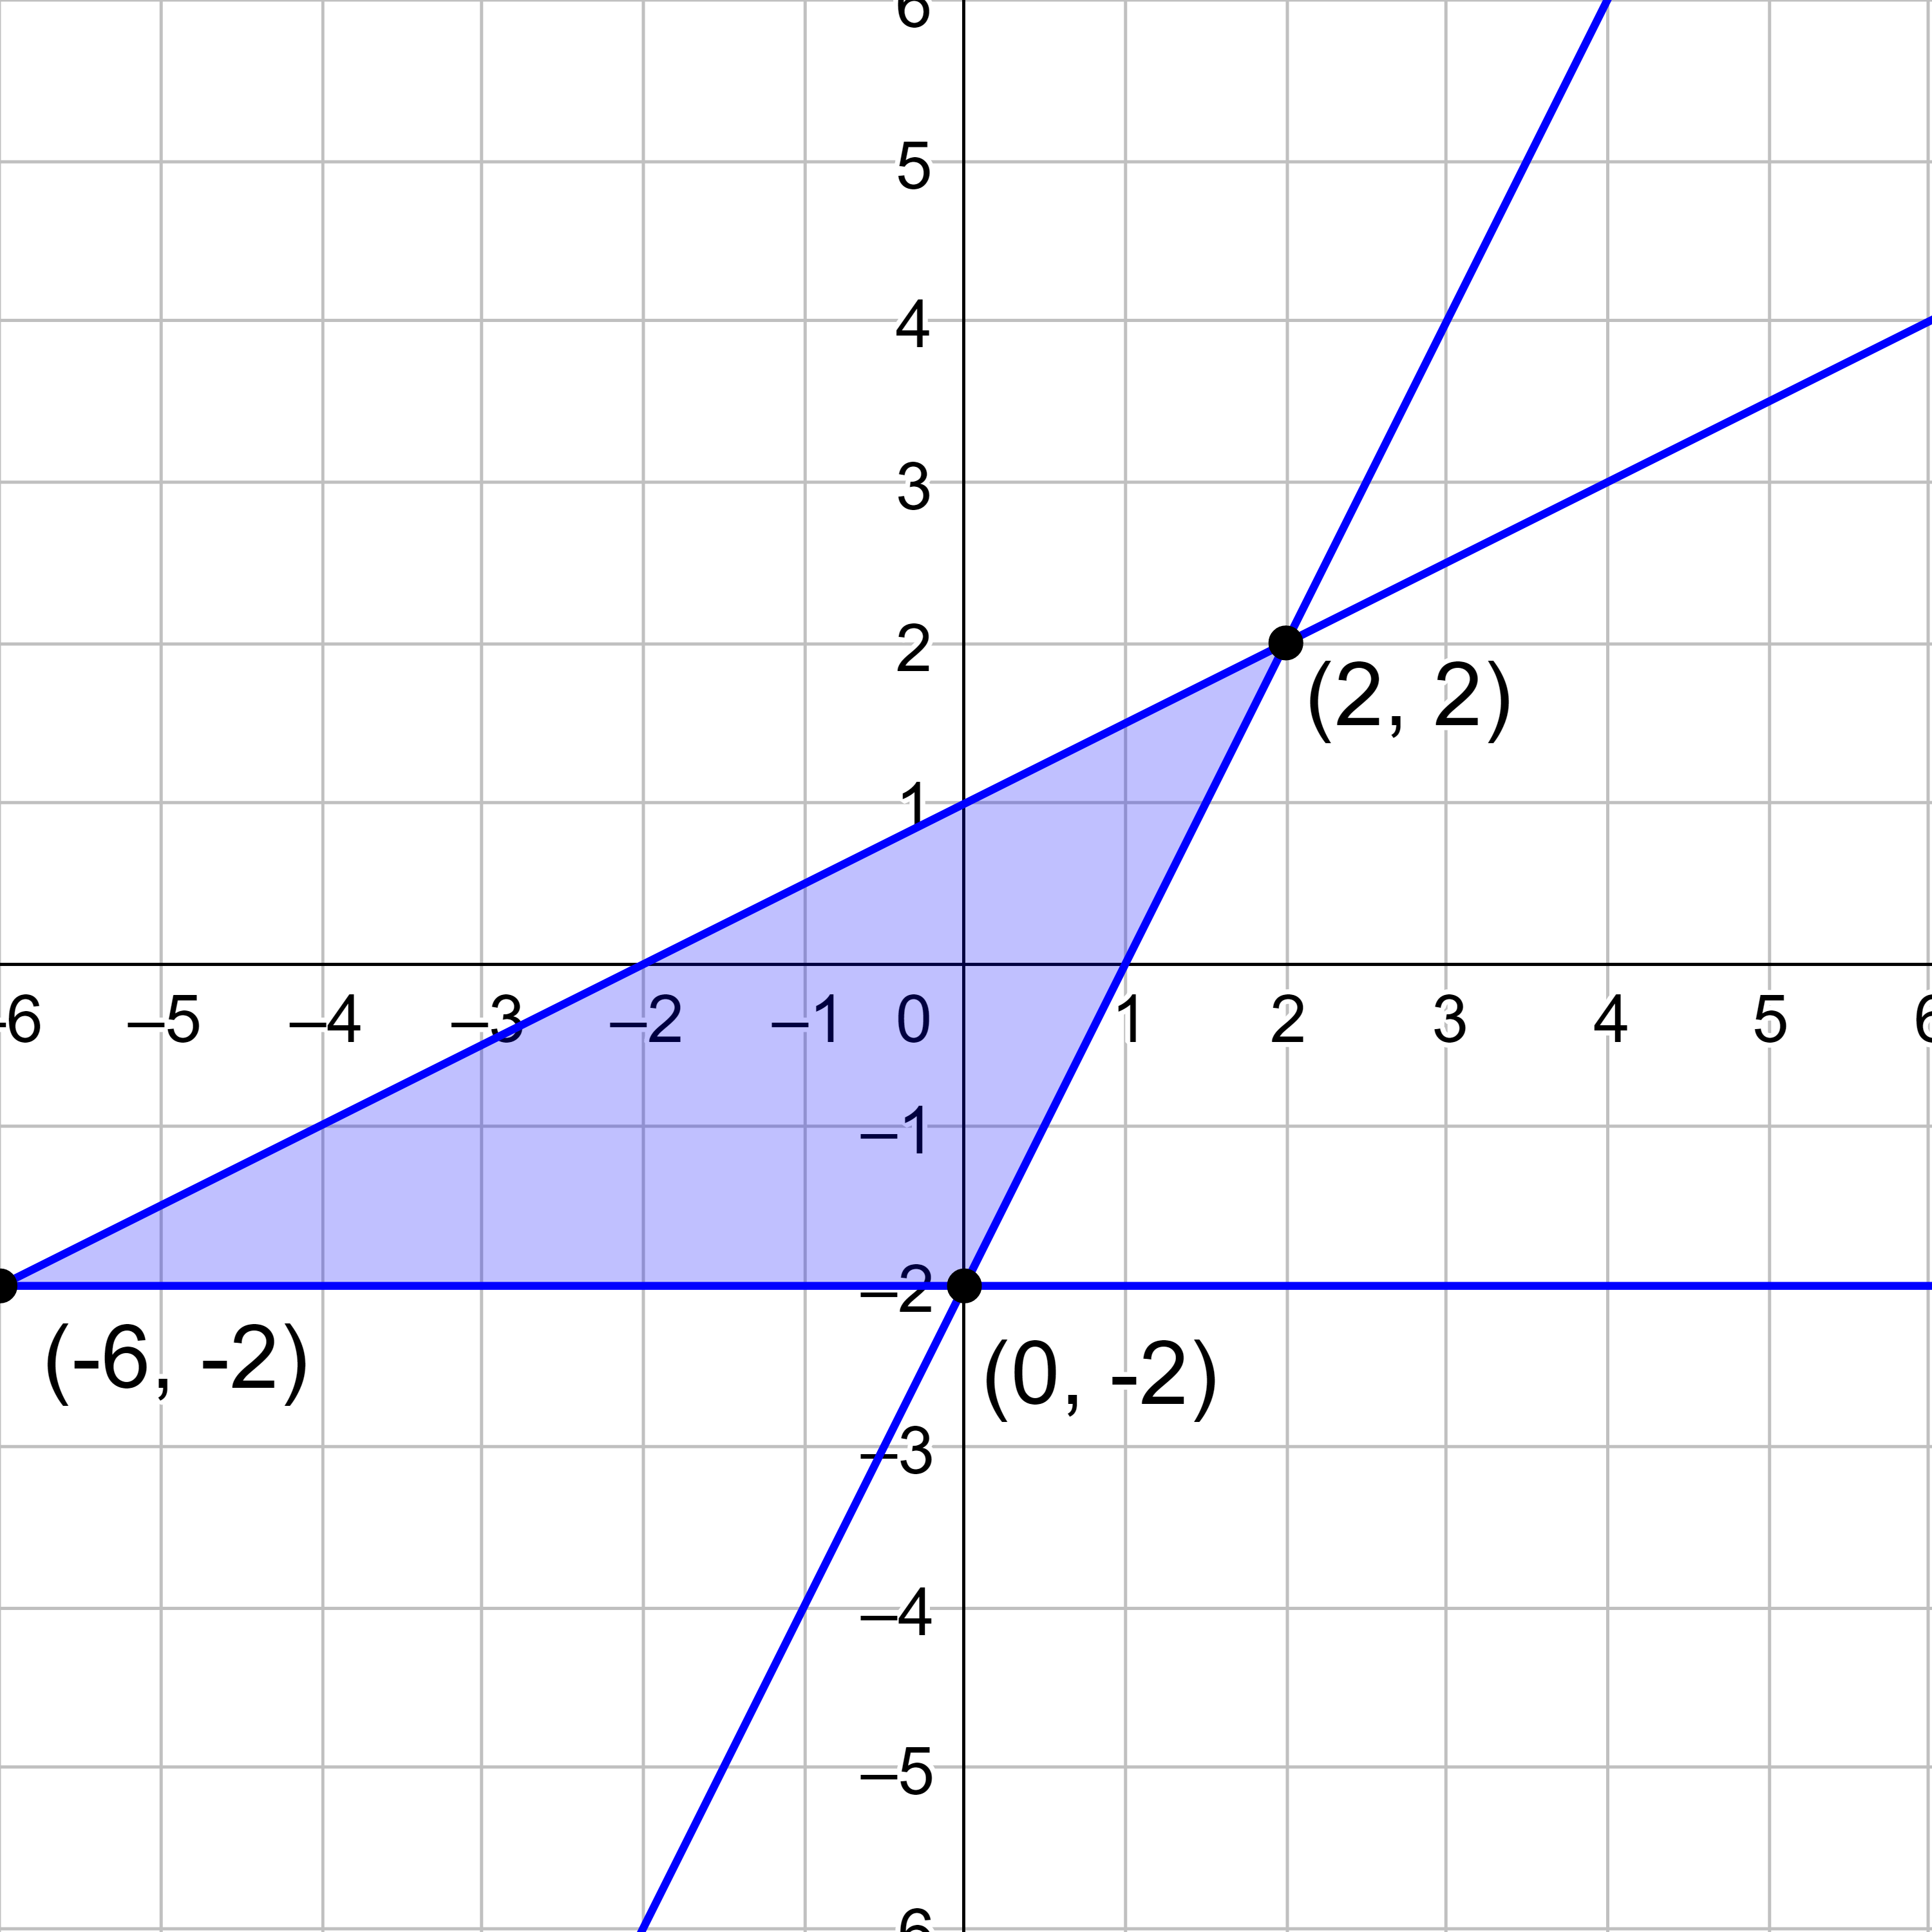
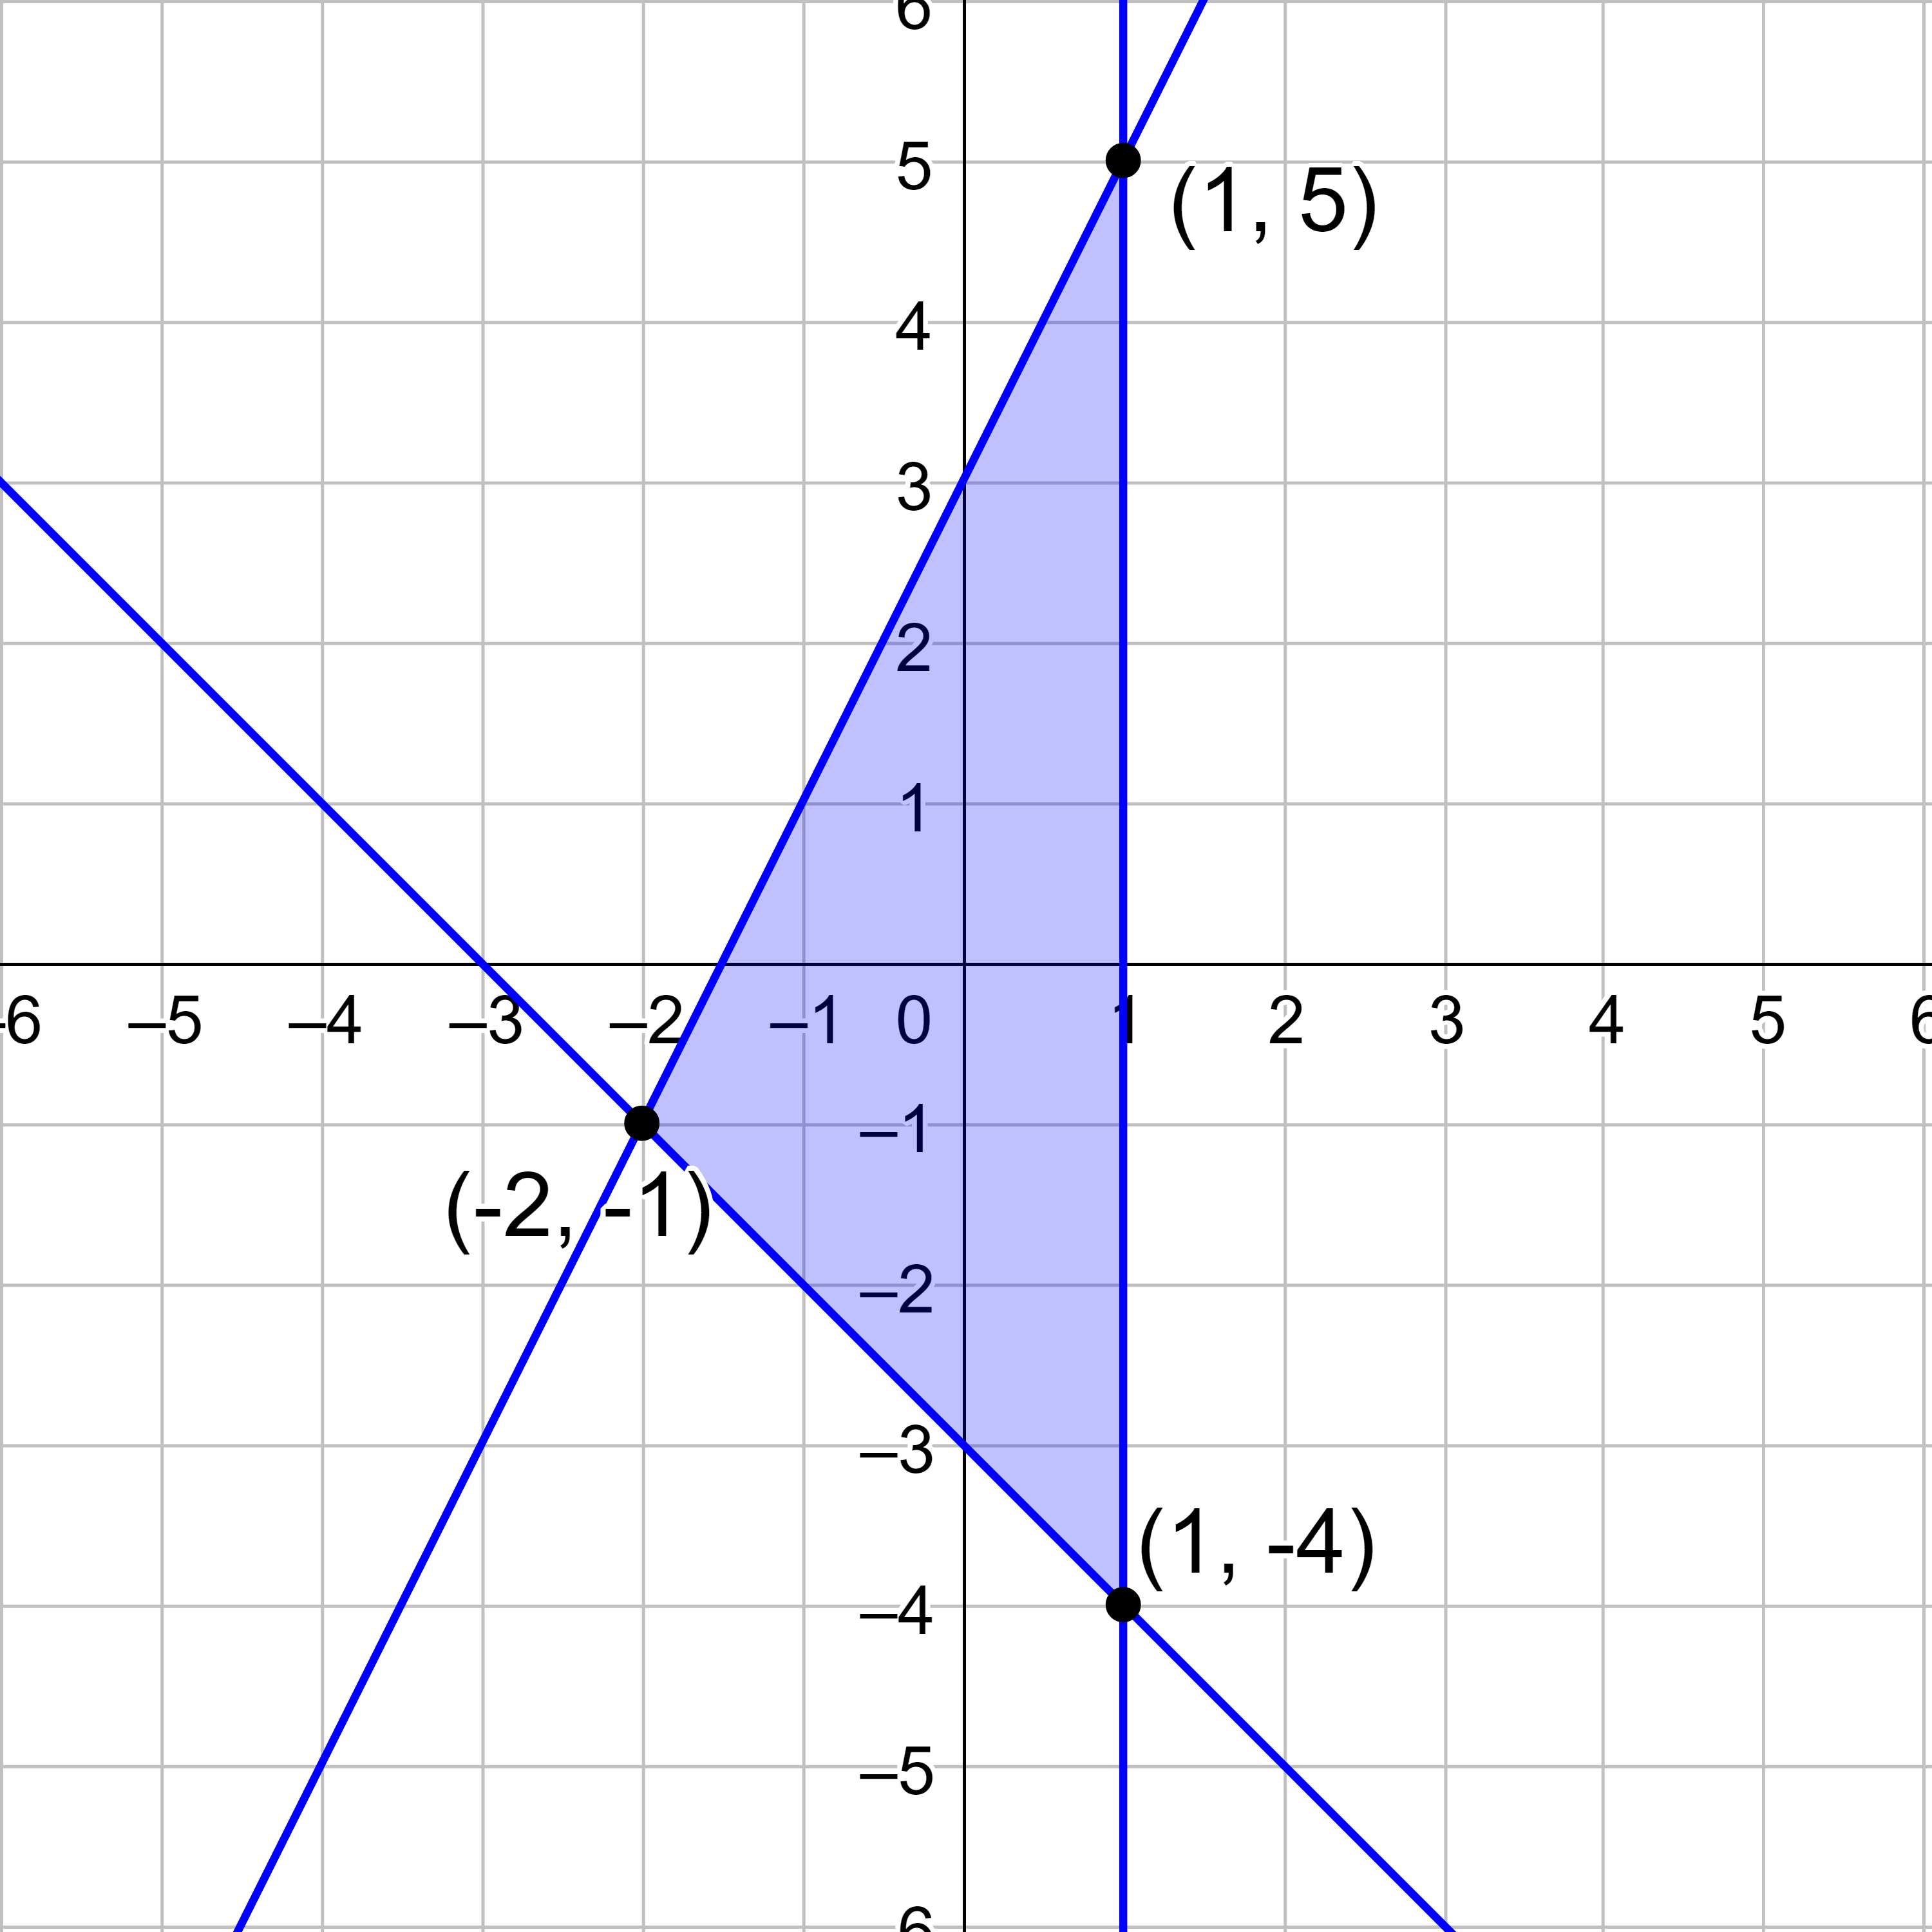
Solve \(\left\{\begin{align} 2x - y &≥ -3 \\ x + y &≥ -3 \\ x &≤ 1 \end{align}\right.\) and label the vertices of the solution area.

Solution

Start by graphing the first inequality. It might be easier to solve it for y.

$$ 2x - y ≥ -3 $$

$$ y ≤ 2x + 3 $$

y ≤ 2x + 3
Figure 2: \(y ≤ 2x + 3\)

Graph the second inequality and mark the shaded area differently than the first inequality.

$$ x + y ≥ -3 $$

$$ y ≥ -x - 3 $$

y ≥-2x - 3
Figure 3: \(y ≥ -x - 3 \) added to graph

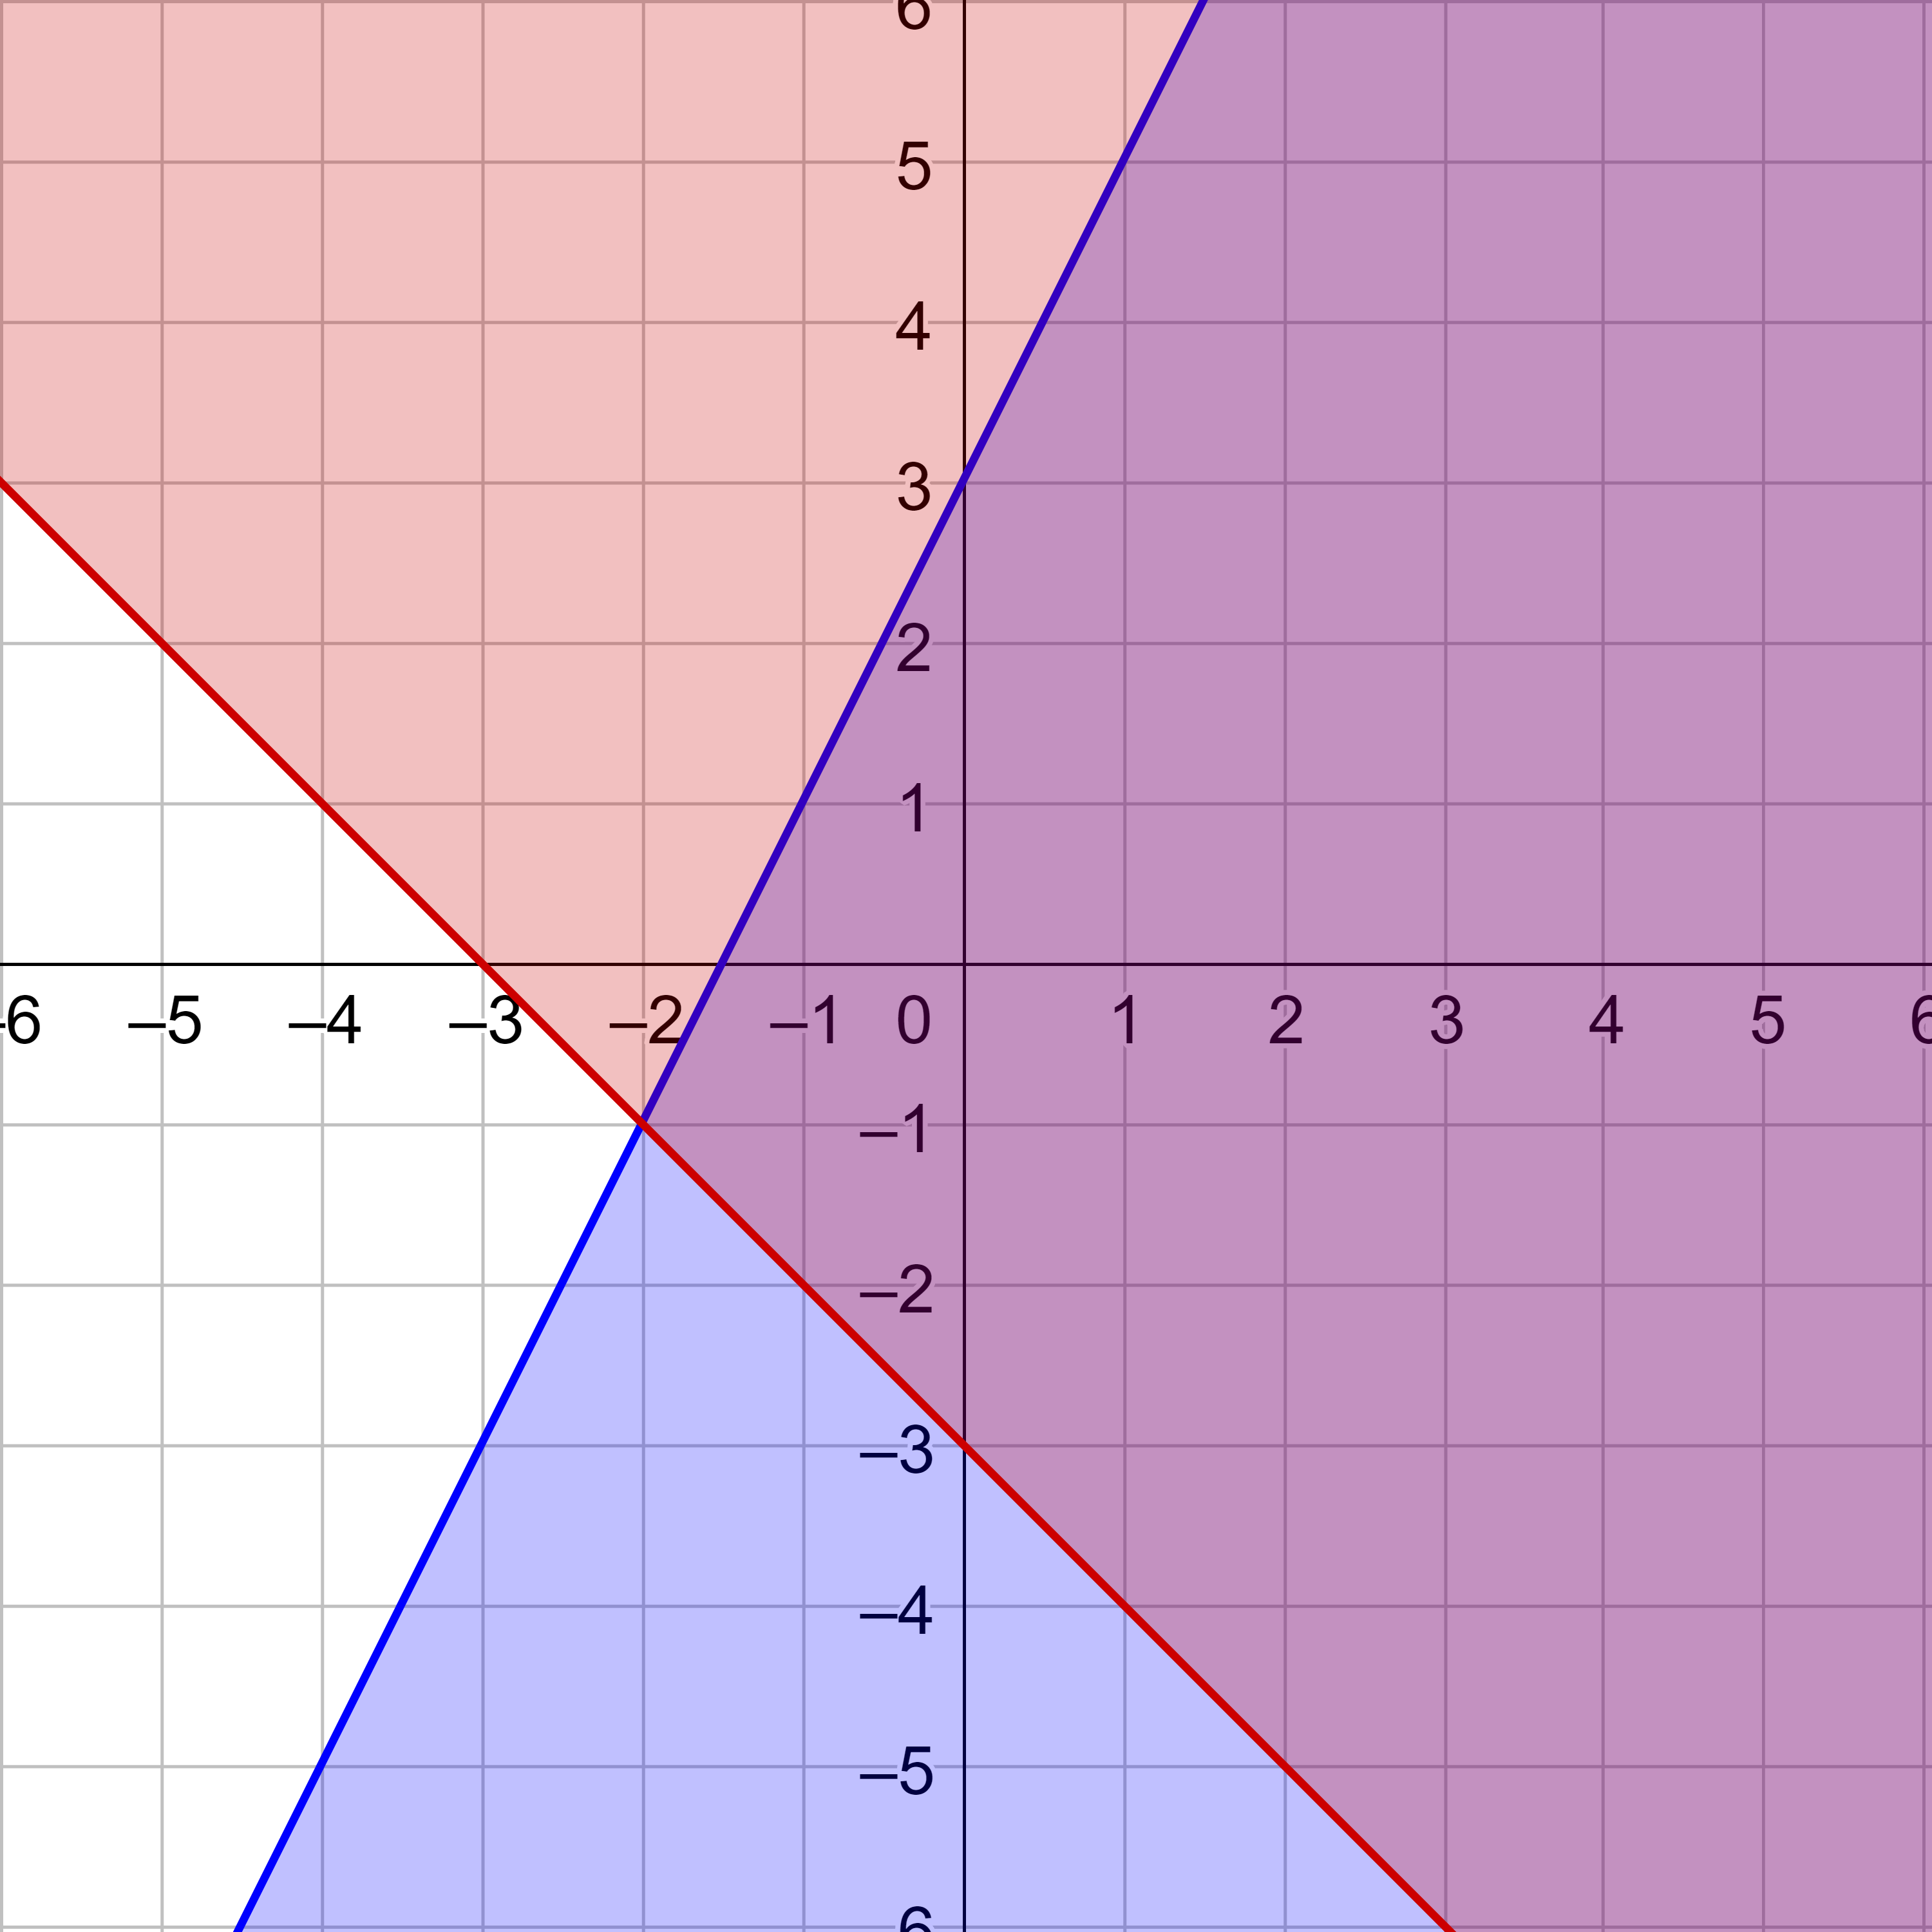
Graph the third inequality and mark the shaded area differently than the other inequalities.

$$ x ≤ 1 $$

x ≤ 1
Figure 4: \(x ≤ 1 \) added to graph

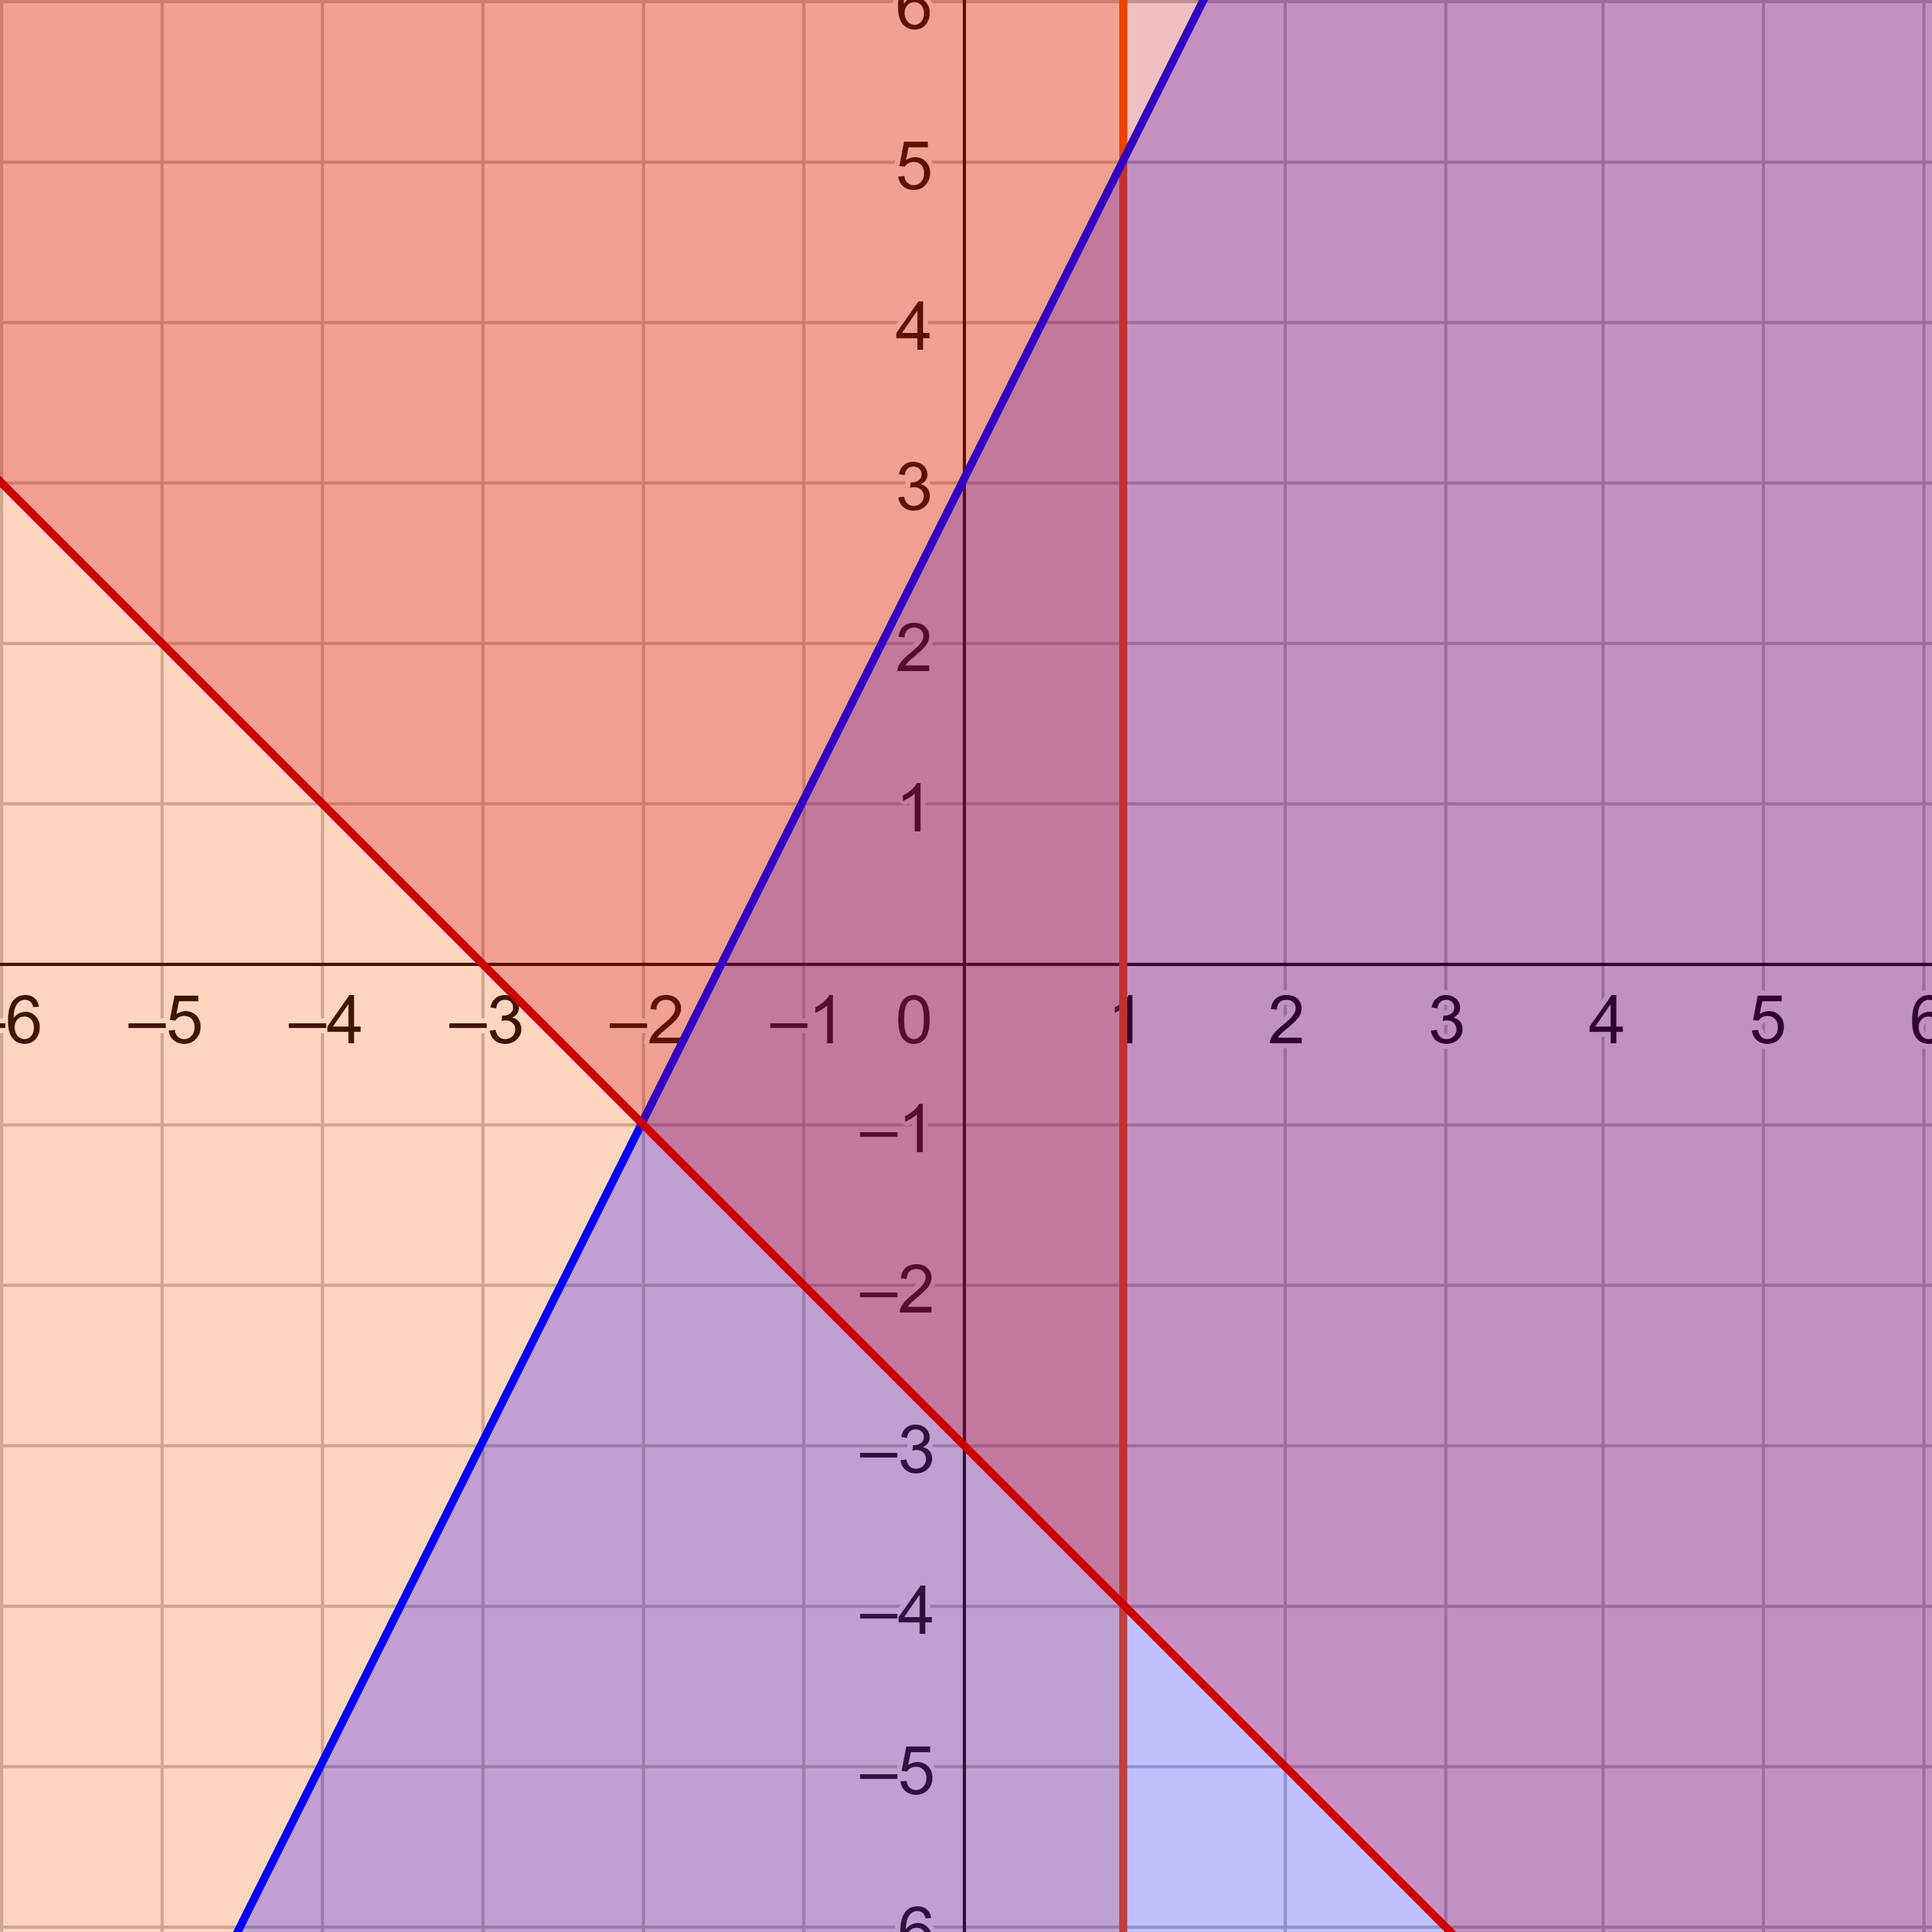
The solution is the area where all three inequalities are shaded. Label the vertices of the solution area.

solution
Figure 5: The solution
Try It 1

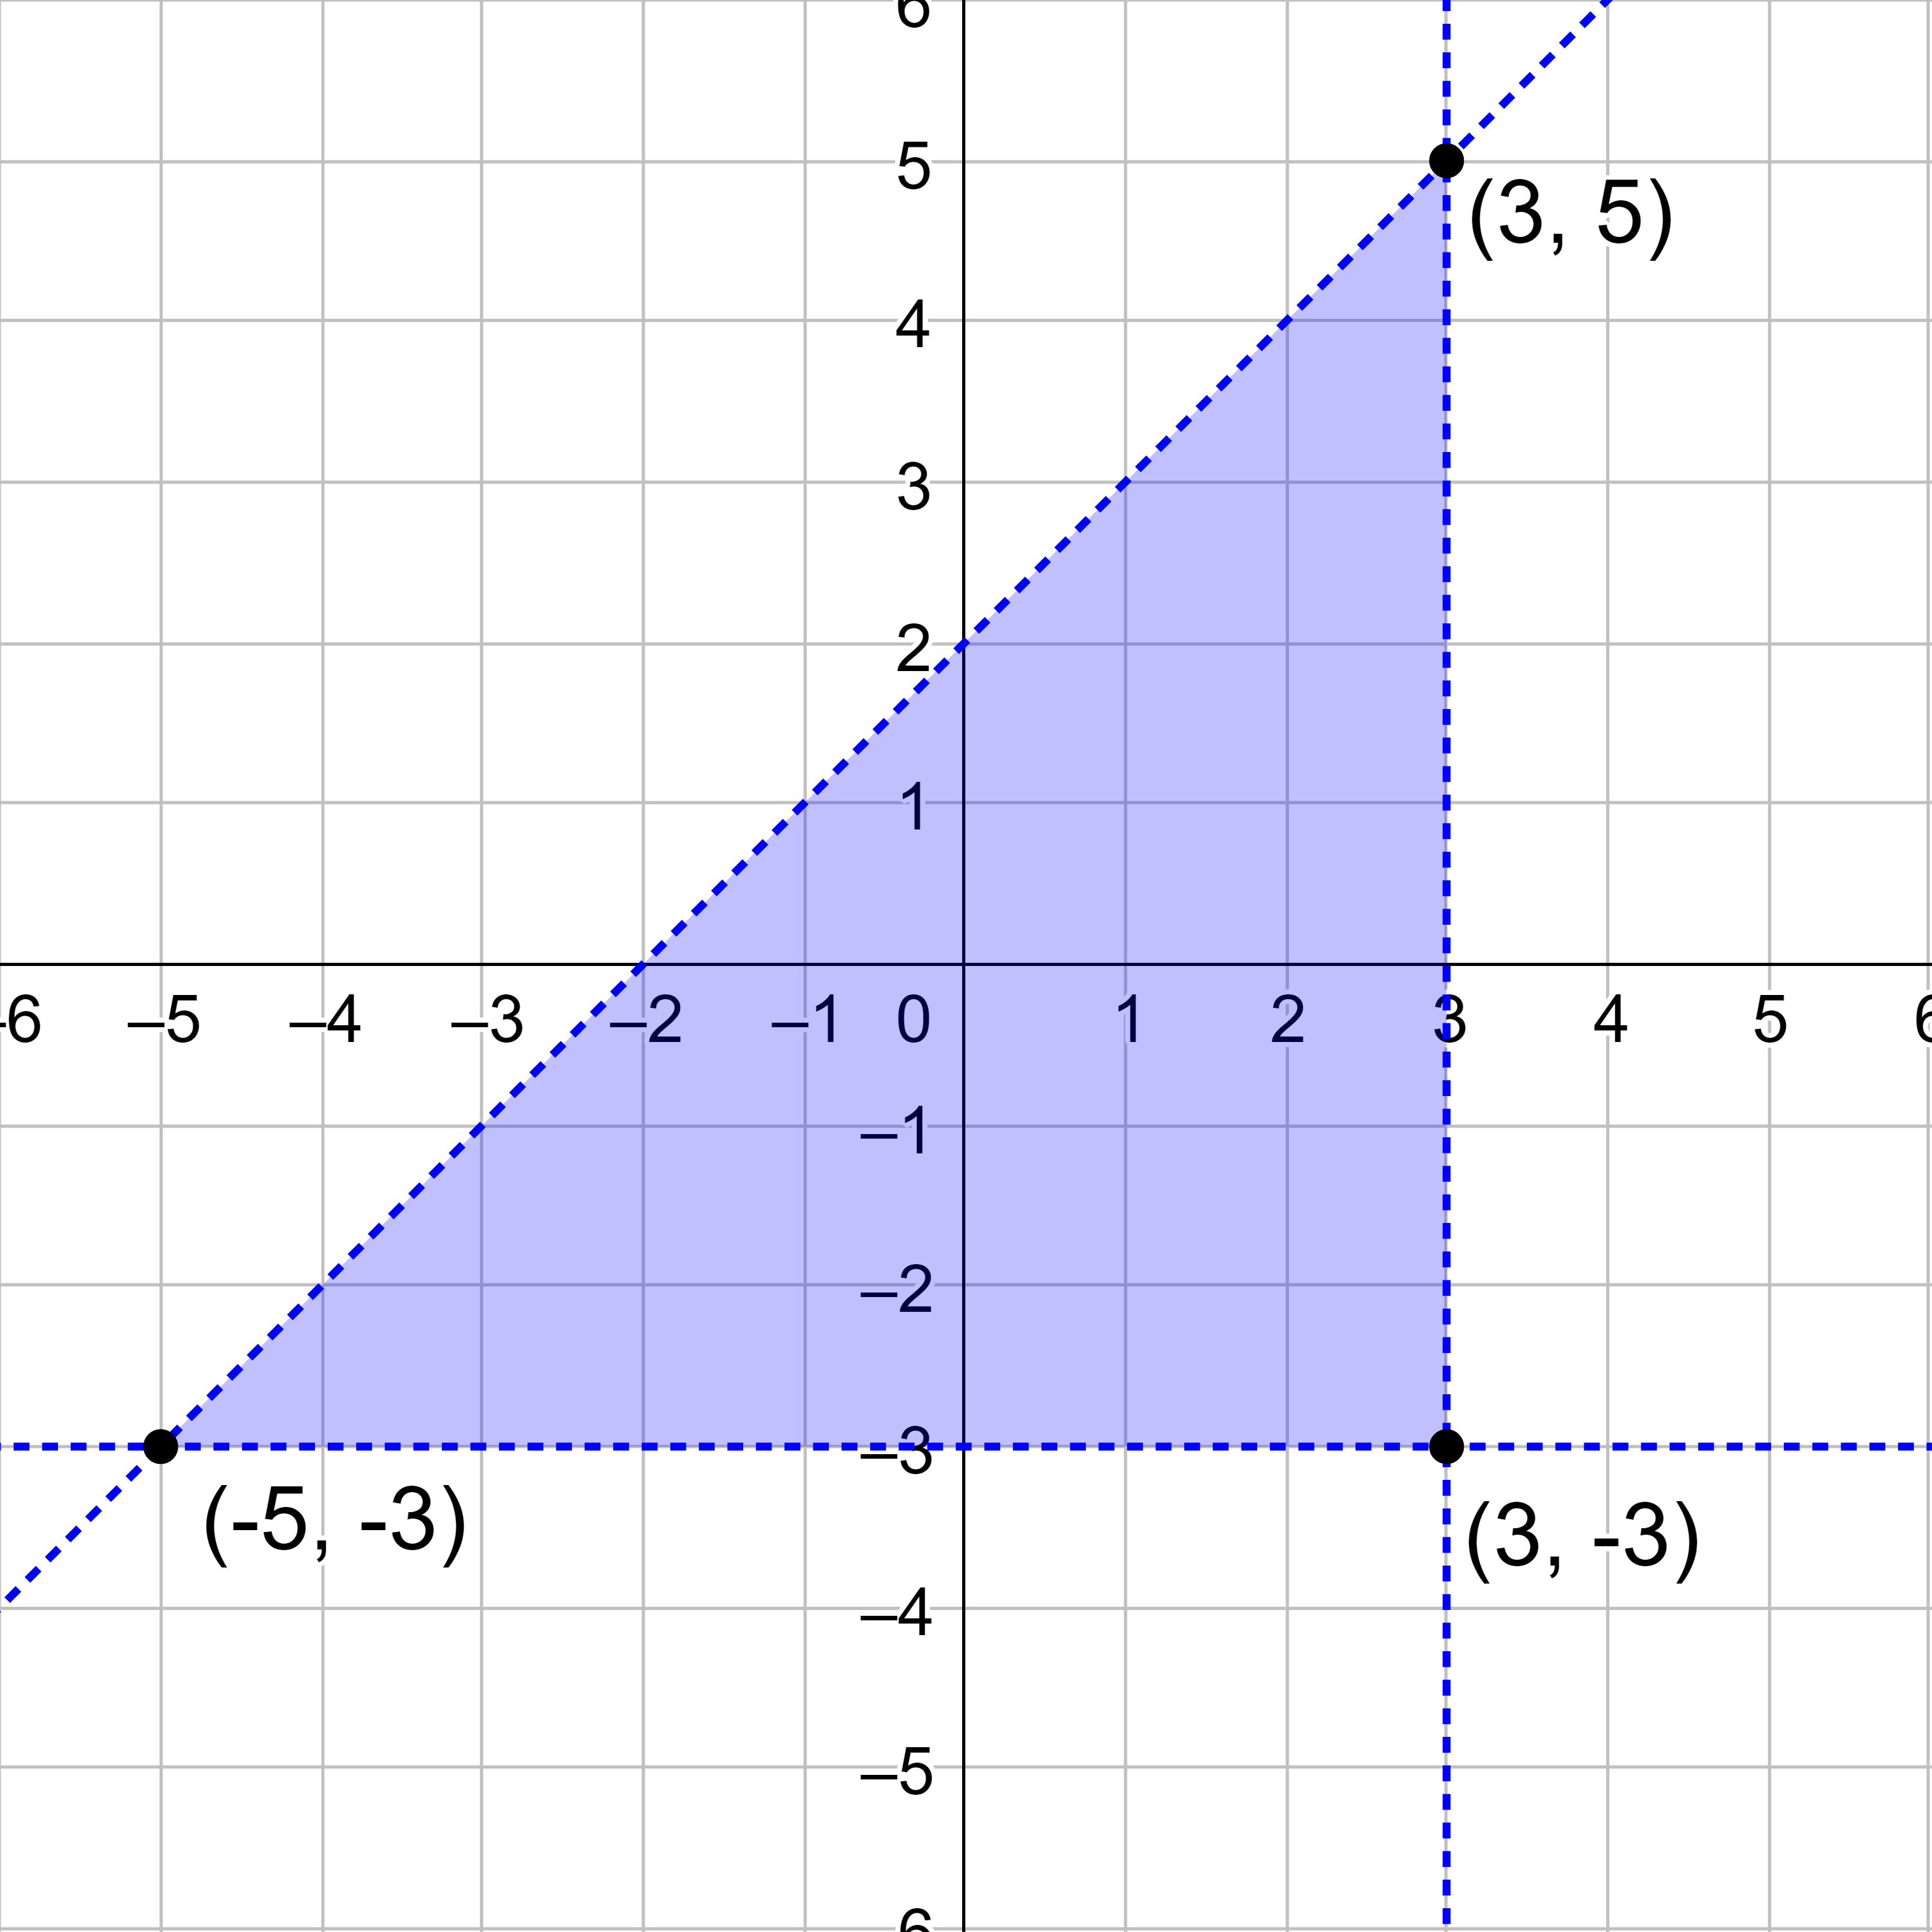
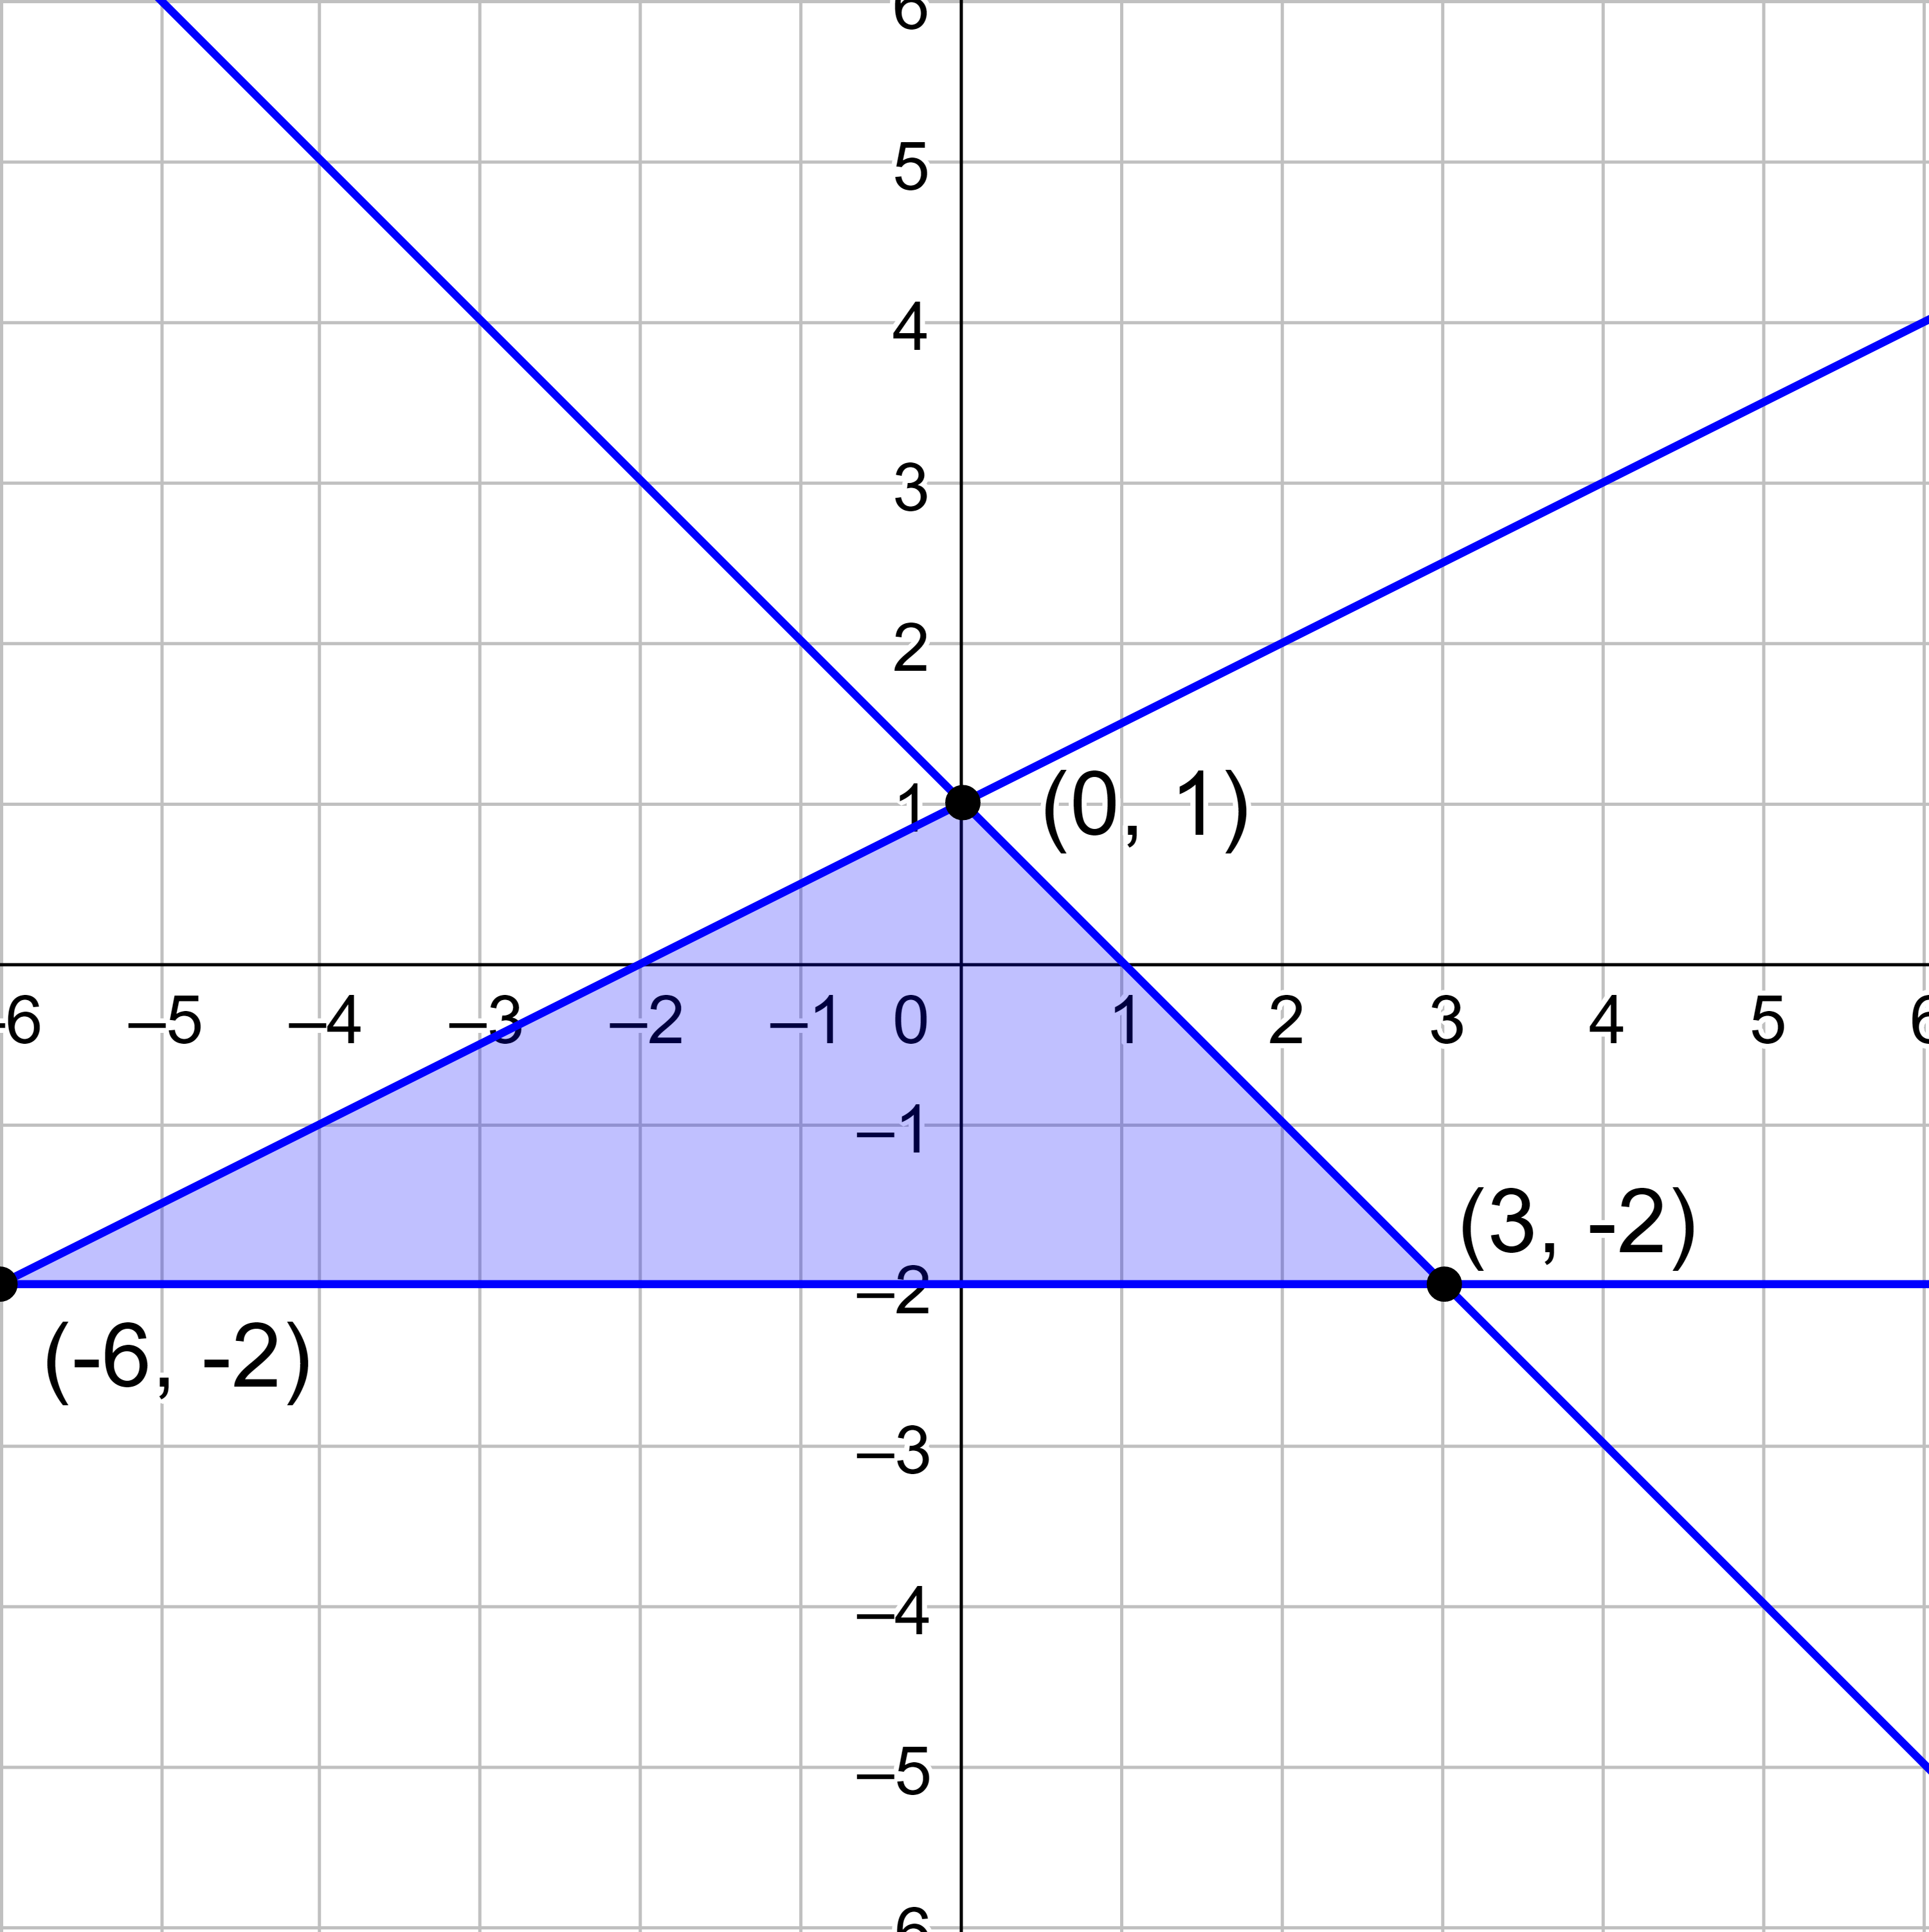
Solve \(\left\{\begin{align} x + y &≤ 1 \\ x - 2y &≥ -2 \\ y &≥ -2 \end{align}\right.\) and label the vertices of the solution area.

Answer

answer

Example 2: Solve a System of Nonlinear Inequalities

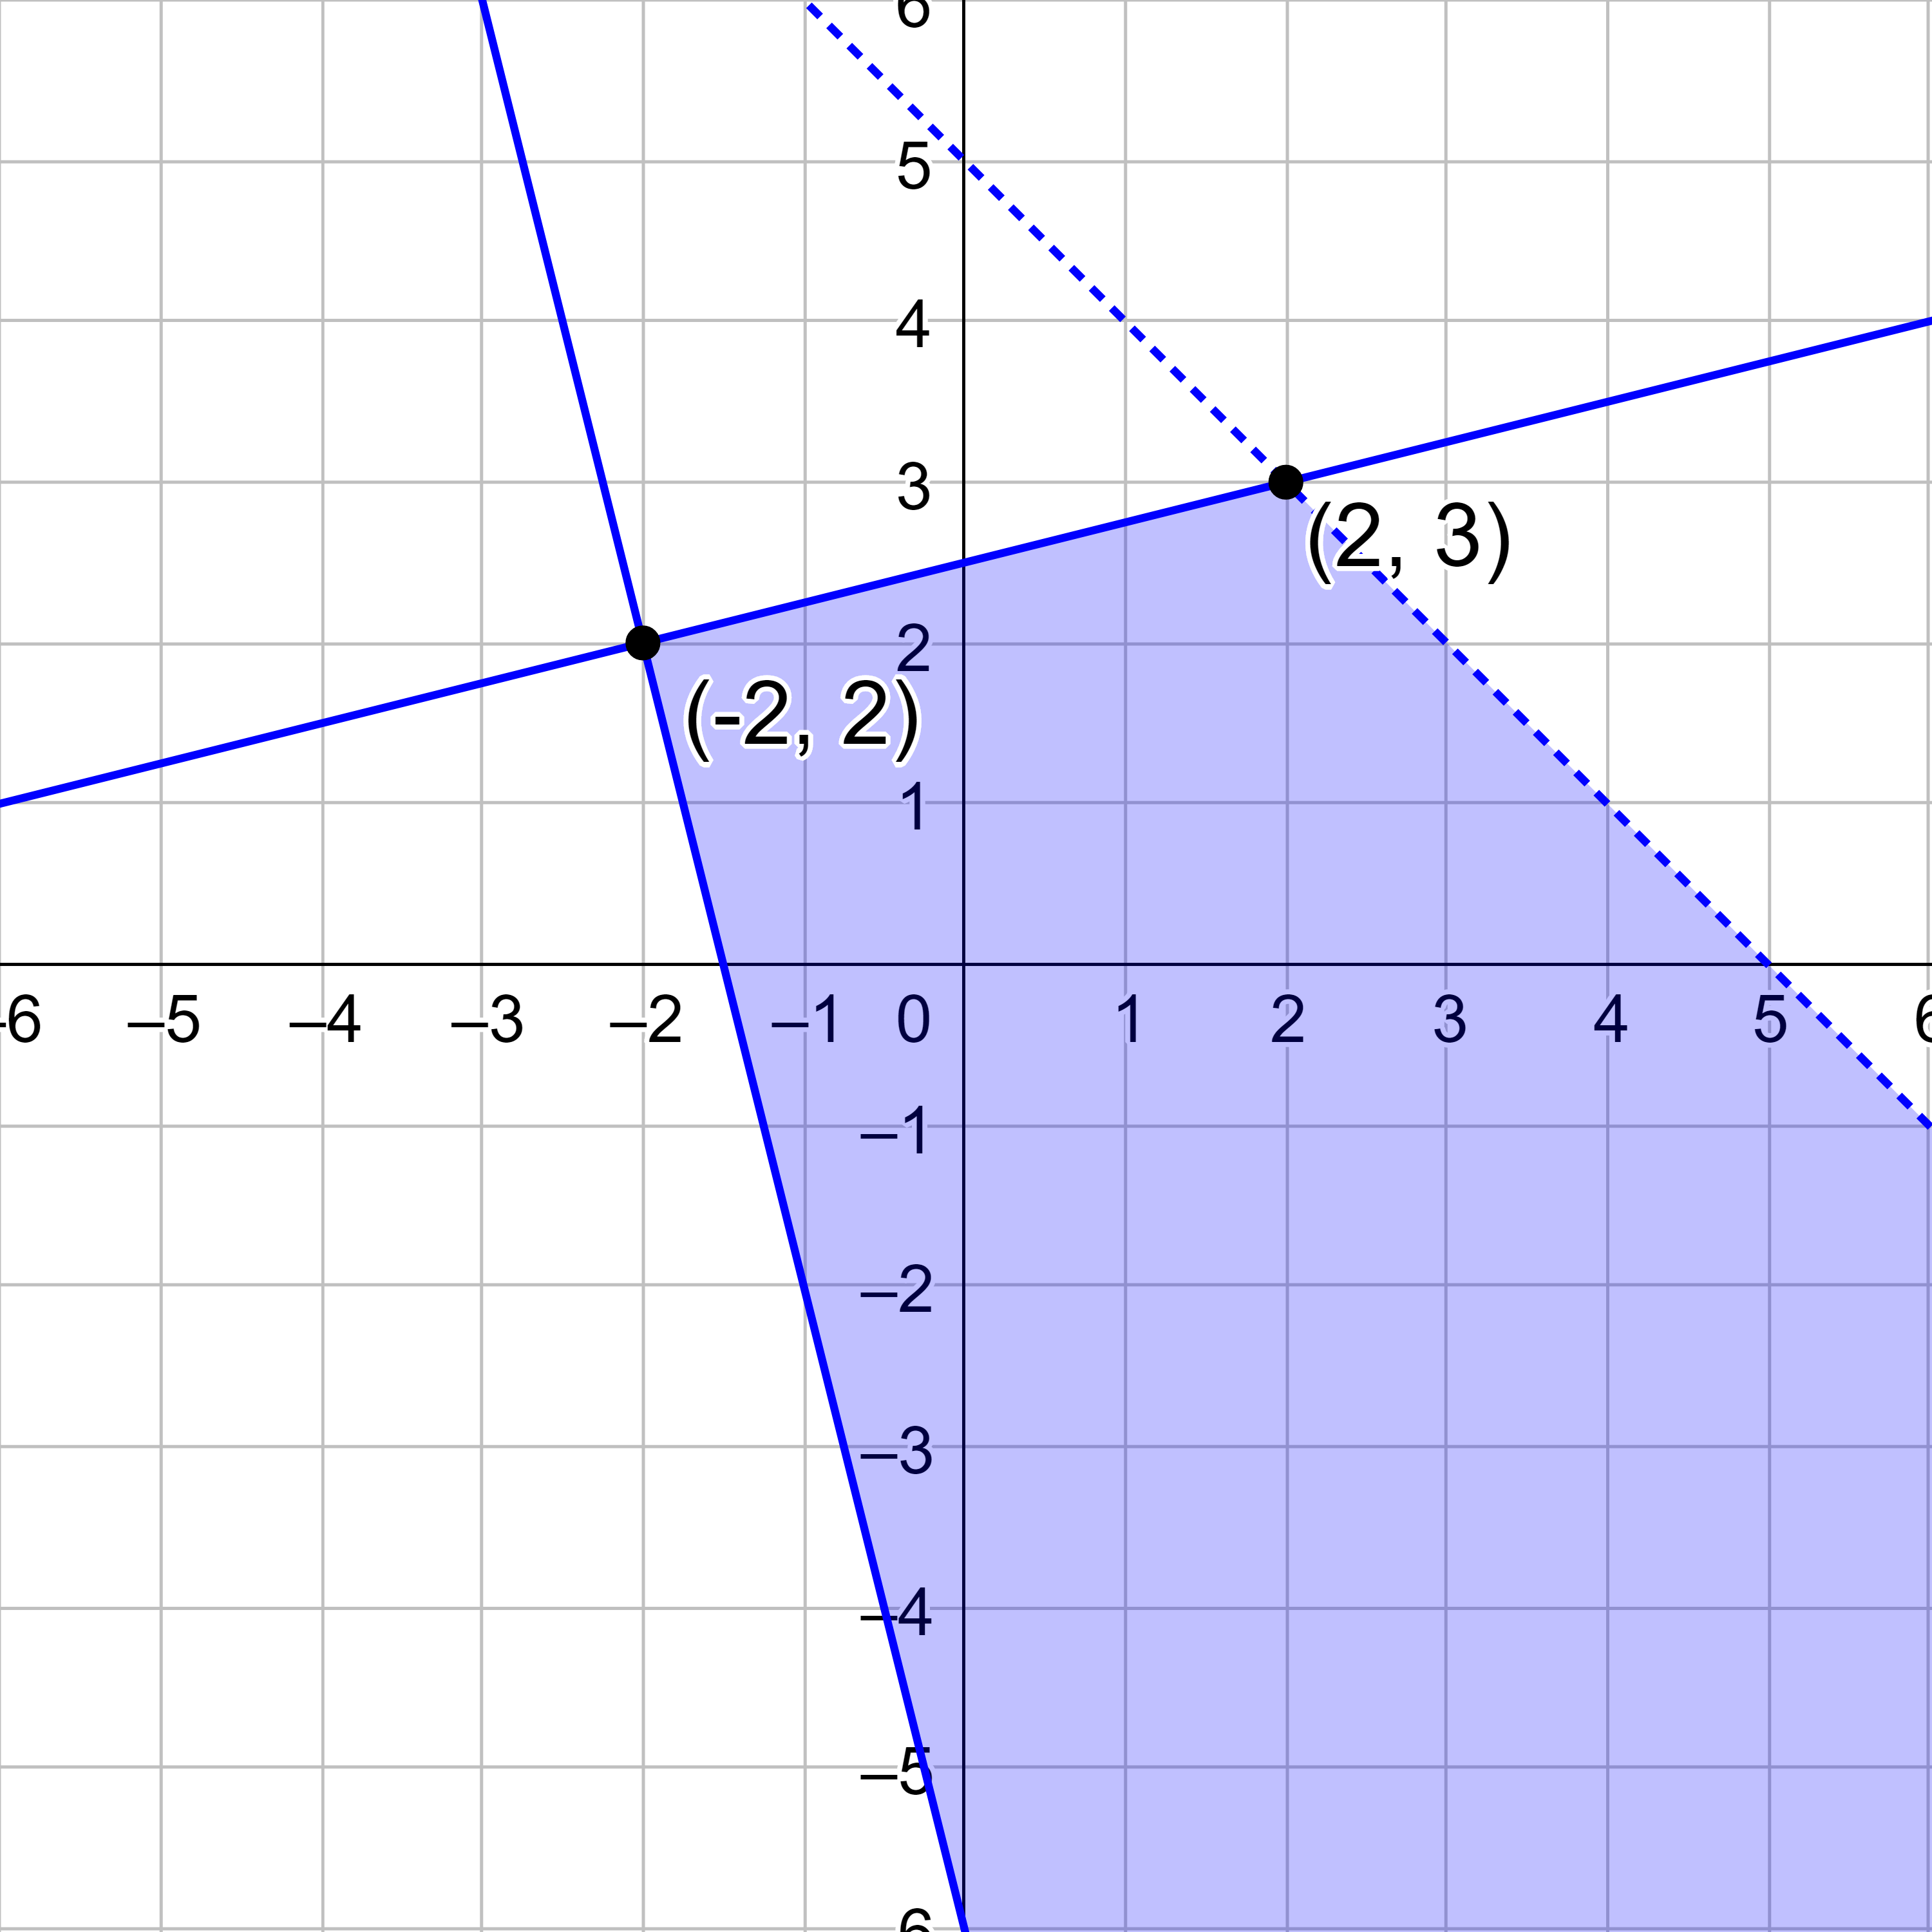
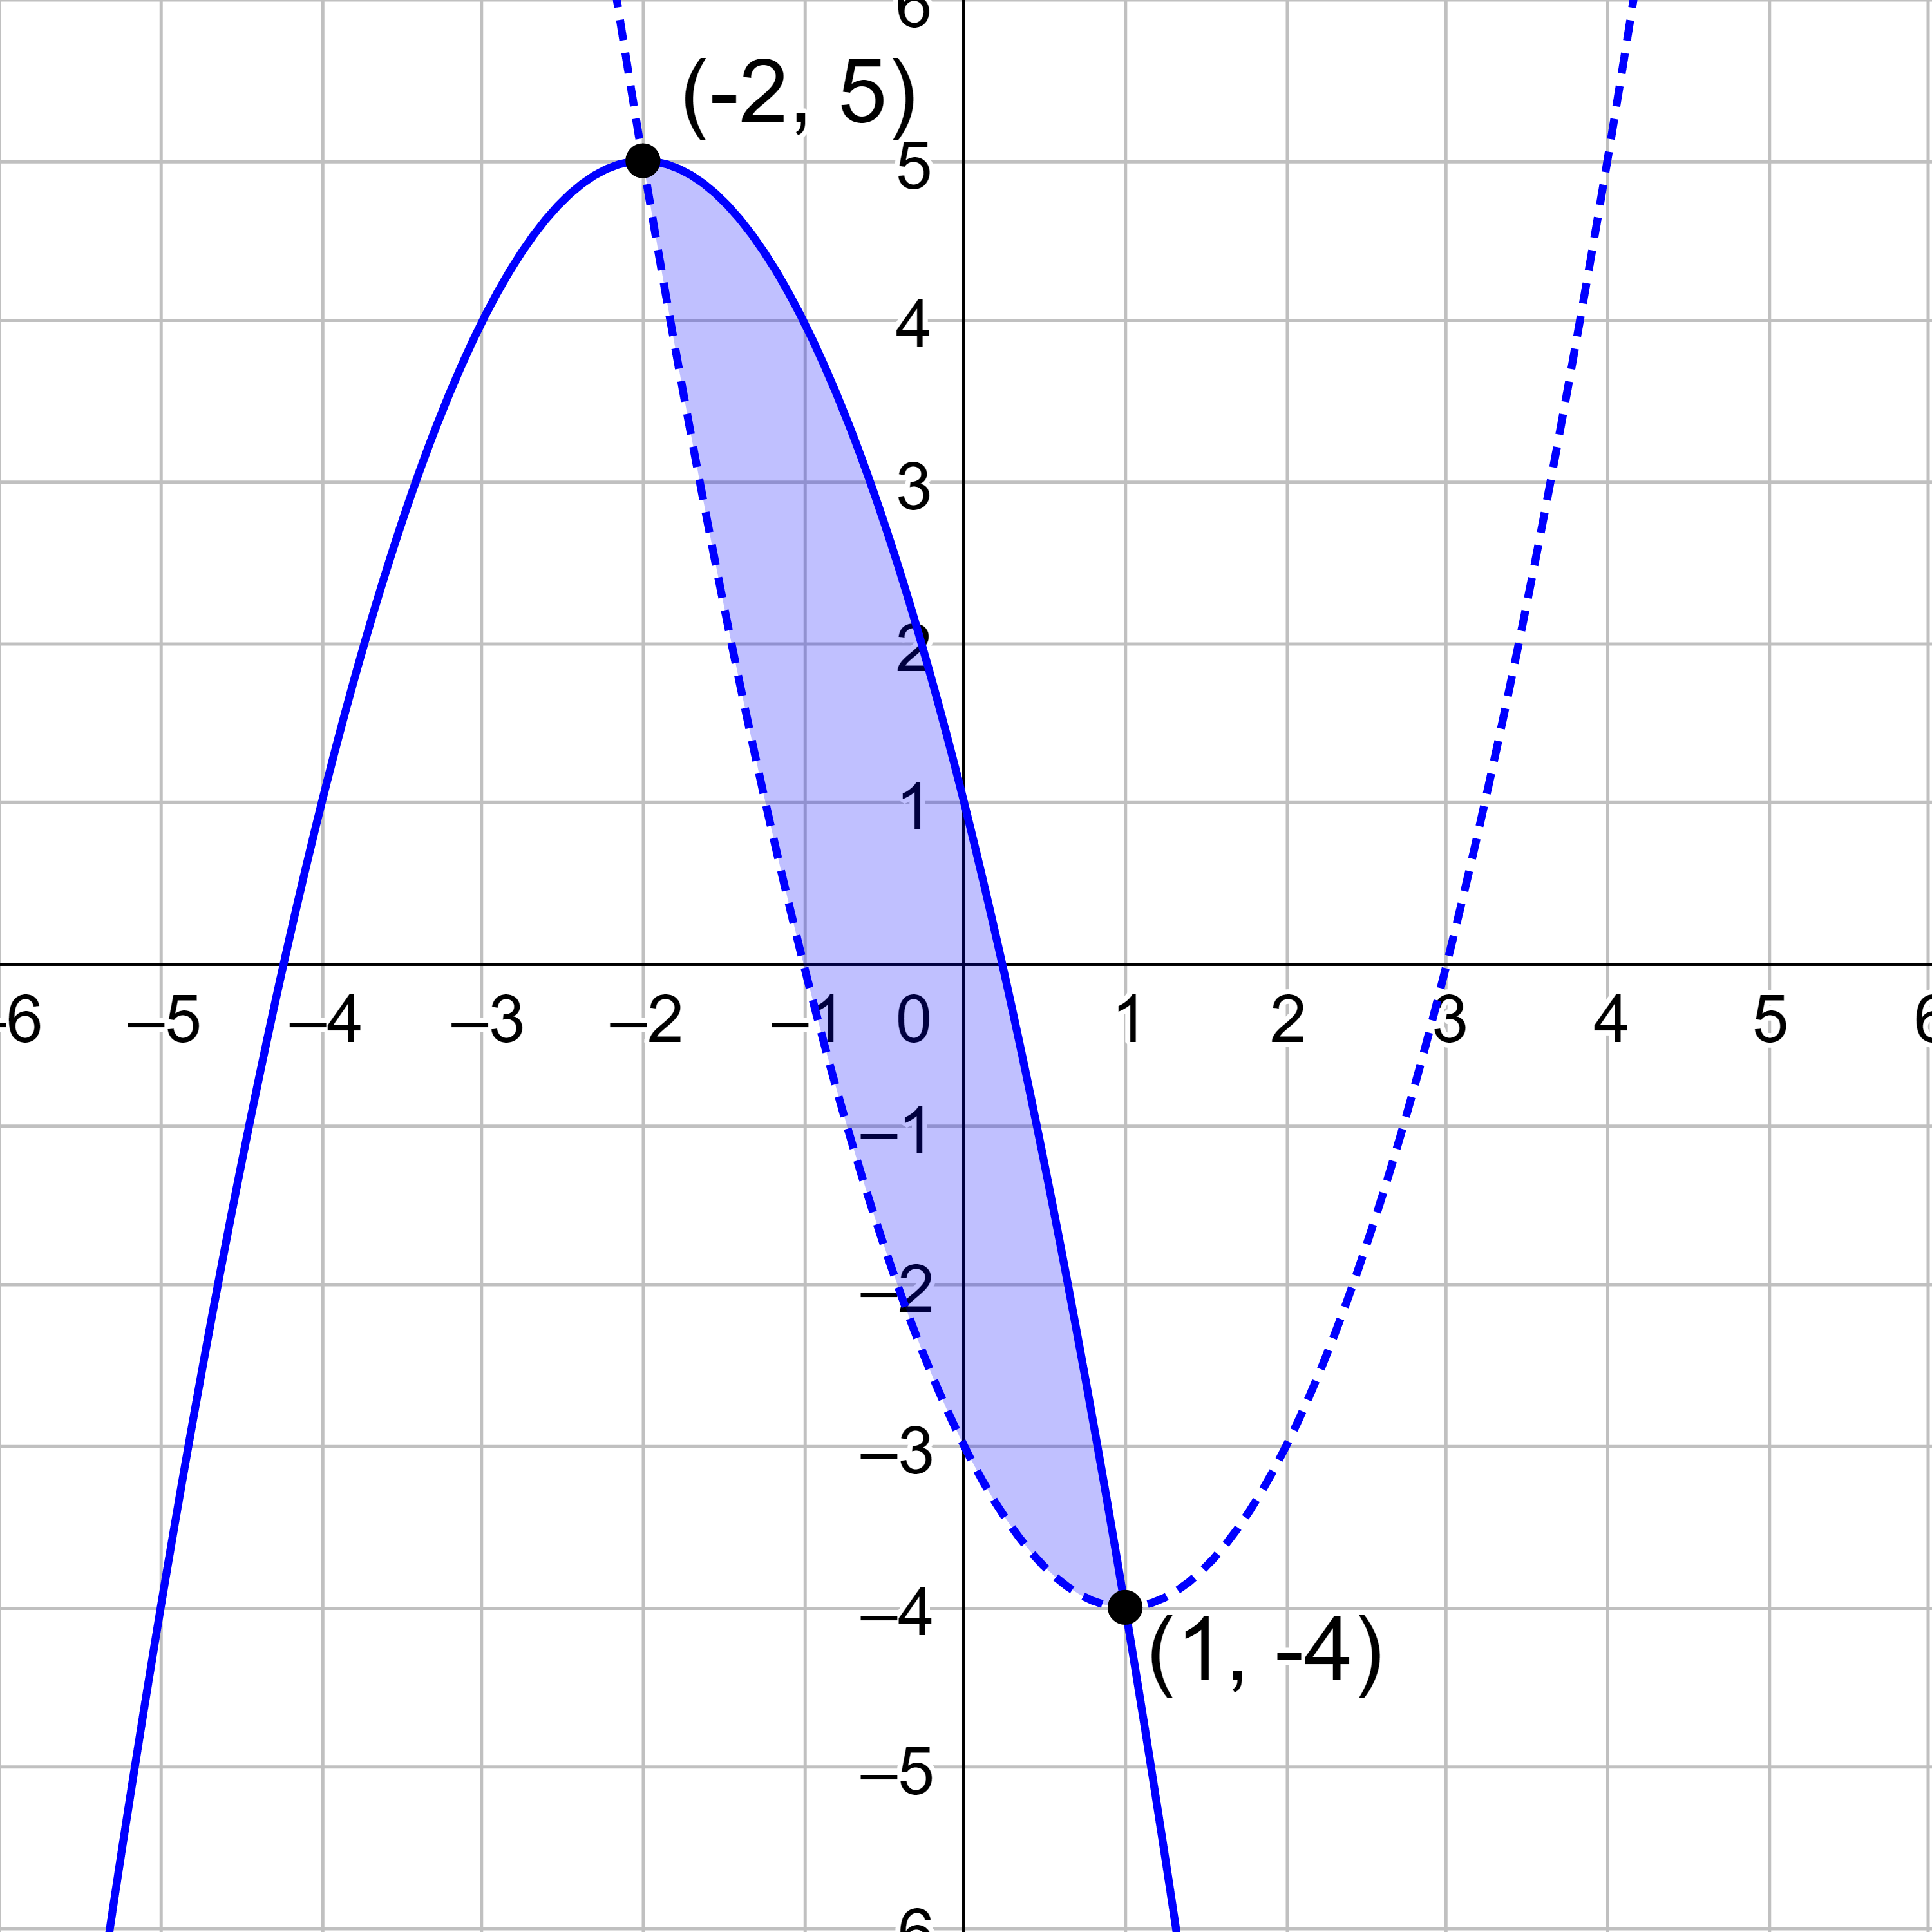
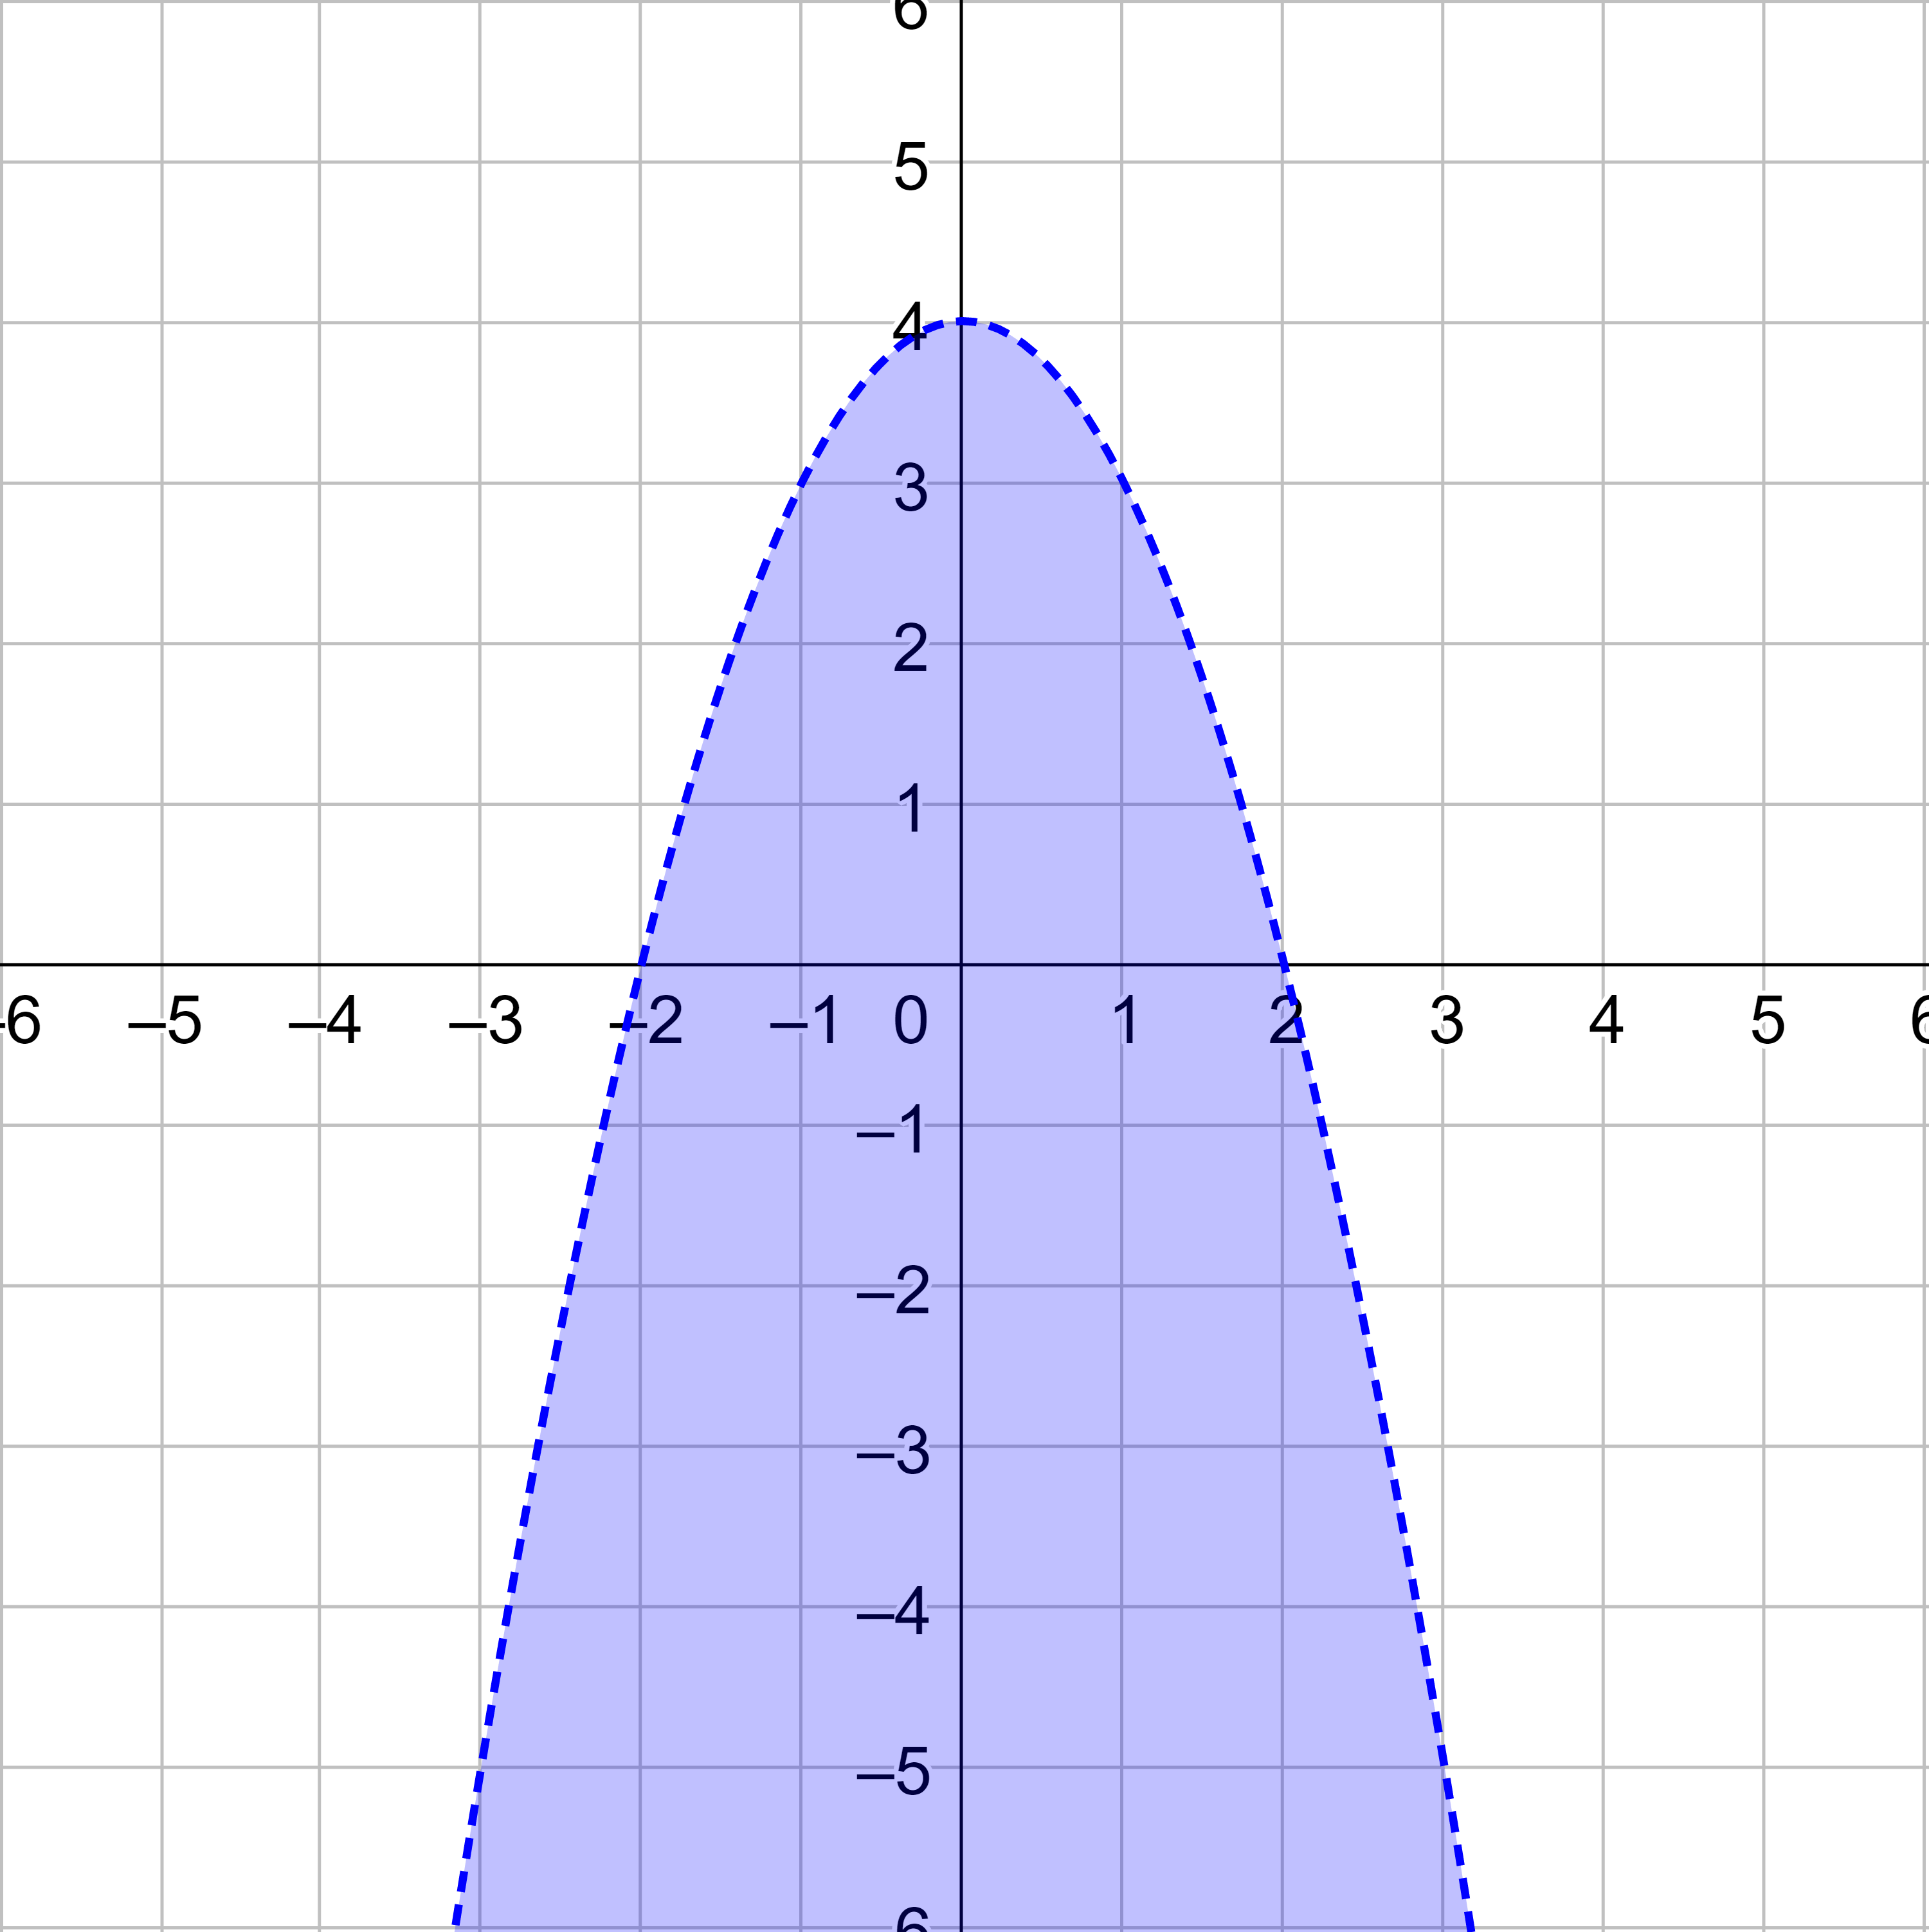
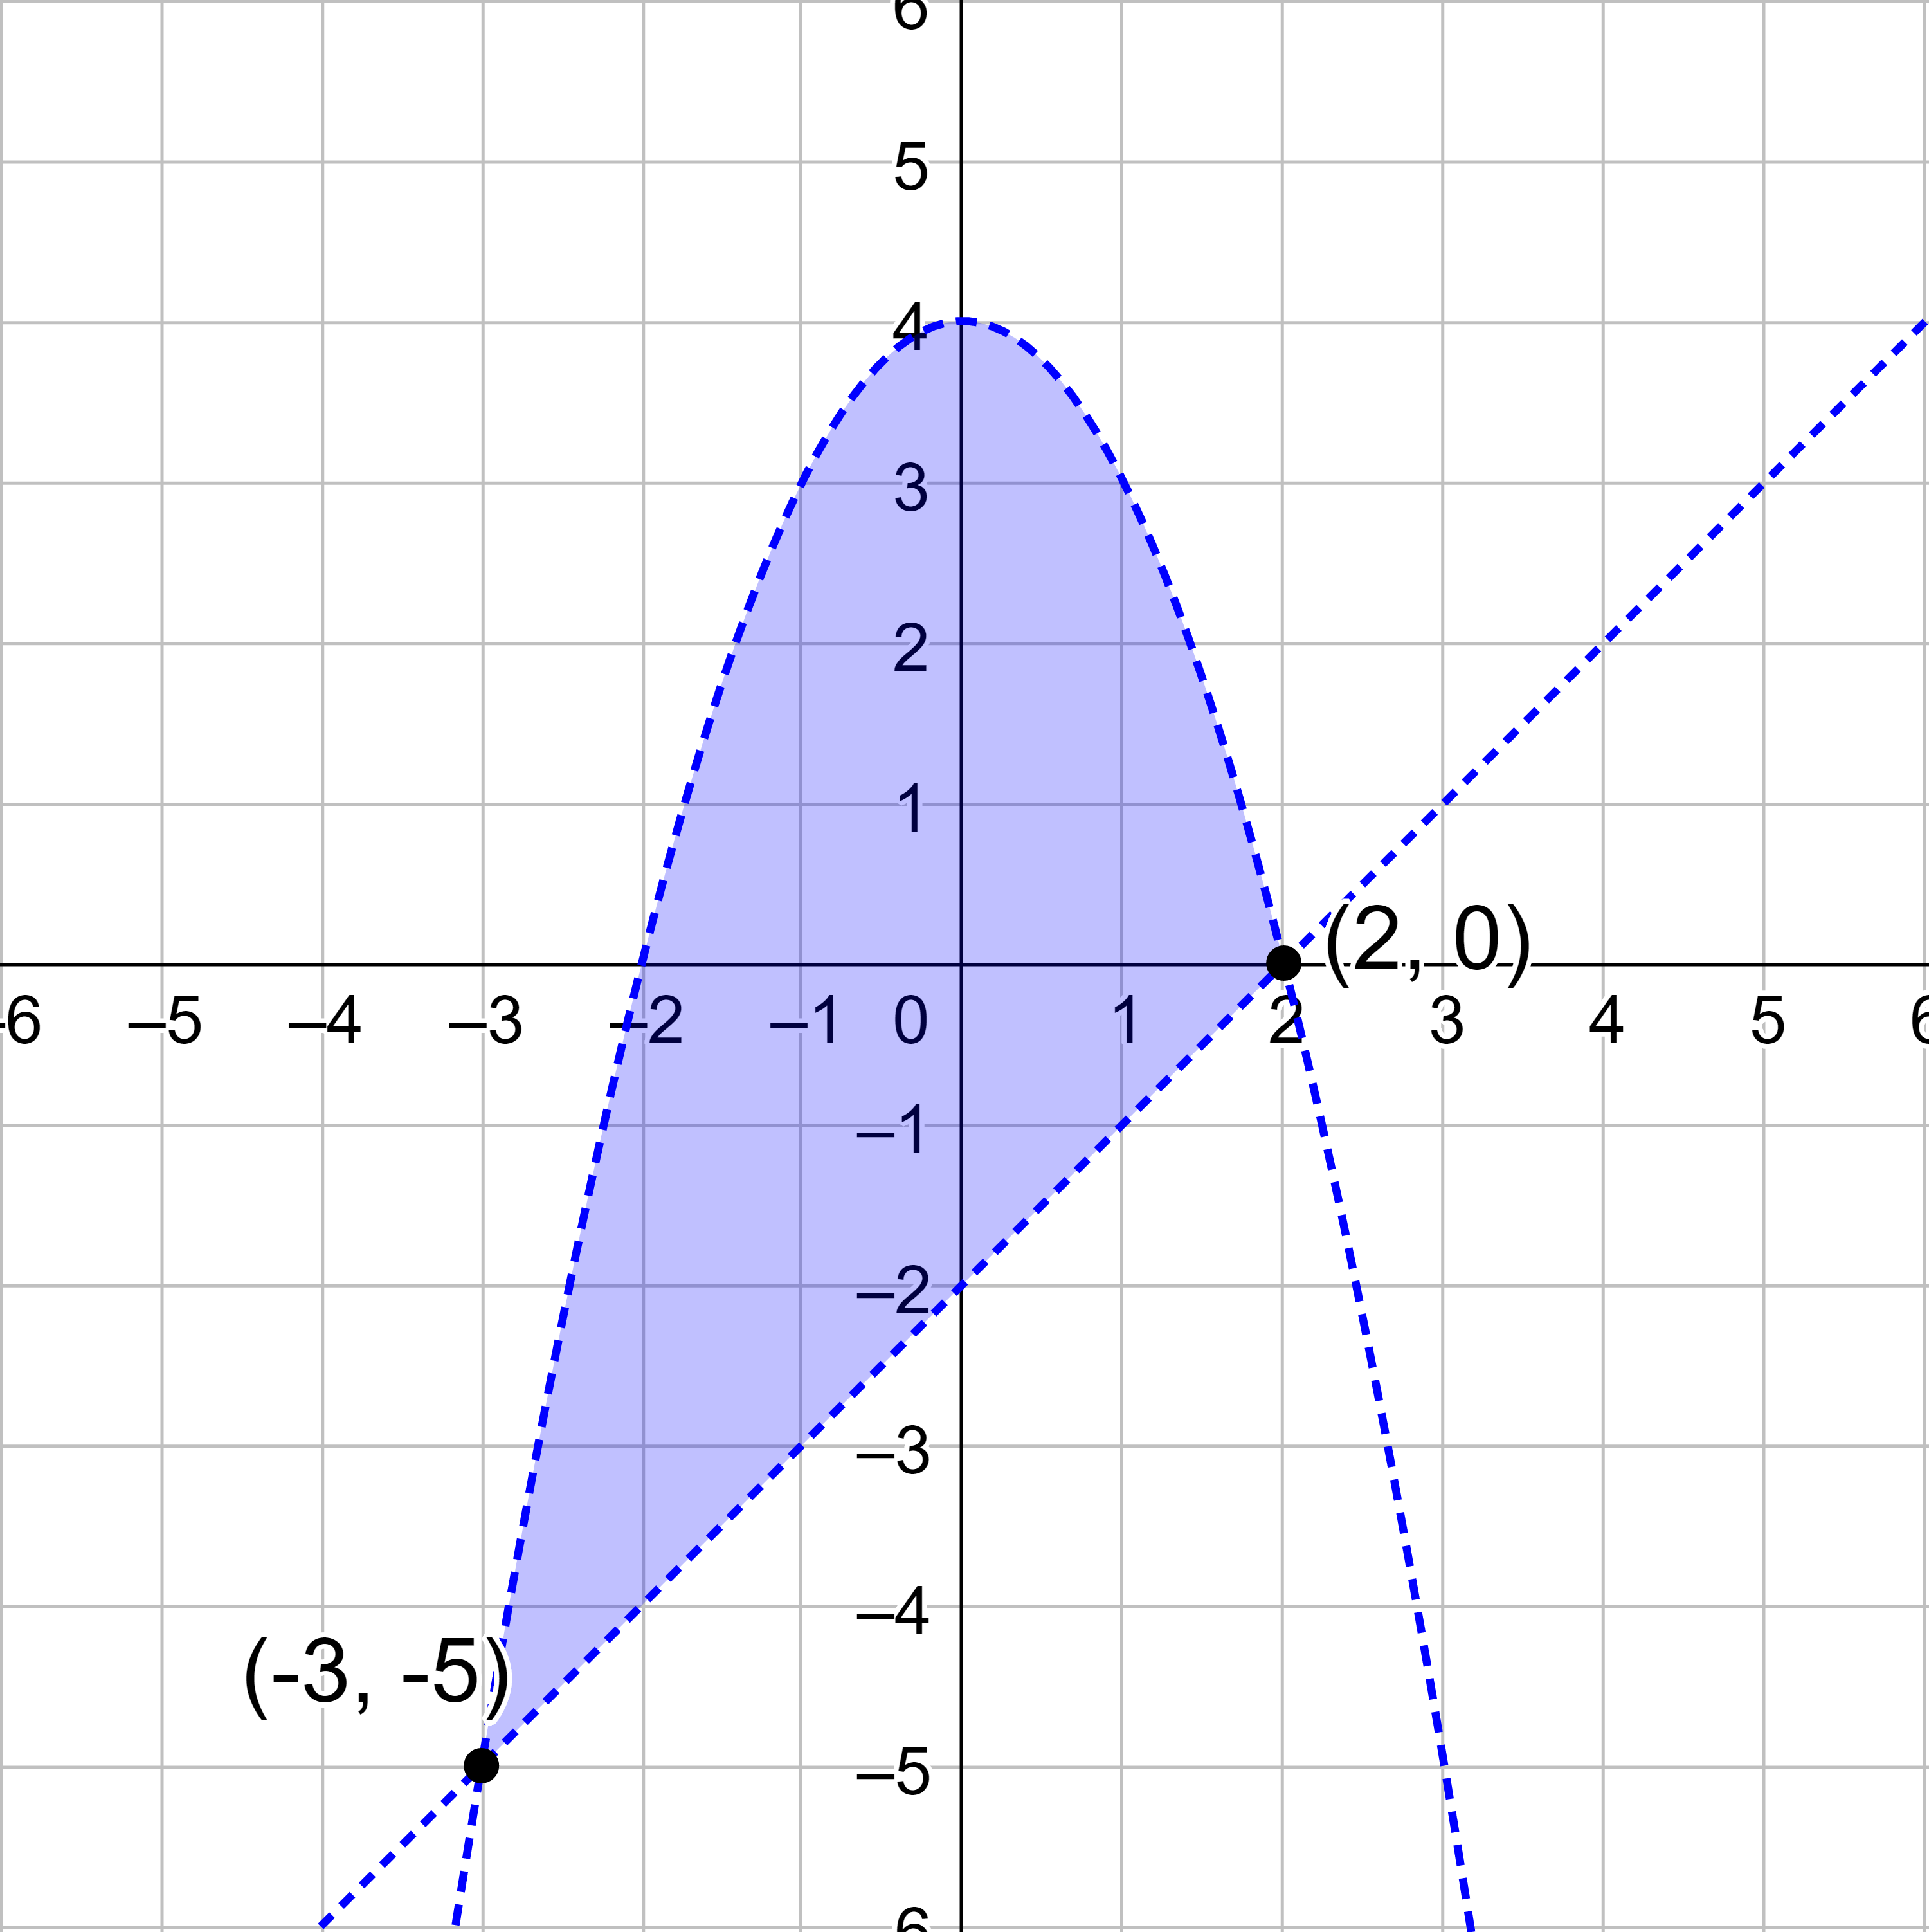
Solve \(\left\{\begin{align} y &< -x^2 + 4 \\ y &> x - 2 \end{align}\right.\) and label the vertices of the solution area.

Solution

Start by graphing the first inequality.

$$ y < -x^2 + 4 $$

y < -x^2 + 4
Figure 6: \(y < -x^2 + 4\)

Graph the second inequality and mark the shaded area differently than the first inequality.

$$ y > x - 2 $$

y >x - 2
Figure 7: \(y > x - 2 \) added to graph

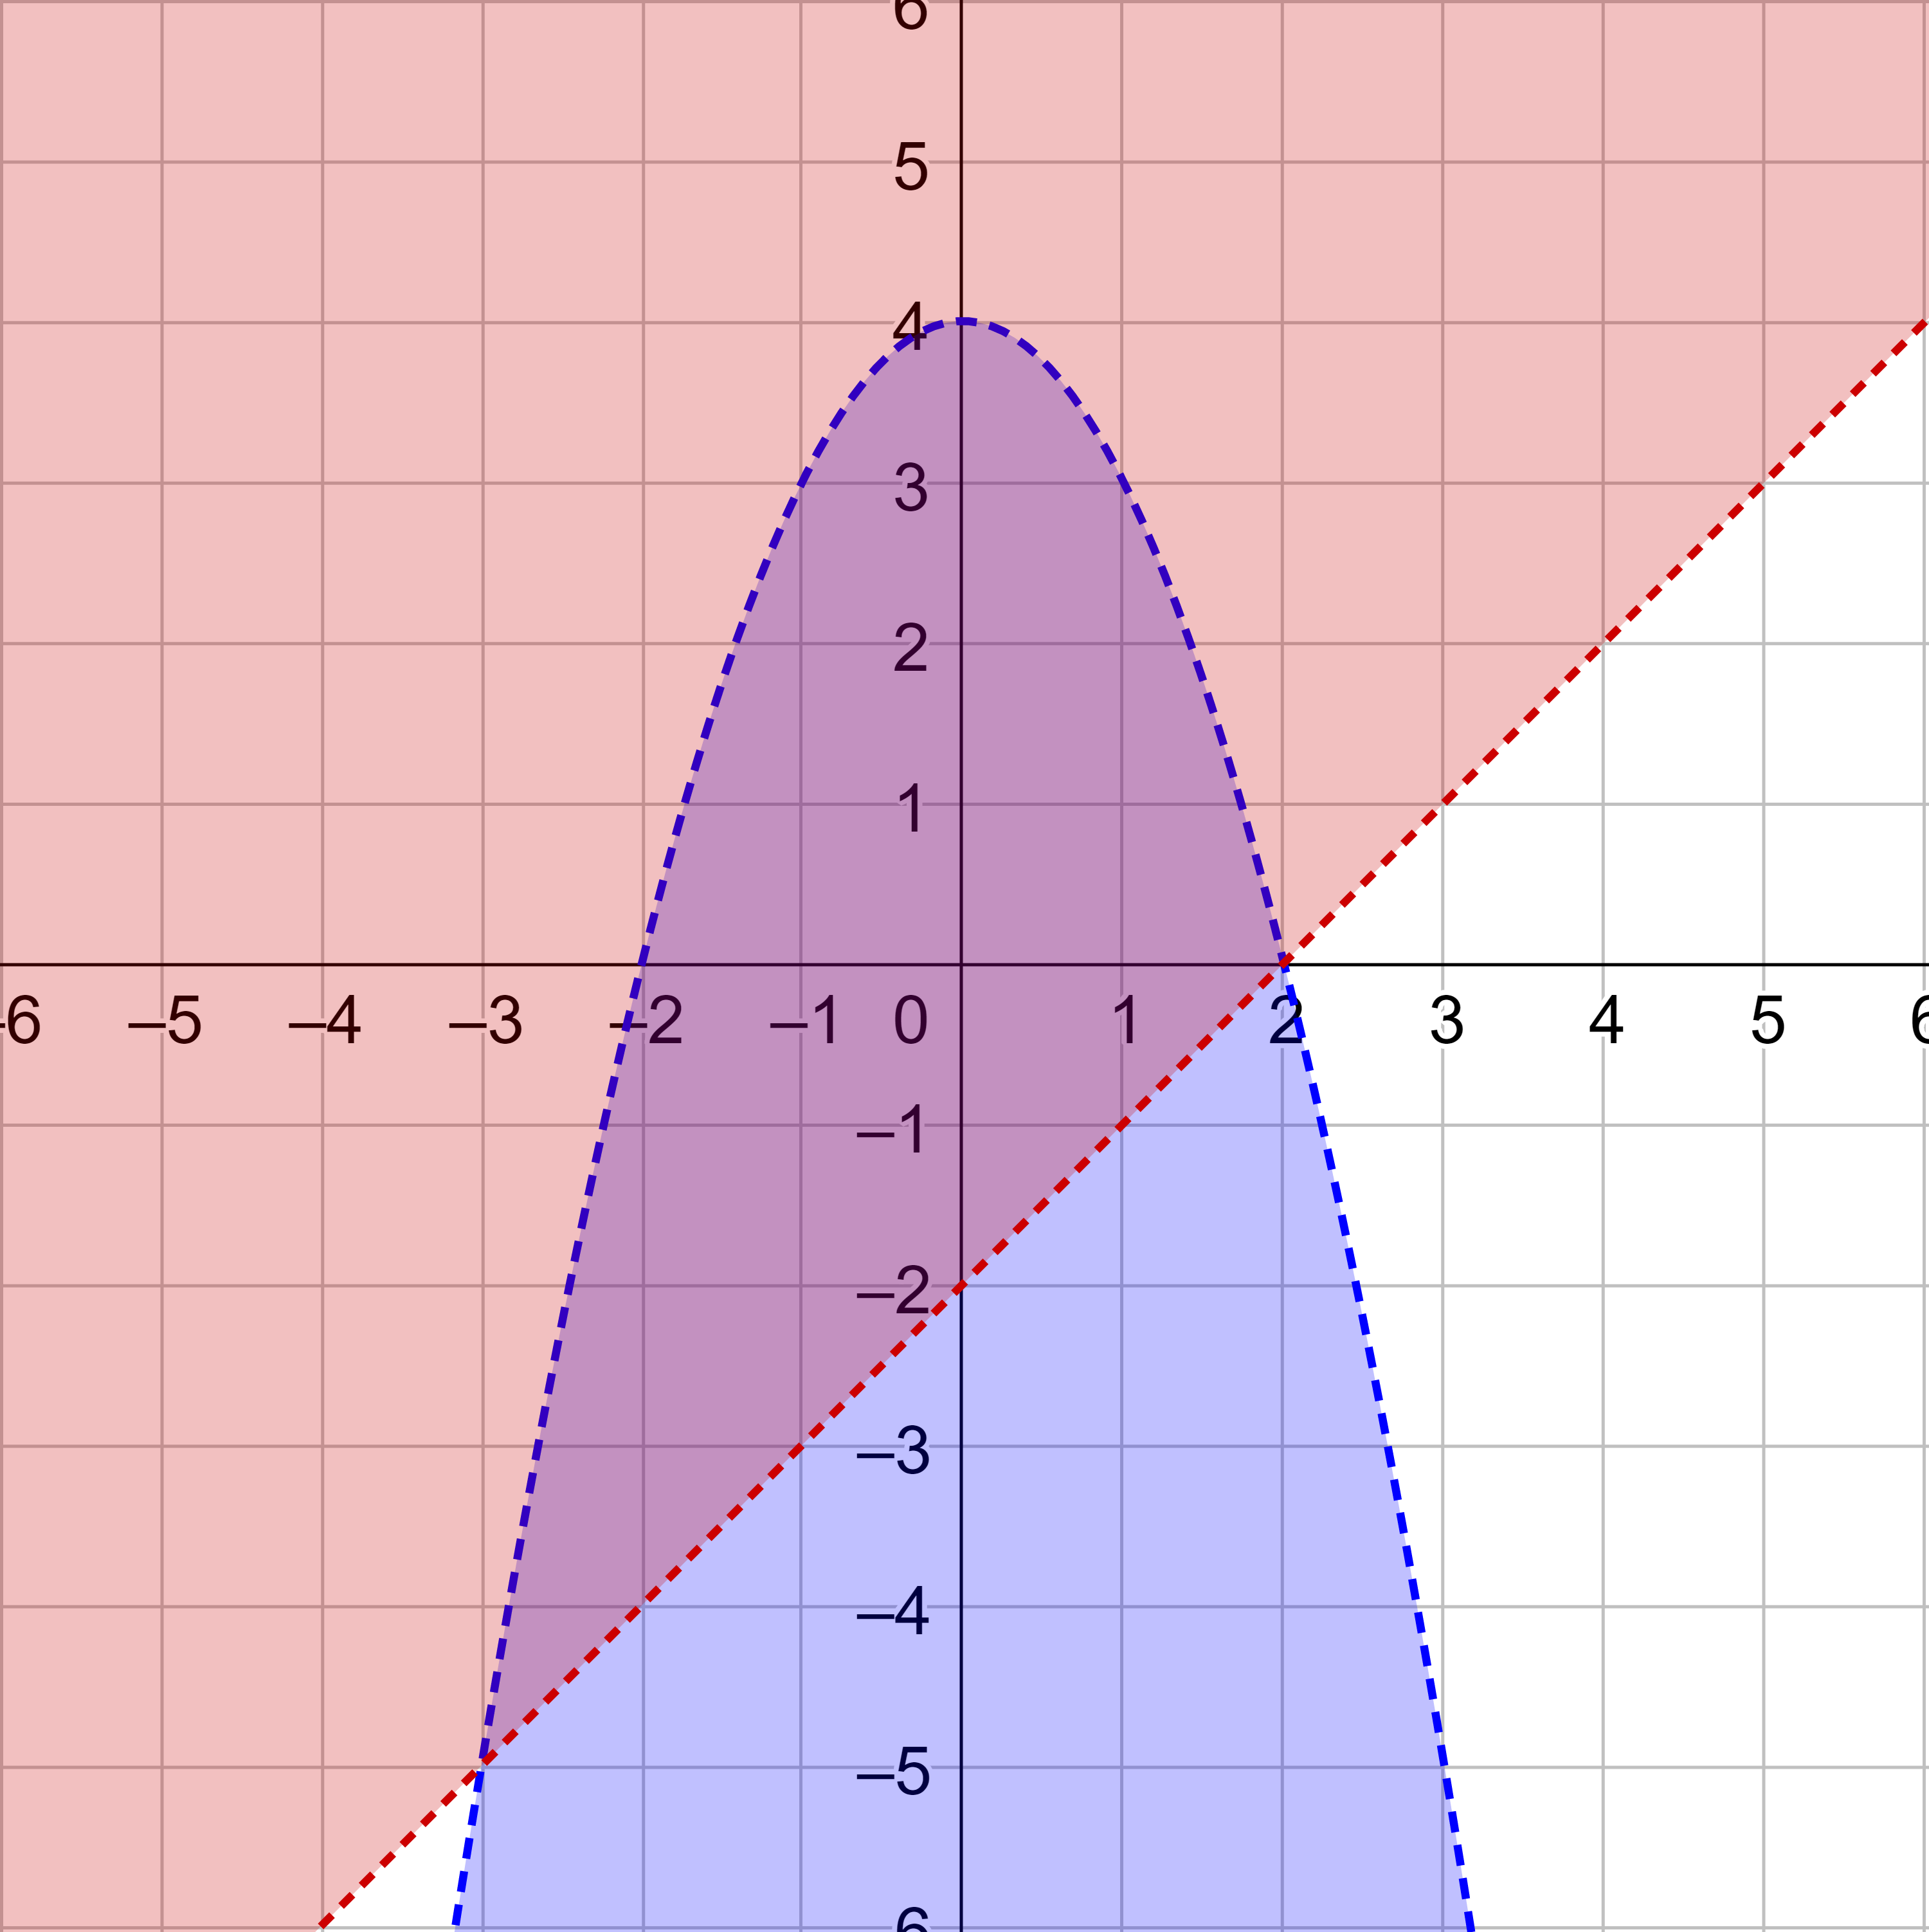
The solution is the area where both inequalities are shaded. Label the vertices of the solution area.

solution
Figure 8: The solution
Try It 2

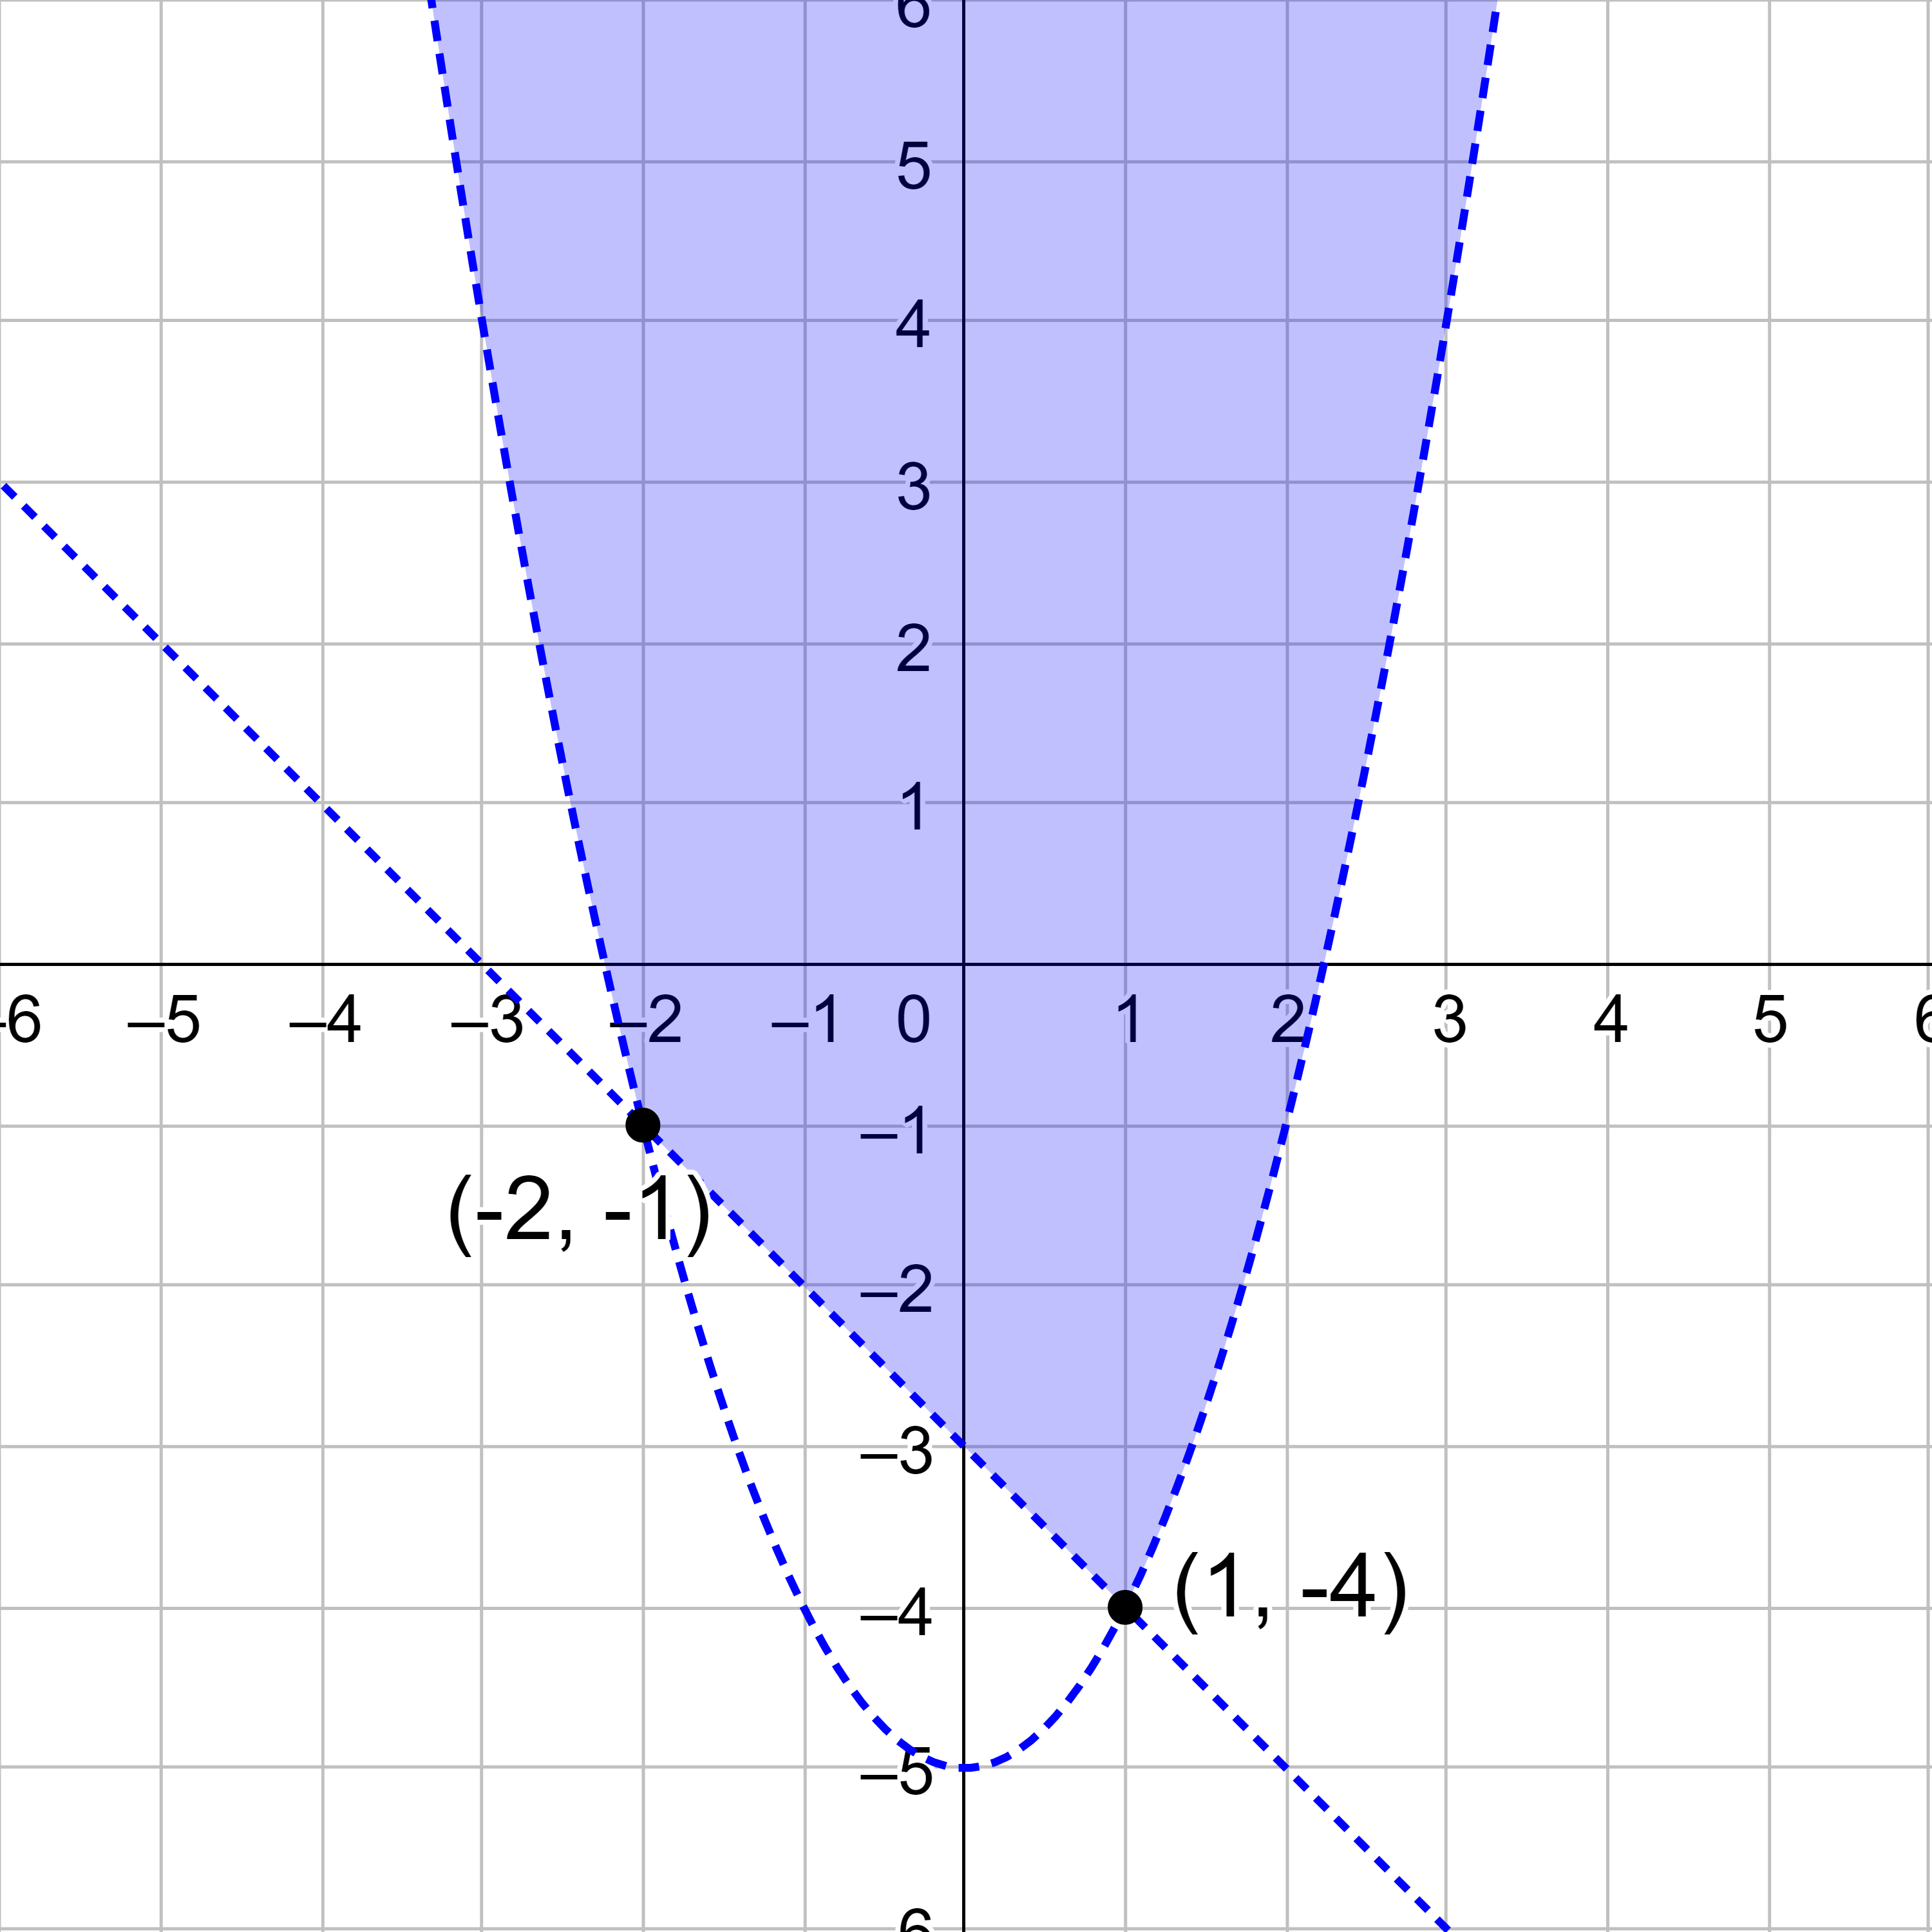
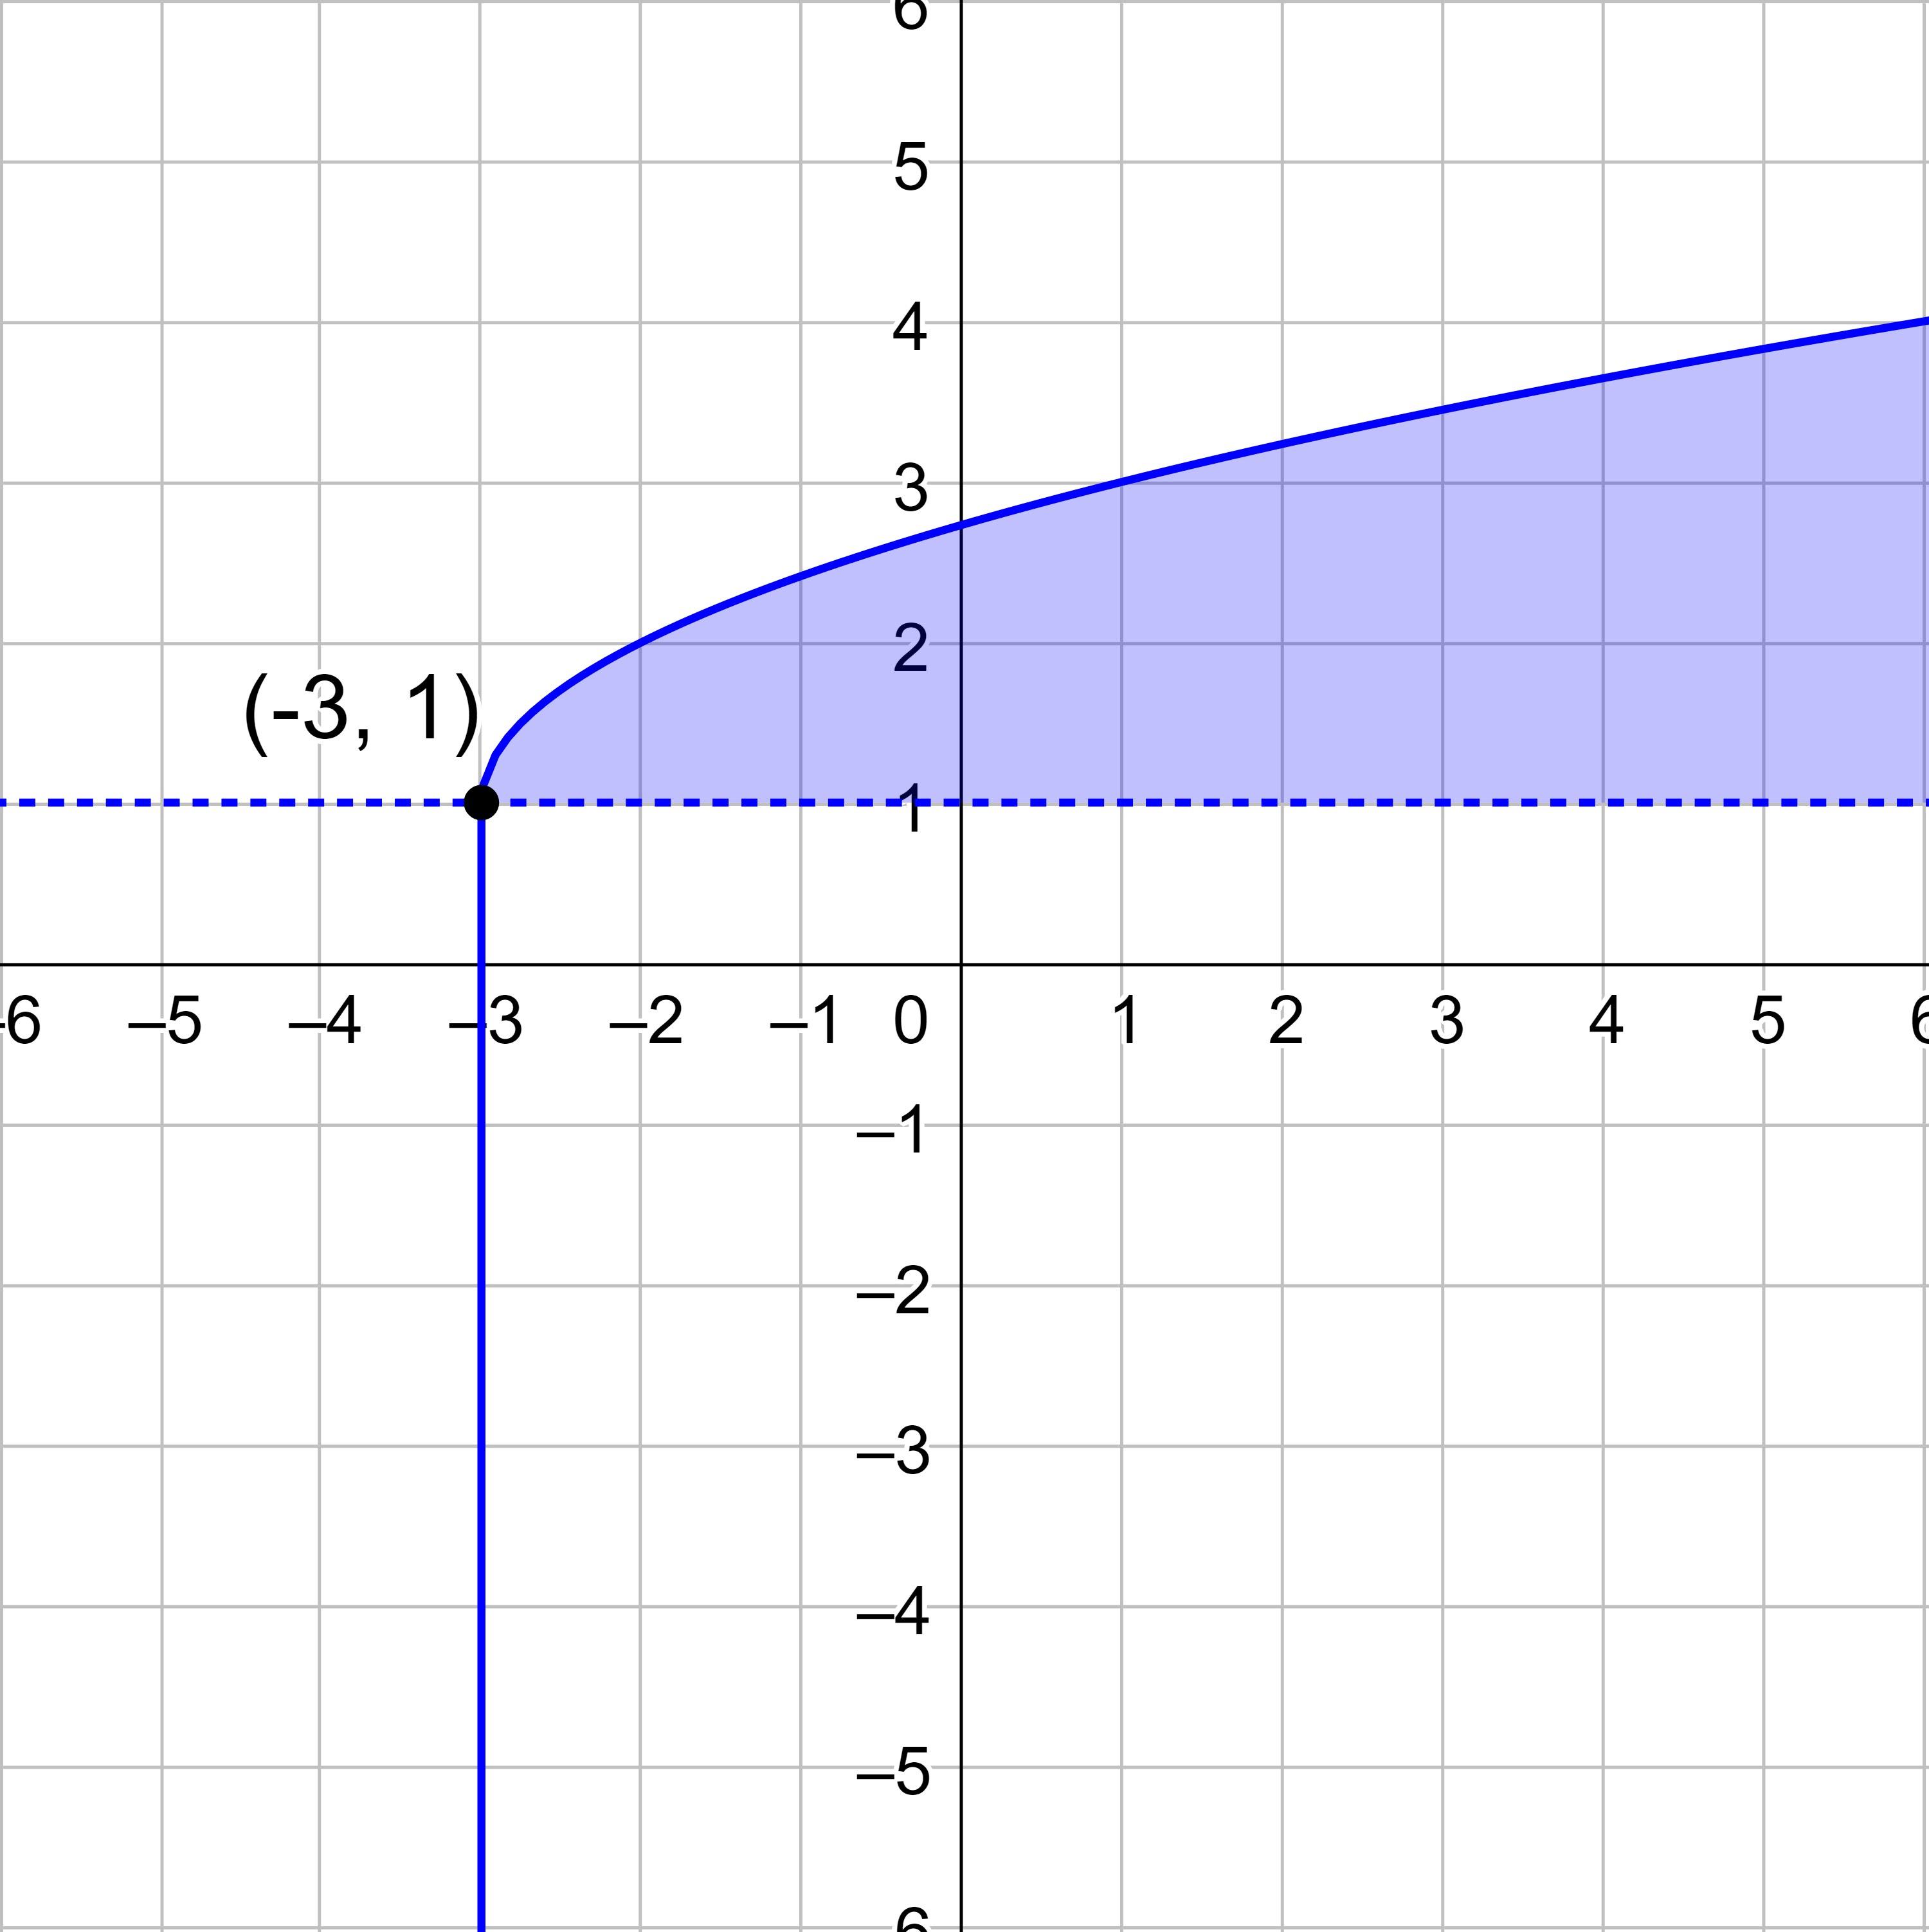
Solve \(\left\{\begin{align} y &≤ \sqrt{x + 3} + 1 \\ y &> 1 \end{align}\right.\) and label the vertices of the solution area.

Answer

answer

Application: Consumer Surplus and Producer Surplus

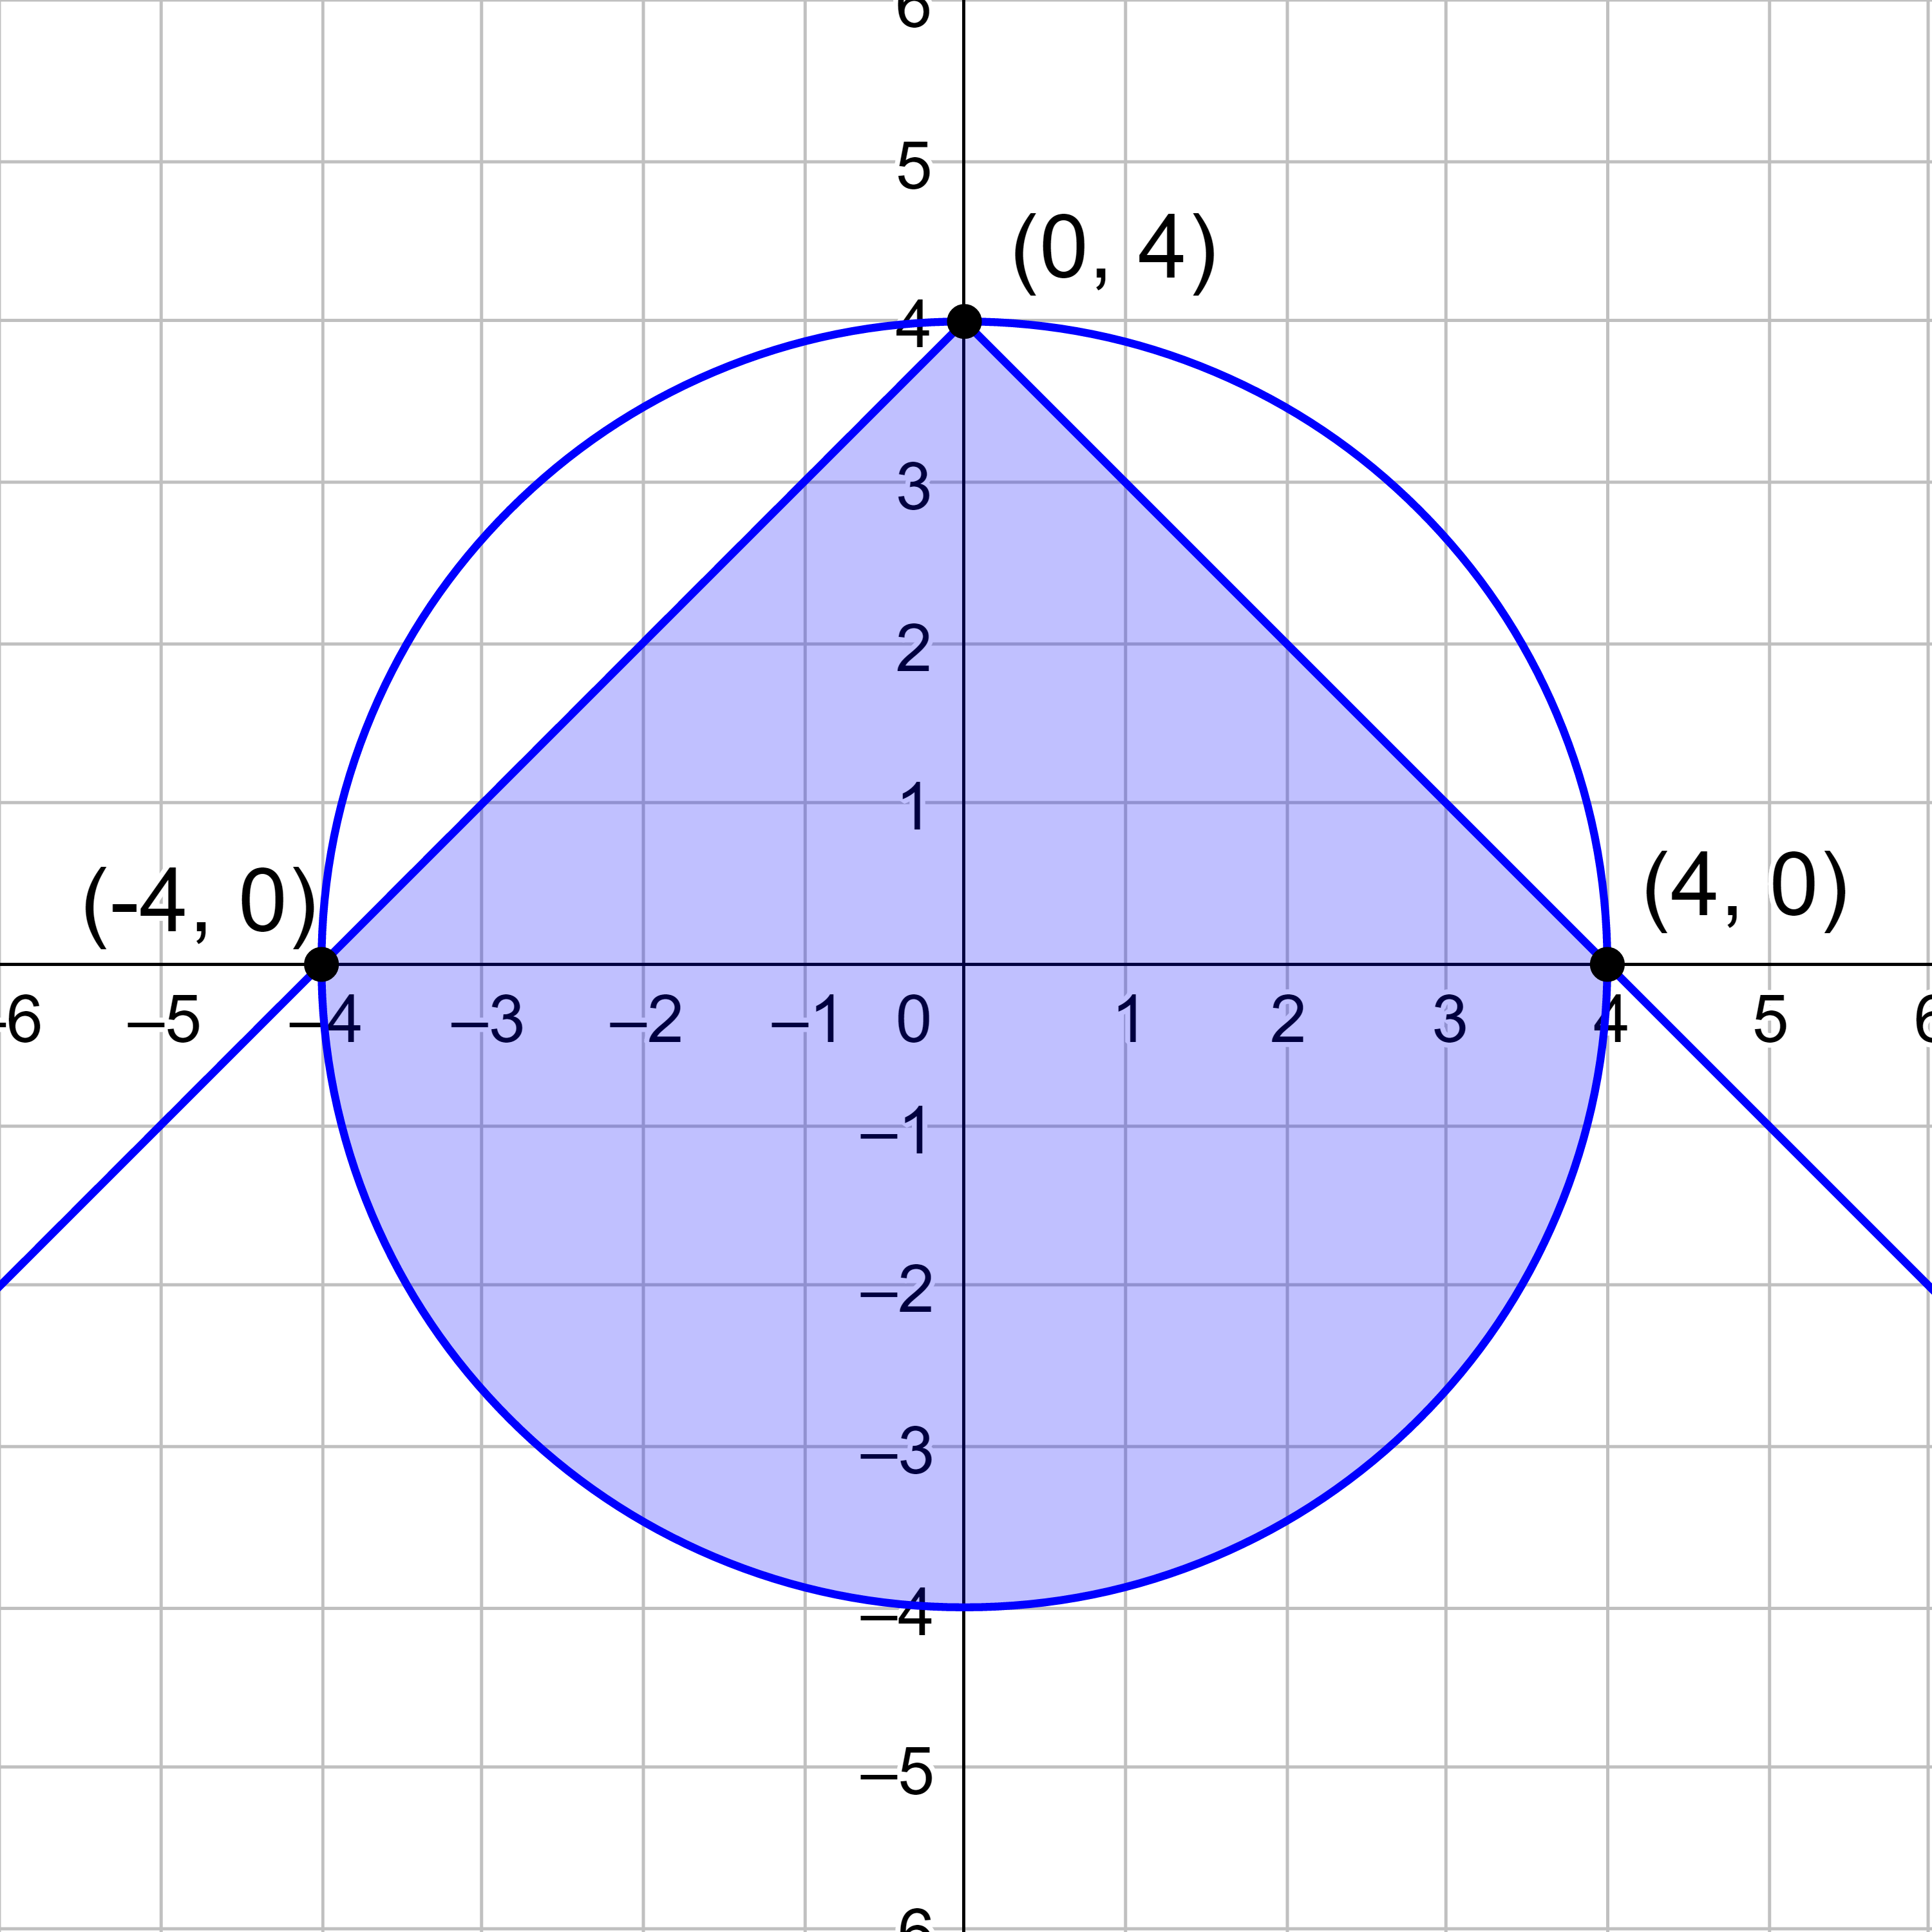
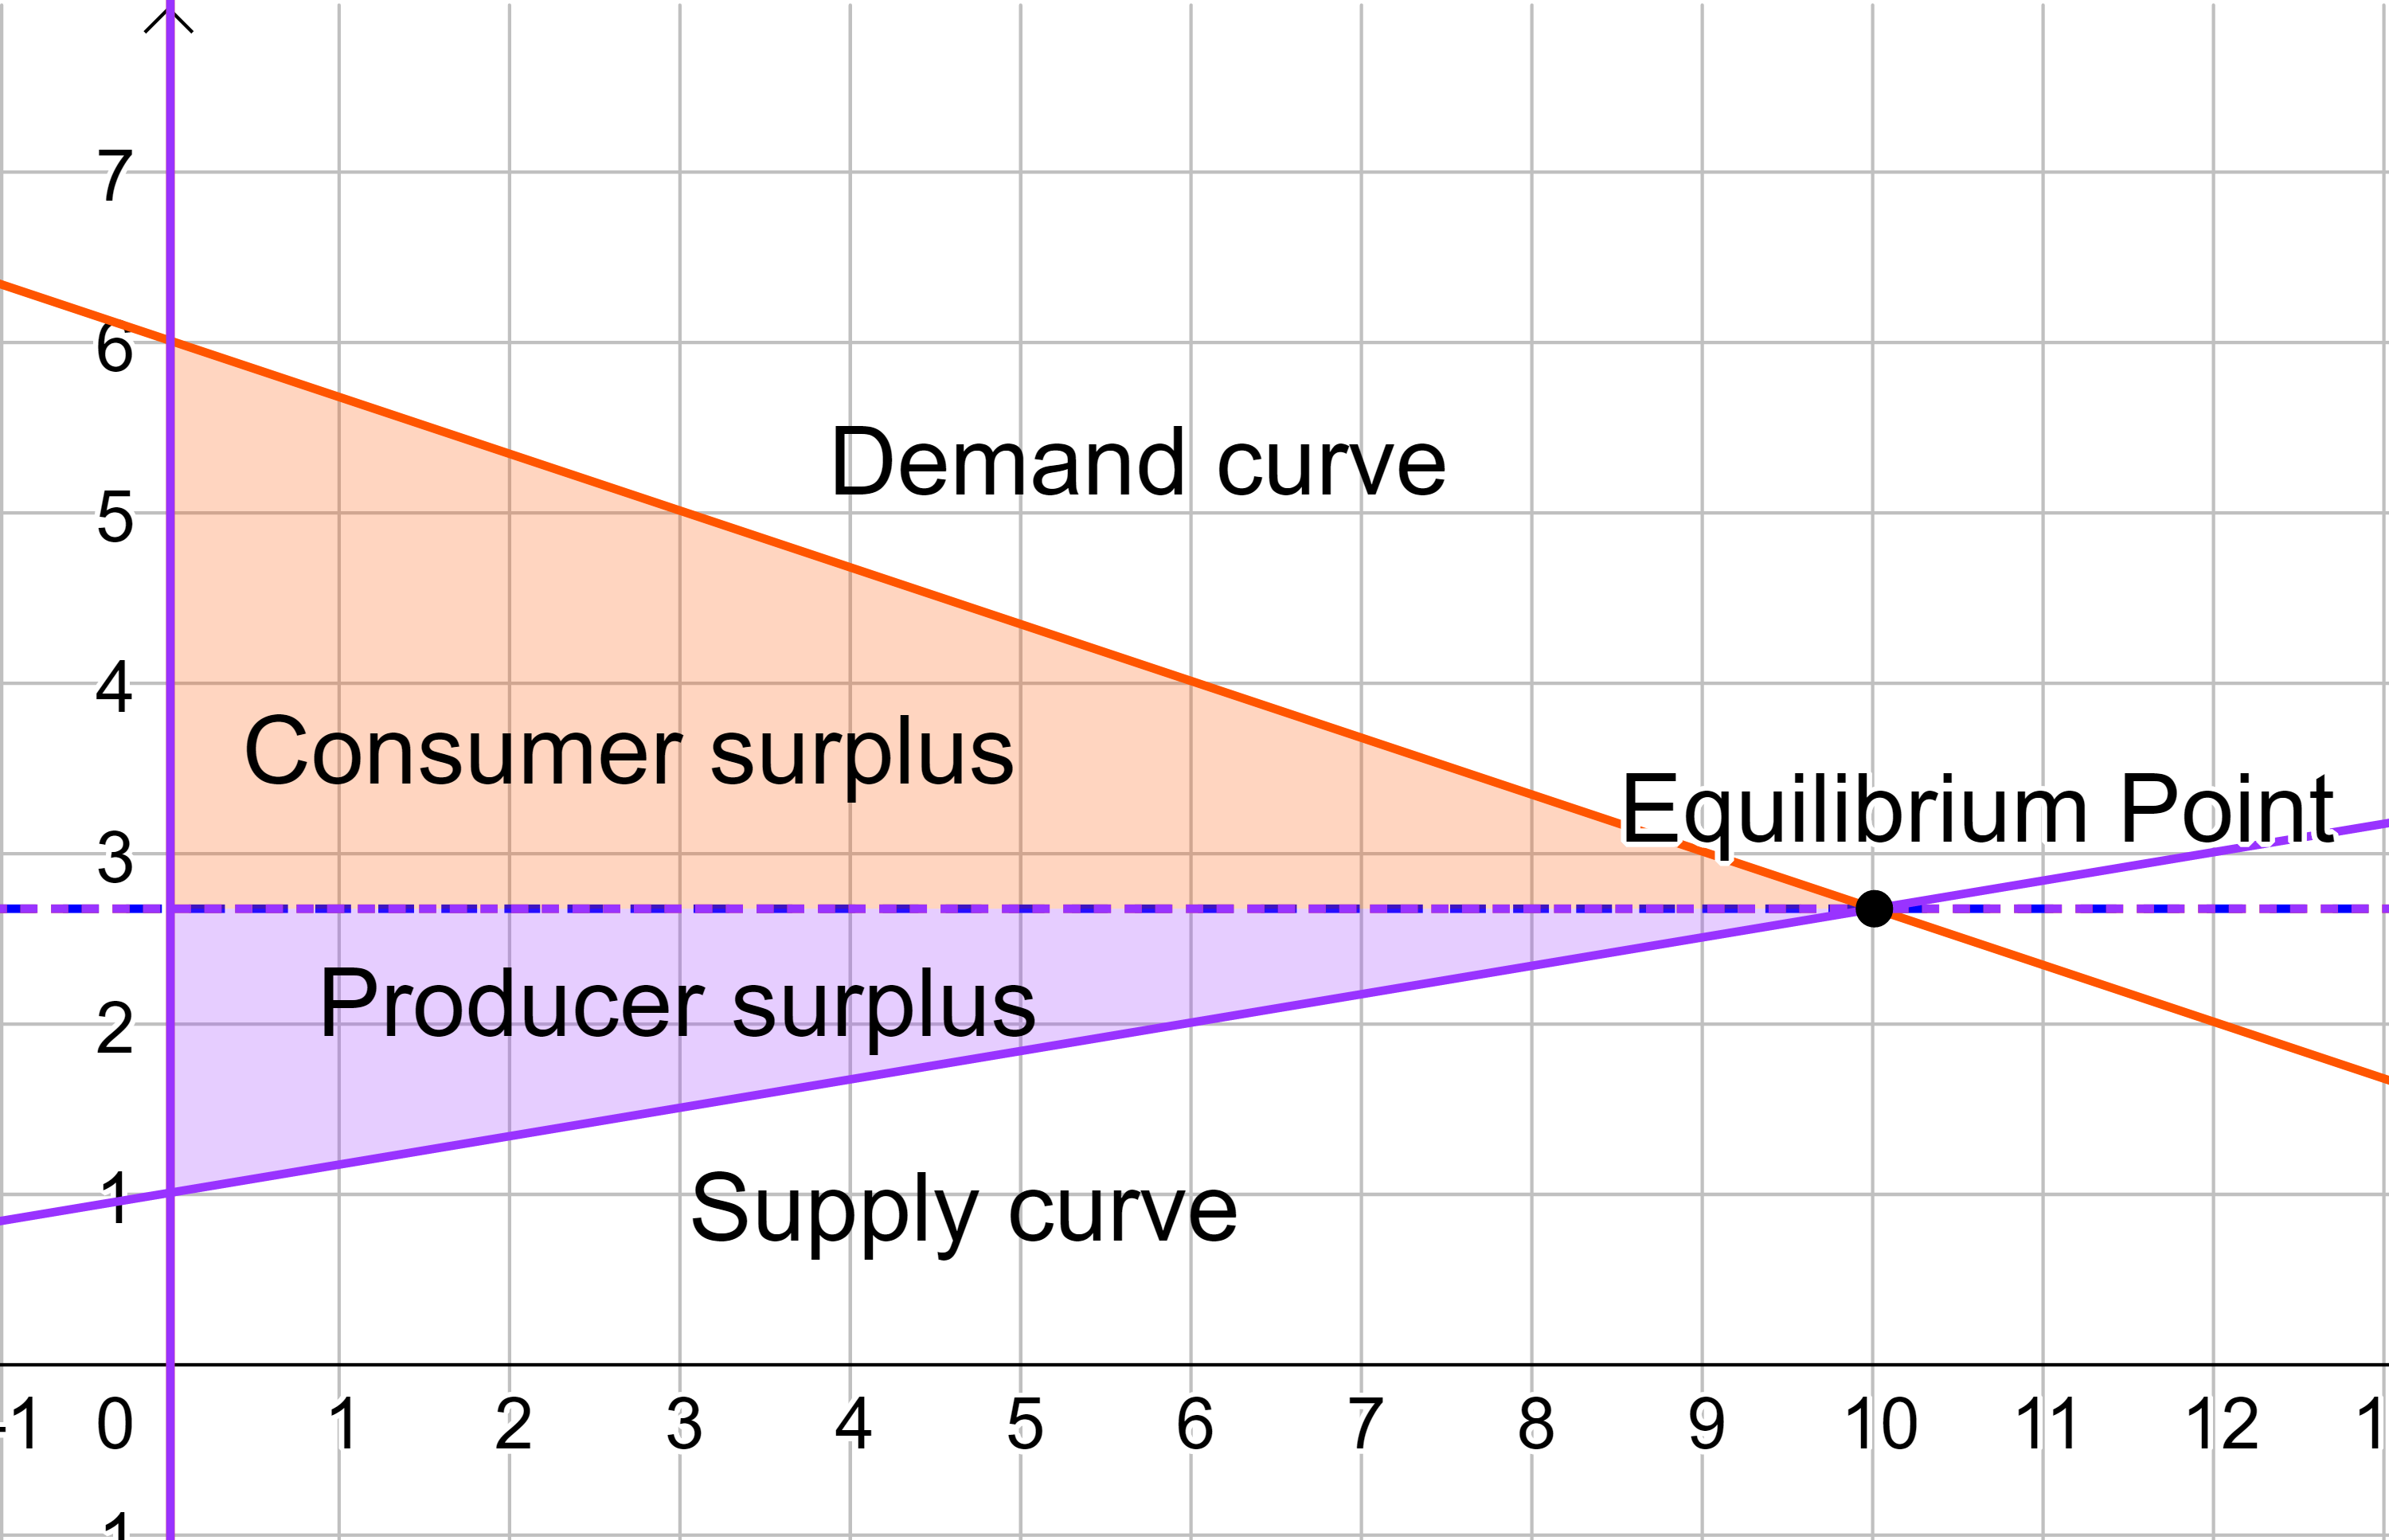
A manufacturer has to decide how much product to make. They find a model for consumer demand and another model for producer supply given as price as a function of the number of units. The point where the graphs of these two models meet is called the equilibrium point where the amount of supply equals the demand. The area under the demand curve and above the horizontal line through the equilibrium point is known as consumer surplus and is a measure of how much more consumers would be willing to pay above what they actually paid. Producer surplus is the area above the supply curve and below the horizontal line through the equilibrium point and is a measure of the amount that the producer would be willing to receive below what they actually received.

consumer and producer surplus
Figure 9: Consumer surplus and producer surplus.

Example 3: Consumer Surplus and Producer Surplus

Find the consumer surplus and producer surplus for the demand and supply equations \(\left\{\begin{align} p &= 100 - 2x \\ p &= 4 + x \end{align}\right.\)

Solution

Start by turning the equations into inequalities. The demand equation becomes ≤, and the supply equation becomes ≥.

$$ \left\{\begin{align} p &≤ 100 - 2x \\ p &≥ 4 + x \end{align}\right. $$

Graph the system of inequalities. Add a horizontal line through the equilibrium point.

consumer and producer surplus
Figure 10: Consumer surplus and producer surplus.

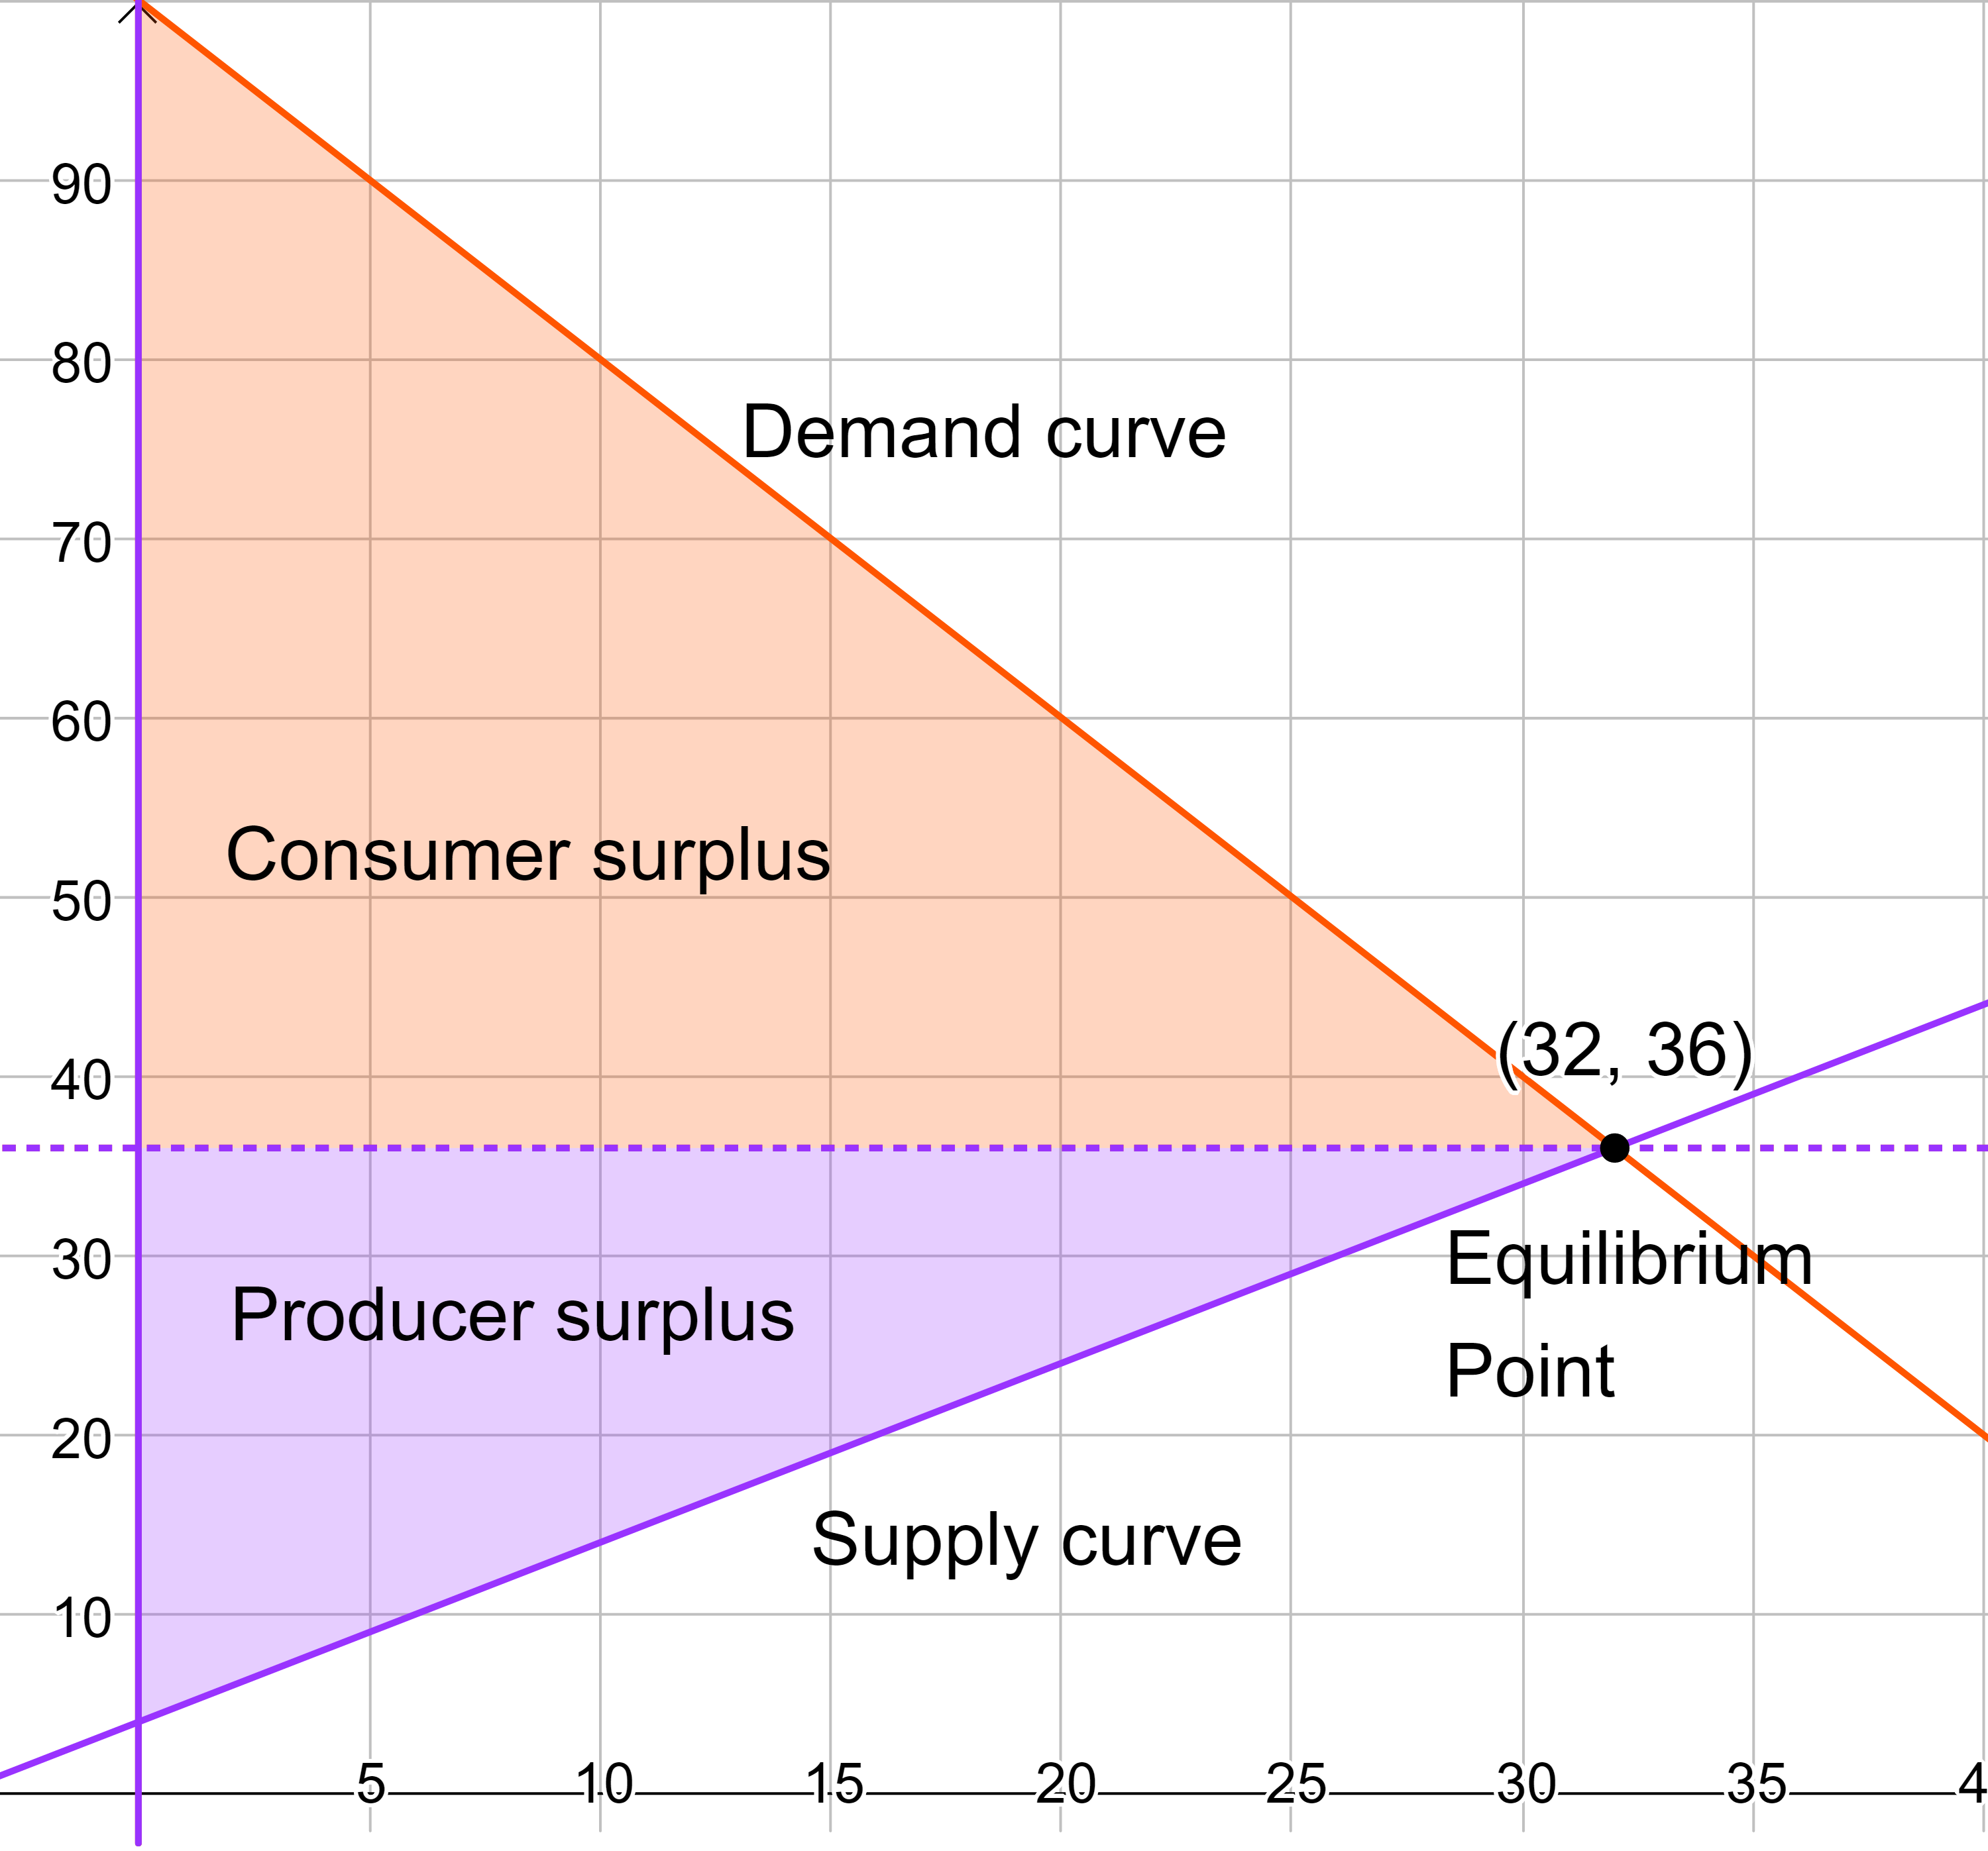
Now find the areas. The shapes are triangles so \(A = \frac{1}{2} bh\). Start with consumer surplus.

$$ A = \frac{1}{2} bh $$

$$ \text{Consumer surplus} = \frac{1}{2} (32)(64) $$

$$ \text{Consumer surplus} = $1024 $$

Now find the producer surplus.

$$ A = \frac{1}{2} bh $$

$$ \text{Producer surplus} = \frac{1}{2} (32)(32) $$

$$ \text{Producer surplus} = $512 $$

Try It 3

Find the consumer surplus and producer surplus for the demand and supply equations \(\left\{\begin{align} p &= 200 - x \\ p &= 50 + 2x \end{align}\right.\)

Answer

Consumer surplus = $1250; Producer surplus = $2500

Lesson Summary

Solve Systems of Inequalities
  1. Graph all the inequalities on the same coordinate plane.
  2. Find the intersection of the shaded areas.

Graph an Inequality
  1. Pretend the inequality sign is = and graph the line.
  2. Decide if the line is solid or dotted
  3. Shade

Helpful videos about this lesson.

Practice Exercises

  1. What does consumer surplus and producer surplus indicate?
  2. Solve the system of inequalities and label the vertices of the solution area.

  3. \(\left\{\begin{align} y &≥ 2x - 2 \\ y &≤ \frac{1}{2} x + 1 \\ y &≥ -2 \end{align}\right.\)
  4. \(\left\{\begin{align} x - y &> -2 \\ x &< 3 \\ y &> -3 \end{align}\right.\)
  5. \(\left\{\begin{align} 4x + y &≥ -6 \\ x - 4y &≥ -10 \\ x + y &< 5 \end{align}\right.\)
  6. \(\left\{\begin{align} y &> x^2 - 5 \\ y &> -x - 3 \end{align}\right.\)
  7. \(\left\{\begin{align} y &> (x - 1)^2 - 4 \\ y &≤ -(x + 2)^2 + 5 \end{align}\right.\)
  8. \(\left\{\begin{align} &x^2 + y^2 ≤ 16 \\ &y ≤ -|x| + 4 \end{align}\right.\)
  9. \(\left\{\begin{align} &\frac{x^2}{16} + \frac{(y - 1)^2}{9} ≥ 1 \\ &y ≤ -\frac{1}{3} x^2 + 2 \end{align}\right.\)
  10. Find the consumer surplus and producer surplus for the demand and supply equations.

  11. \(\left\{\begin{align} p &= 90 - x \\ p &= 10 + x \end{align}\right.\)
  12. \(\left\{\begin{align} p &= 120 - 3x \\ p &= 30 + 2x \end{align}\right.\)
  13. Mixed Review

  14. (8-04) Write the partial fractions for the rational expression, but do not solve for the variables: \(\frac{x + 2}{x^3 - 2x}\).
  15. (8-04) Write the partial fractions for \(\frac{3x + 2}{x^2 + 2x}\).
  16. (8-03) Solve \(\left\{\begin{align} x - 2y + z &= 4 \\ y + z &= 6 \\ z &= 5 \end{align}\right.\).
  17. (8-02) An instrument company makes guitars and is starting production on a new model. It has a one-time cost of $10,050 to set up the factory production line and materials cost $150 per guitar. The company is going to sell the the guitars for $300 each. How many guitars do they need to sell to break even, where the costs equal the revenue?
  18. (8-01) Solve by substitution \(\left\{\begin{align} &\frac{x^2}{4} + y^2 = 1 \\ &y = 2x \end{align}\right.\).

Answers

  1. Consumer surplus is the amount consumers would pay above what they did pay. Producer surplus is the amount producers would accept below what they received.
  2. answer
  3. answer
  4. answer
  5. answer
  6. answer
  7. answer
  8. answer
  9. Consumer surplus: $800; Producer surplus: $800
  10. Consumer surplus: $486; Producer surplus: $324
  11. \(\frac{A}{x} + \frac{Bx + C}{x^2 - 2}\)
  12. \(\frac{1}{x} + \frac{2}{x + 2}\)
  13. (1, 1, 5)
  14. 67 guitars
  15. \(\left(\frac{2\sqrt{17}}{17}, \frac{4\sqrt{17}}{17}\right), \left(-\frac{2\sqrt{17}}{17}, -\frac{4\sqrt{17}}{17}\right)\)