Precalculus by Richard Wright
Has this helped you?
This book is available
in print and ebook.

Precalculus by Richard Wright
Has this helped you?
This book is available
in print and ebook.
Come to me, all you who are weary and burdened, and I will give you rest. Matthew 11:28 NIV
Summary: In this section, you will:
SDA NAD Content Standards (2018): PC.4.1, PC.5.3

Credit card companies charge interest every day. Banks pay interest every month. How much money would be owed after several years? Or how much money is in a bank account after 10 years? These questions can be answered using exponential functions.
Repeated addition is multiplication. For example, 4 + 4 + 4 + 4 + 4 = 5(4). Repeated multiplication is exponents. For example, 4 ⋅ 4 ⋅ 4 ⋅ 4 ⋅ 4 = 45. An exponential function is a function that has the variable in the exponent.
An exponential function is in the form of
f(x) = abx
where b > 0, b ≠ 1, and x is a real number.
Use a calculator to evaluate the following functions.
Solution
f(3) = 23 On a TI-84 calculator, type Á › Â Í. The display reads 8.
On a NumWorks calculator, type 2 p 3 X. The display reads 8.
g(3) = 5(3)3 + 1 On a TI-84 calculator, type · £ Â ¤ › £ Â Ã À ¤ Í. The display reads 405.
On a NumWorks calculator, type 5 ( 3 ) p 3 + 1 R X. The display reads 405.
h(−2) = 6−(−2) On a TI-84 calculator, type ¸ › Ì £ Ì Á ¤ Í. The display reads 36.
On a NumWorks calculator, type 6 p - ( - 2 ) R X. The display reads 36.
Evaluate f(x) = 2x − 1 when x = 5
Answer
1⁄8 = 0.125
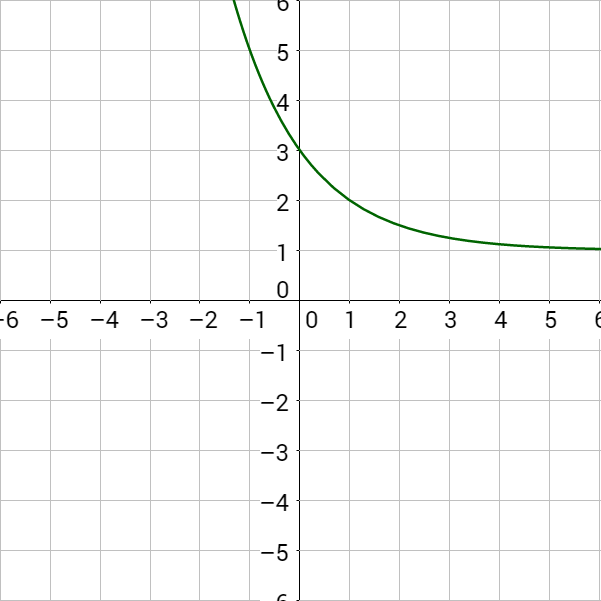
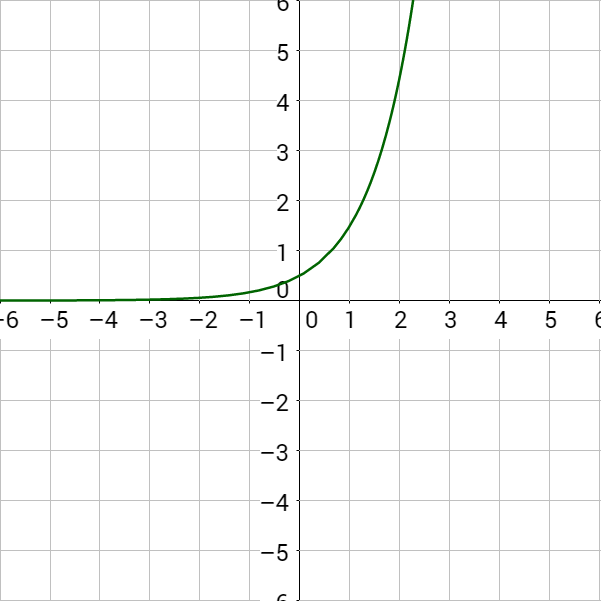
The graphs of exponential functions have a characteristic ever-changing curve as in figure 2.
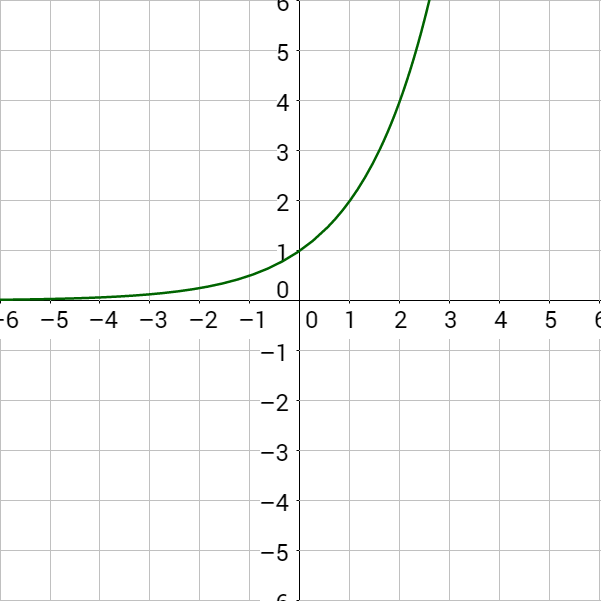
Notice the domain is all real numbers because any real number can be an exponent. The range is y > 0 if a > 0; and y < 0 if a < 0. The y-intercept is (0, a), and horizontal asymptote is y = 0.
For f(x) = abx, then
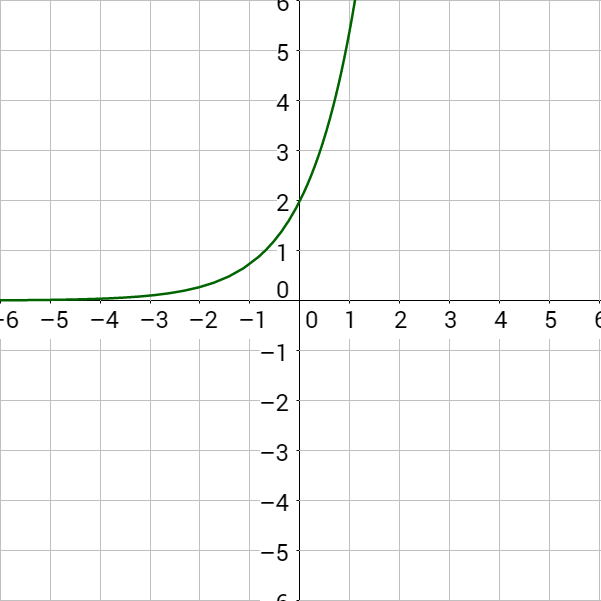
Graph
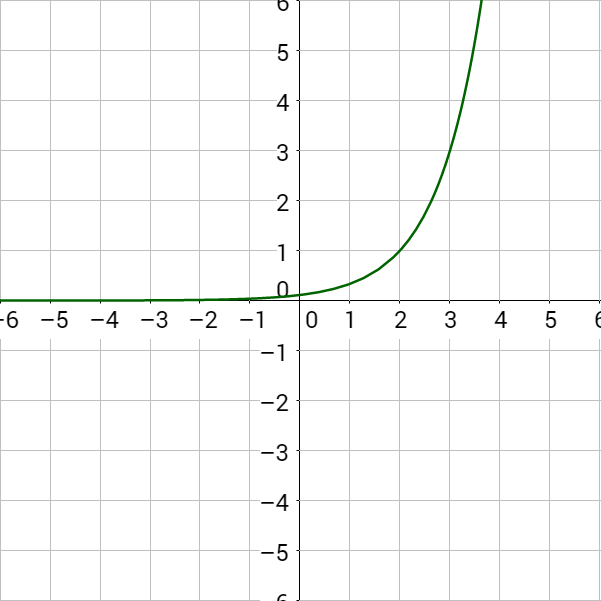
Are these exponential growth or decay?
Solution
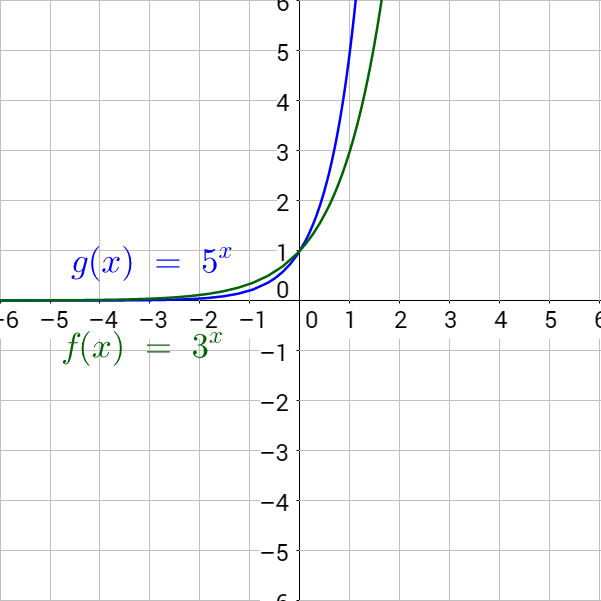
Since b > 0 in both cases, this is exponential growth. Notice the graph increases.
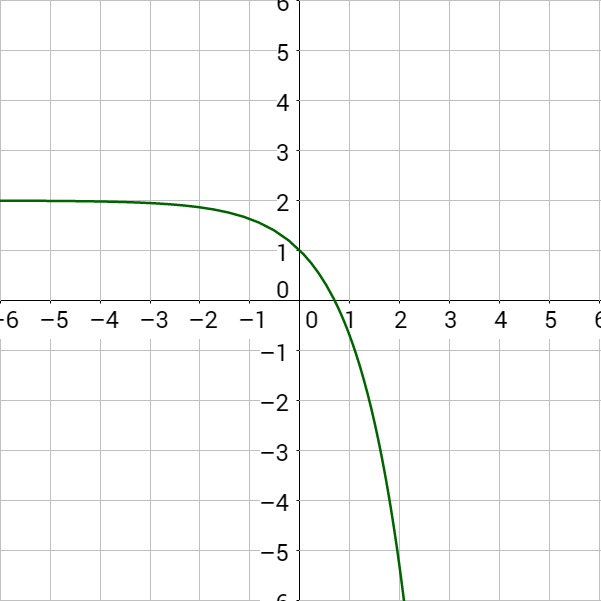
Graph
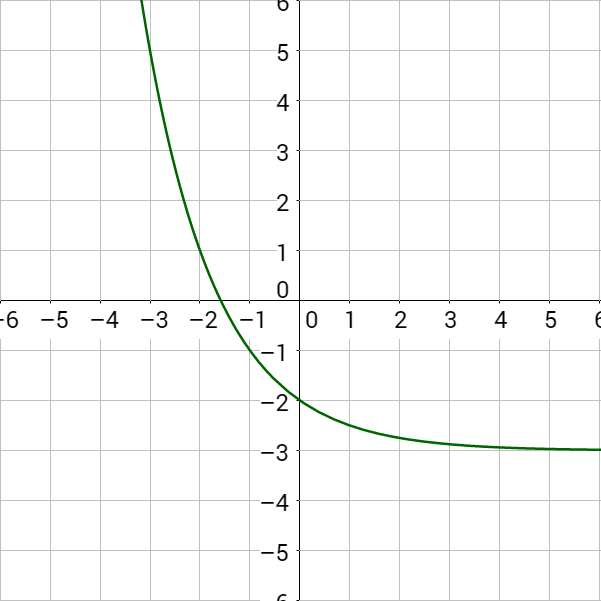
Are these exponential growth or decay?
Solution
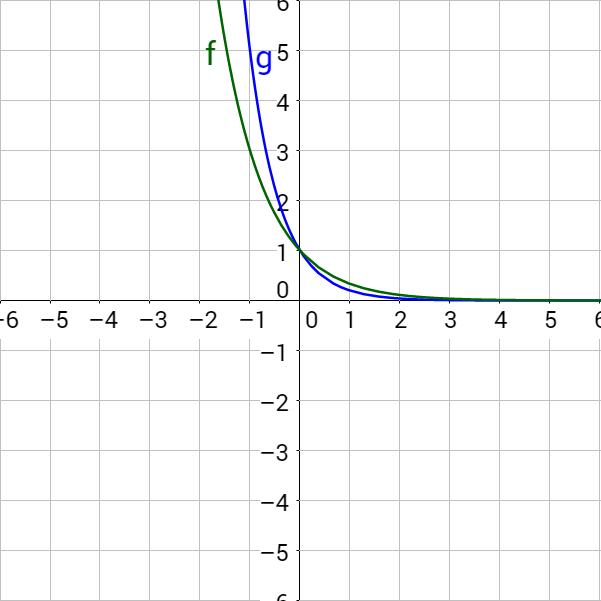
Since b < 0 in both cases, this is exponential decay. Notice the graph decreases.
Graph
Answer
Notice the graphs of exponential growth functions like those in Example 2 always increase. The graphs of exponential decay functions like those in Example 3 always decrease. Because the graphs never switch from increasing to decreasing or vise versa, each input corresponds to a unique output. This type of function is called one-to-one. Each x gives a unique y-value that is not paired with another x.
Exponential functions follow the rules of transformations as given in Lesson 1-07.
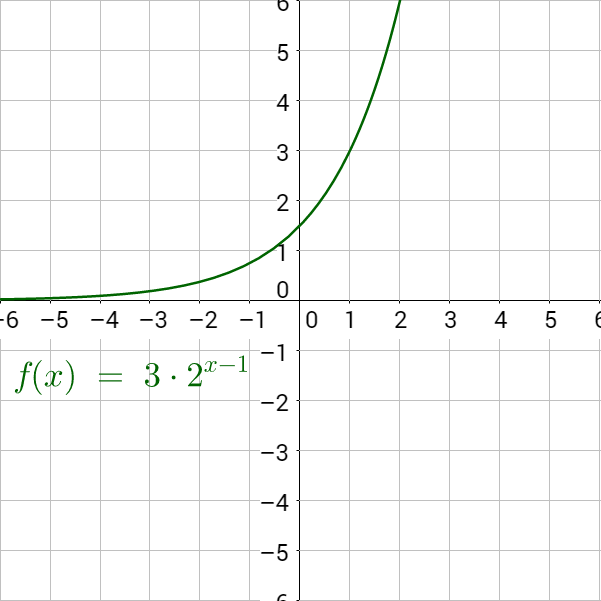
Describe the transformation and graph the following functions.
Solution
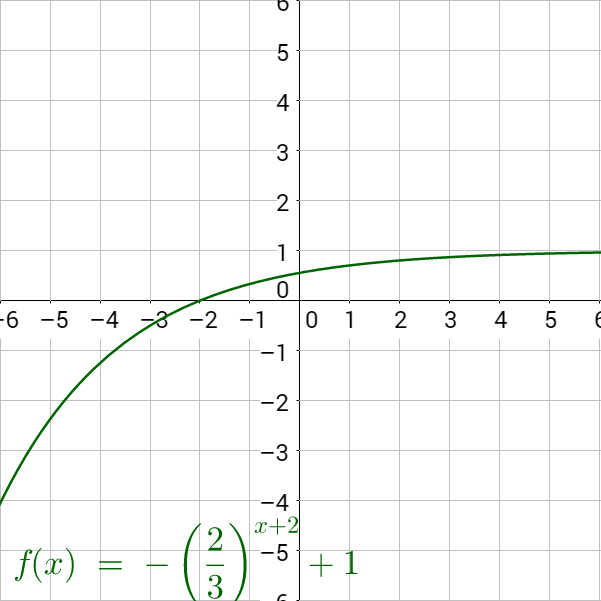
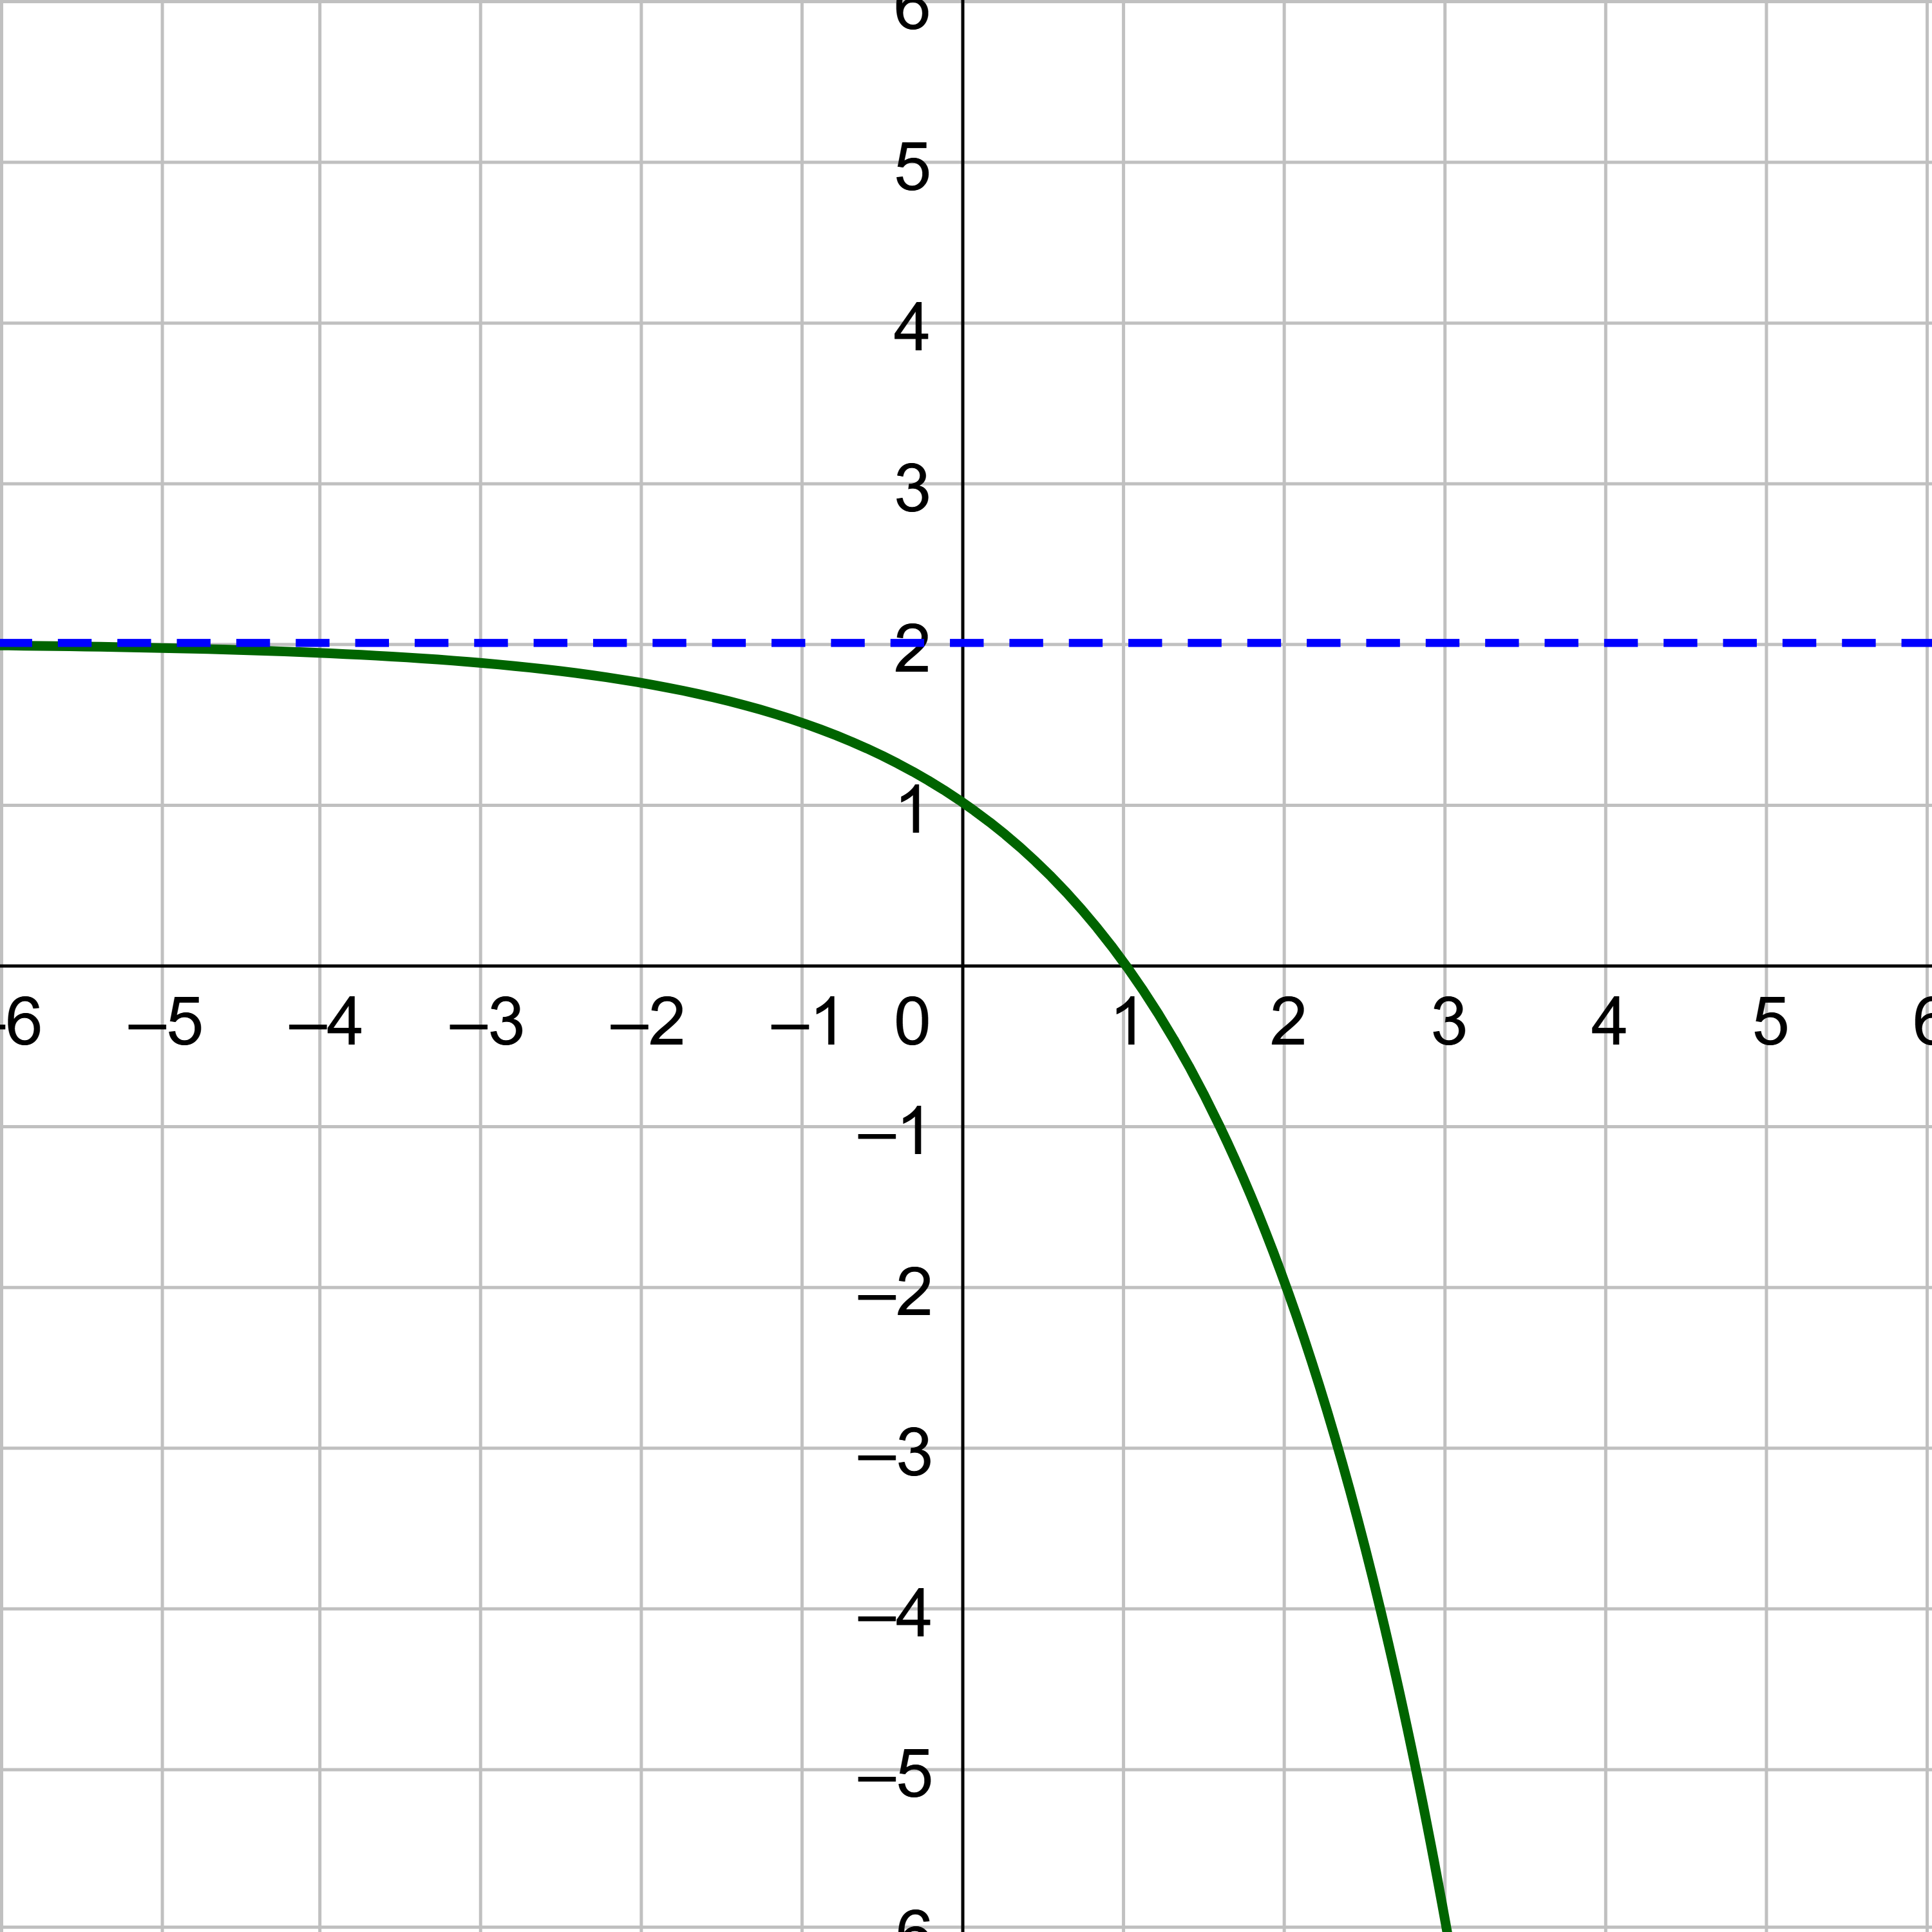
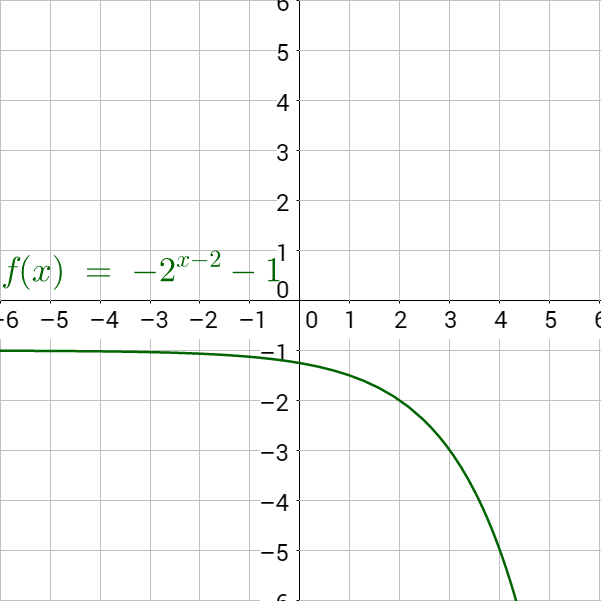
Describe the transformation and graph the following function: f(x) = −(2)x − 2 − 1.
Answer
Reflected over the x-axis, shifted right 2 and down 1.
Many uses of exponential functions are simplest using the number e ≈ 2.718281828…. This number is called the natural base and is found by letting n get very large and approach ∞ in the expression . The natural base, e, can be useful in calculus because the slope of the function f(x) = ex is also ex. For example, the slope of the graph of f(x) = ex at x = 2 is e2.
Use a calculator to evaluate the following functions.
Solution
f(3) = e3 In a TI-84 calculator, type y J Â Í. The display reads 20.086.
On a NumWorks calculator, type e 3 R X. The display reads 20.086.
g(3) = 5(e)3 + 1 In a TI-84 calculator, type · y J £ Â Ã À ¤ Í. The display reads 272.991.
On a NumWorks calculator, type 5 e 3 + 1 R X. The display reads 272.991.
h(−2) = e−(−2) In a calculator, TI-84 type y J k £ k Á ¤ Í. The display reads 7.389.
On a NumWorks calculator, type e - ( - 2 ) R X. The display reads 7.389.
Evaluate j(x) = 2ex + 1 when x = −3.
Answer
0.736
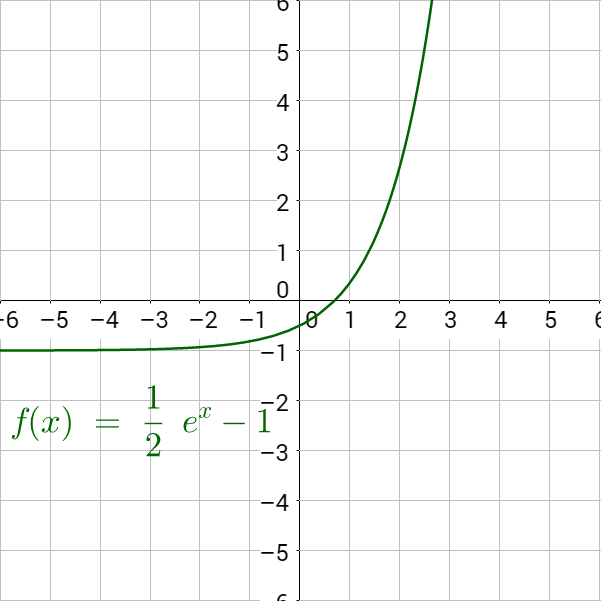
Graph .
Solution
When a credit card company or bank calculates, or compounds, interest, they quote a yearly interest rate. But the banks then calculate interest monthly or daily. To derive a formula for calculating compound interest, look at the pattern. In the following table P is the principle and r is the yearly interest rate (APR). Each year's interest is calculated by Pr. The amount in the account will be P + Pr which is the principle plus the interest. This factors to P(1 + r).
| Year | Balance |
|---|---|
| 0 | P0 = P |
| 1 | P1 = P0(1 + r) = P(1 + r) |
| 2 | P2 = P1(1 + r) = P(1 + r)(1 + r) = P(1 + r)2 |
| 3 | P3 = P2(1 + r) = P(1 + r)2(1 + r) = P(1 + r)3 |
| t | Pt = P(1 + r)t |
If the interest is compounded n times per year, the formula needs to be modified to .
Now think about what happens as the number of compoundings per year gets very large. The most often interest can be compounded is continuously where the interest is calculated every instant when n = ∞. To derive the formula for continuously compounded interest, let m = n⁄r, so n = mr.
For continuous compounding, m becomes large and approaches ∞. The expression in parentheses is the definition of e when m approaches ∞.
A = Pert
where A is the current amount, P is the principle or initial amount, r is the interest rate as a decimal, n is the number of compoundings per year, and t is the time in years.
Continuously Compounded Interest
A = Pert
A high school student deposits $1000 in a mutual fund that averages 8% APR interest. How much is the mutual fund worth after 10 years if the interest is compounded
Which scenario gives the most money?
Solution
P = $1000 because that is the initial amount of money. r = 0.08 or 8%, and t = 10 yrs.
Compounding continuously produces the most money. The higher the value of n, the more money there is in the account. That is why banks pay interest monthly, but charge interest on credit cards daily.
A college student goes on a weekend shopping spree and charges $500 on a credit card that charges 25% APR interest compounded daily. If they don't pay anything, how much will they owe after 1 year?
Answer
$641.96 plus late payment fees
An exponential function is in the form of
f(x) = abx
where b > 0, b ≠ 1, and x is a real number.
For f(x) = abx, then
\(A = P\left(1+\frac{r}{n}\right)^{nt}\)
where A is the current amount, P is the principle or initial amount, r is the interest rate as a decimal, n is the number of compoundings per year, and t is the time in years.
Continuously Compounded Interest
A = Pert
Helpful videos about this lesson.