Precalculus by Richard Wright
Has this helped you?
This book is available
in print and ebook.

Precalculus by Richard Wright
Has this helped you?
This book is available
in print and ebook.
The Lord is my rock, my fortress and my deliverer; my God is my rock, in whom I take refuge, my shield and the horn of my salvation, my stronghold. Psalms 18:2 NIV
Summary: In this section, you will:
SDA NAD Content Standards (2018): PC.7.1, PC.7.2

Exponential models are often used to model population. Consider rabbits. They breed quickly and a rabbit population can quickly grow. If each rabbit has six babies, this would be exponential growth with the base of 6. The population will not grow exponentially forever, some rabbits will die from old age, predators, or starvation. As the number of rabbits increases, the available food supply does not change, so there will not be enough food for all the rabbits, and some will starve. The population will eventually level out and quit growing. This population level is called the carrying capacity. In this lesson, various exponential and logarithmic models will be discussed and used to solve real world problems.
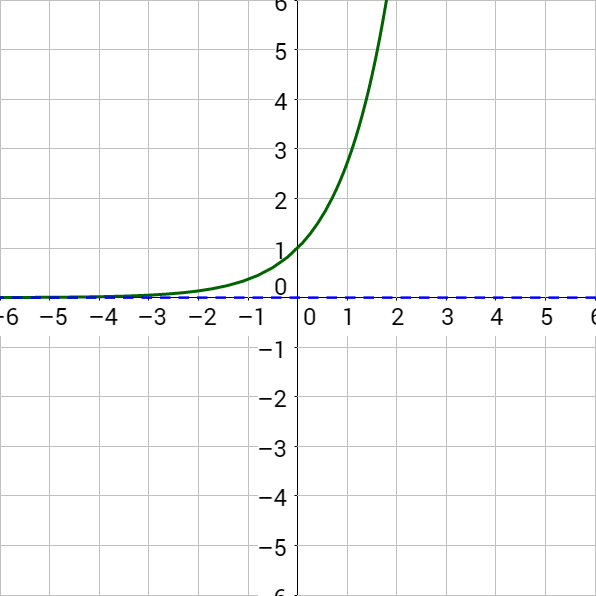
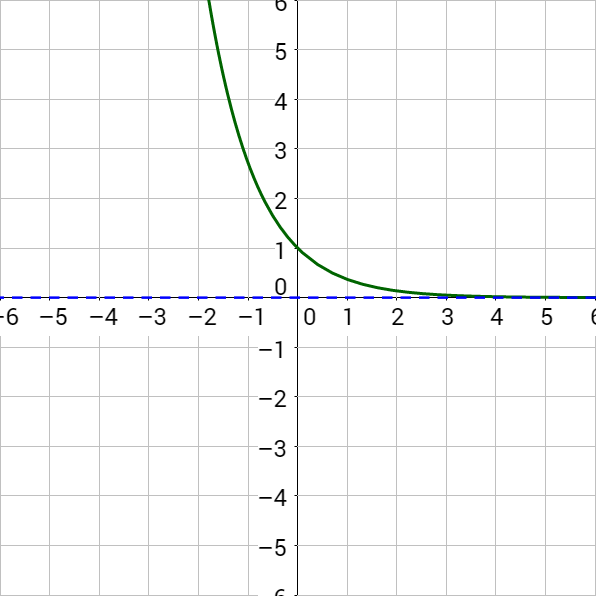
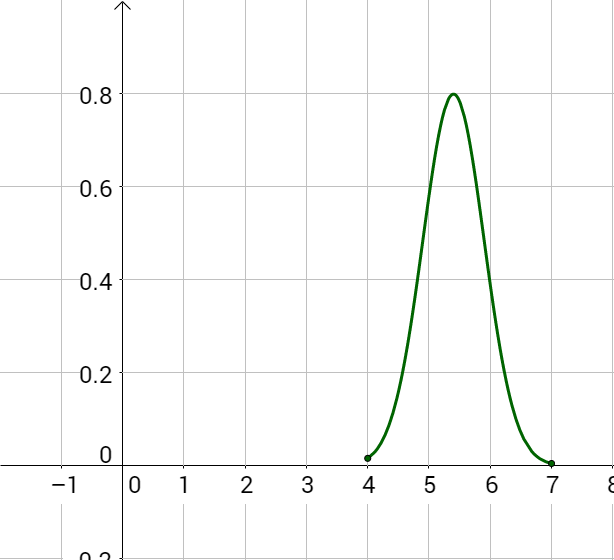
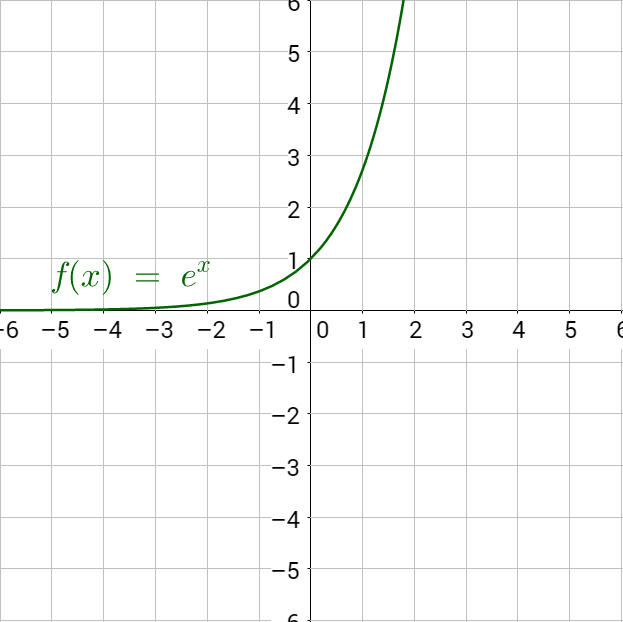
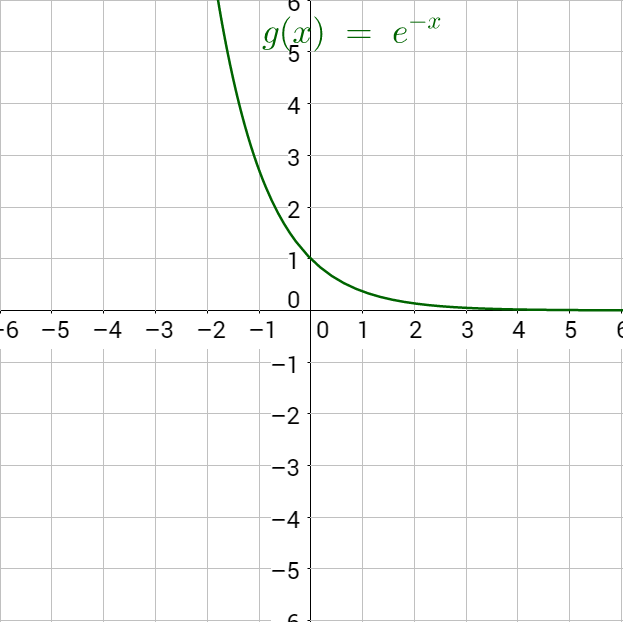
Exponential growth occurs when the value of something is repeatedly multiplied by the same number greater than 1. Exponential decay is the same idea only multiplied by a number between 0 and 1. Repeated multiplication is exponents, so the model is
y = A0ekt
where A0 is the original quantity, k is the growth constant, and t is time. Figure 2a shows exponential growth and Figure 2b shows exponential decay.
y = A0ekt
where y = current amount
A0 = initial amount
k = decay constant (if k > 0 it is growth; if k < 0 it is decay)
t = time
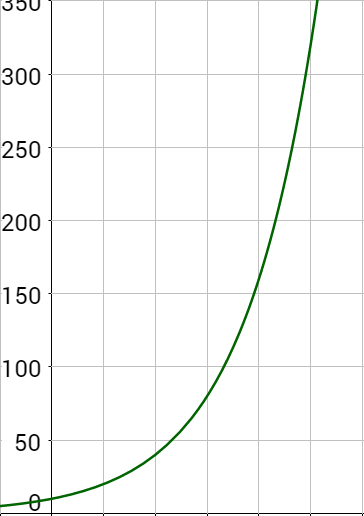
A population of bacteria doubles every hour. If the culture started with 10 bacteria, graph the population as a function of time.
Solution
This is exponential growth, so the model is
y = A0ekt
The initial population was 10, so A0 = 10. The population doubles every hour, so at t = 1, y = 20. Plug this information into the model and find k.
y = A0ekt
20 = 10ek1
2 = ek
ln 2 = ln ek
ln 2 = k
Fill in k to the model and simplify.
y = 10e(ln 2)t
y = 10(eln 2)t
y = 10 ⋅ 2t
Now graph like was done in Lesson 3-01. The asymptote is y = 0, domain is [0, ∞) because we cannot go backward in time, and the range is [10, ∞) because 10 is the initial quantity. Now make a table of values and graph.
The number of candies in a candy dish are eaten in such a way that a third of them disappear every day because no one wants to look like they are eating all the candies. If there were initially 300 candies in the dish, how many are left after a 5-day work week?
Answer
40 candies remain
Unstable atomic isotopes of an element have a nucleus that will spontaneously change to another element, called a daughter element, releasing radiation. This decay happens at a set rate, at any given moment there is a set probability that the nucleus will decay into daughter elements. For example, Carbon-14 decays into stable Nitrogen-14. The half-life, or amount of time for half of a sample to decay, of 14C is about 5700 years.
Radioactive decay using 14C is used to date samples organic material with a limit to about 50,000 years and other radioactive elements are used to date samples of rock with years ranging from about 200,000 years to hundreds of millions of years. Many Christian creationists feel the Bible indicates the Earth was created no later than 10,000 years ago, so radiometric dating poses a potential problem. The dates are typically consistent, so that deeper down rocks are generally given older dates than rocks higher up in the earth. However, radiometric dating is more complicated than using the simple exponential decay formula. For radiometric dating, there are some assumptions that are used, and adjustments are made because of these assumptions.
If the assumptions are not valid, then the calculated dates are wrong. There is some debate about the validity of each of these assumptions. See here for more information.
Radiometric and radiocarbon dating is a controversial subject. Secular scientists would like everyone to believe it is a foolproof method with no substantial problems. Carbon-14 dating does seem to work well for the historical time period where the method has been calibrated using historical artifacts. Before that is extrapolation which may or may not be accurate. Creation scientists would like to point out the shortcomings and possible issues with the methods because each person should understand both sides of the issue and encourage further open-minded research.
For the purposes of this lesson, we will use the simple exponential decay model from above.
A = A0ekt
The decay constant, k, can be found by knowing the half-life. The half-life is the amount of time for half of the sample to radioactively decay. For example, if an experiment starts with 4 mg of 14C and the half-life of 14C is 5700 years, then after 5700 years there will only be 2 mg of 14C left. This model is true for large samples, but not for individual atoms where probabilities come into play. To find the decay constant, replace A with ½A0 and solve for k.
The half-life of Carbon-14 is about 5700 years. If the sample currently has 1.5 mg of 14C, how much did it have 2,000 years ago?
Solution
First find k by plugging in A = 1.5, A = ½A0 = 1.5 so A0 = 3, and t = 5700.
A = A0ekt
1.5 = 3ek5700
0.5 = e5700k
ln 0.5 = ln e5700k
ln 0.5 = 5700k
Now plug in k ≈ −0.0001216, A = 1.5, and t = 2,000 and solve for A0.
A = A0ekt
1.5 = A0e(−0.0001216 ⋅ 2,000)
1.5 = A0(0.7841)
1.913 = A0
So, 2,000 years ago, there would have been 1.913 mg of 14C.
Potassium-40 has a half-life of 1.251×10⁹ years. If there is initially 5 g of 40K, how much will there be after 5,000 years?
Answer
4.99999 g
Exponential growth cannot continue forever. Consider the rabbits from the beginning of the lesson. Each pair of rabbits produces an average litter of 6 babies every 1 to 2 months. Eventually there will be so many rabbits that there will not be enough food for them to all live, so fewer rabbits will be born. Eventually the number of rabbits will plateau at the carrying capacity. With constants a, b, and c, the model is
where = initial value,
c = carrying capacity,
b = constant determined by the rate of growth
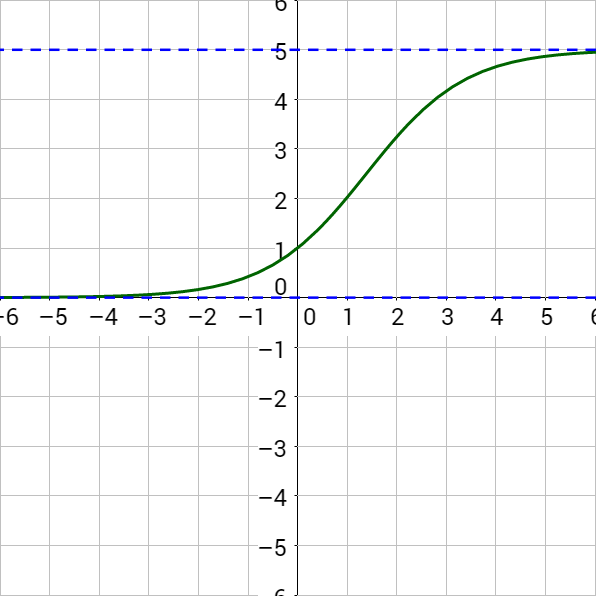
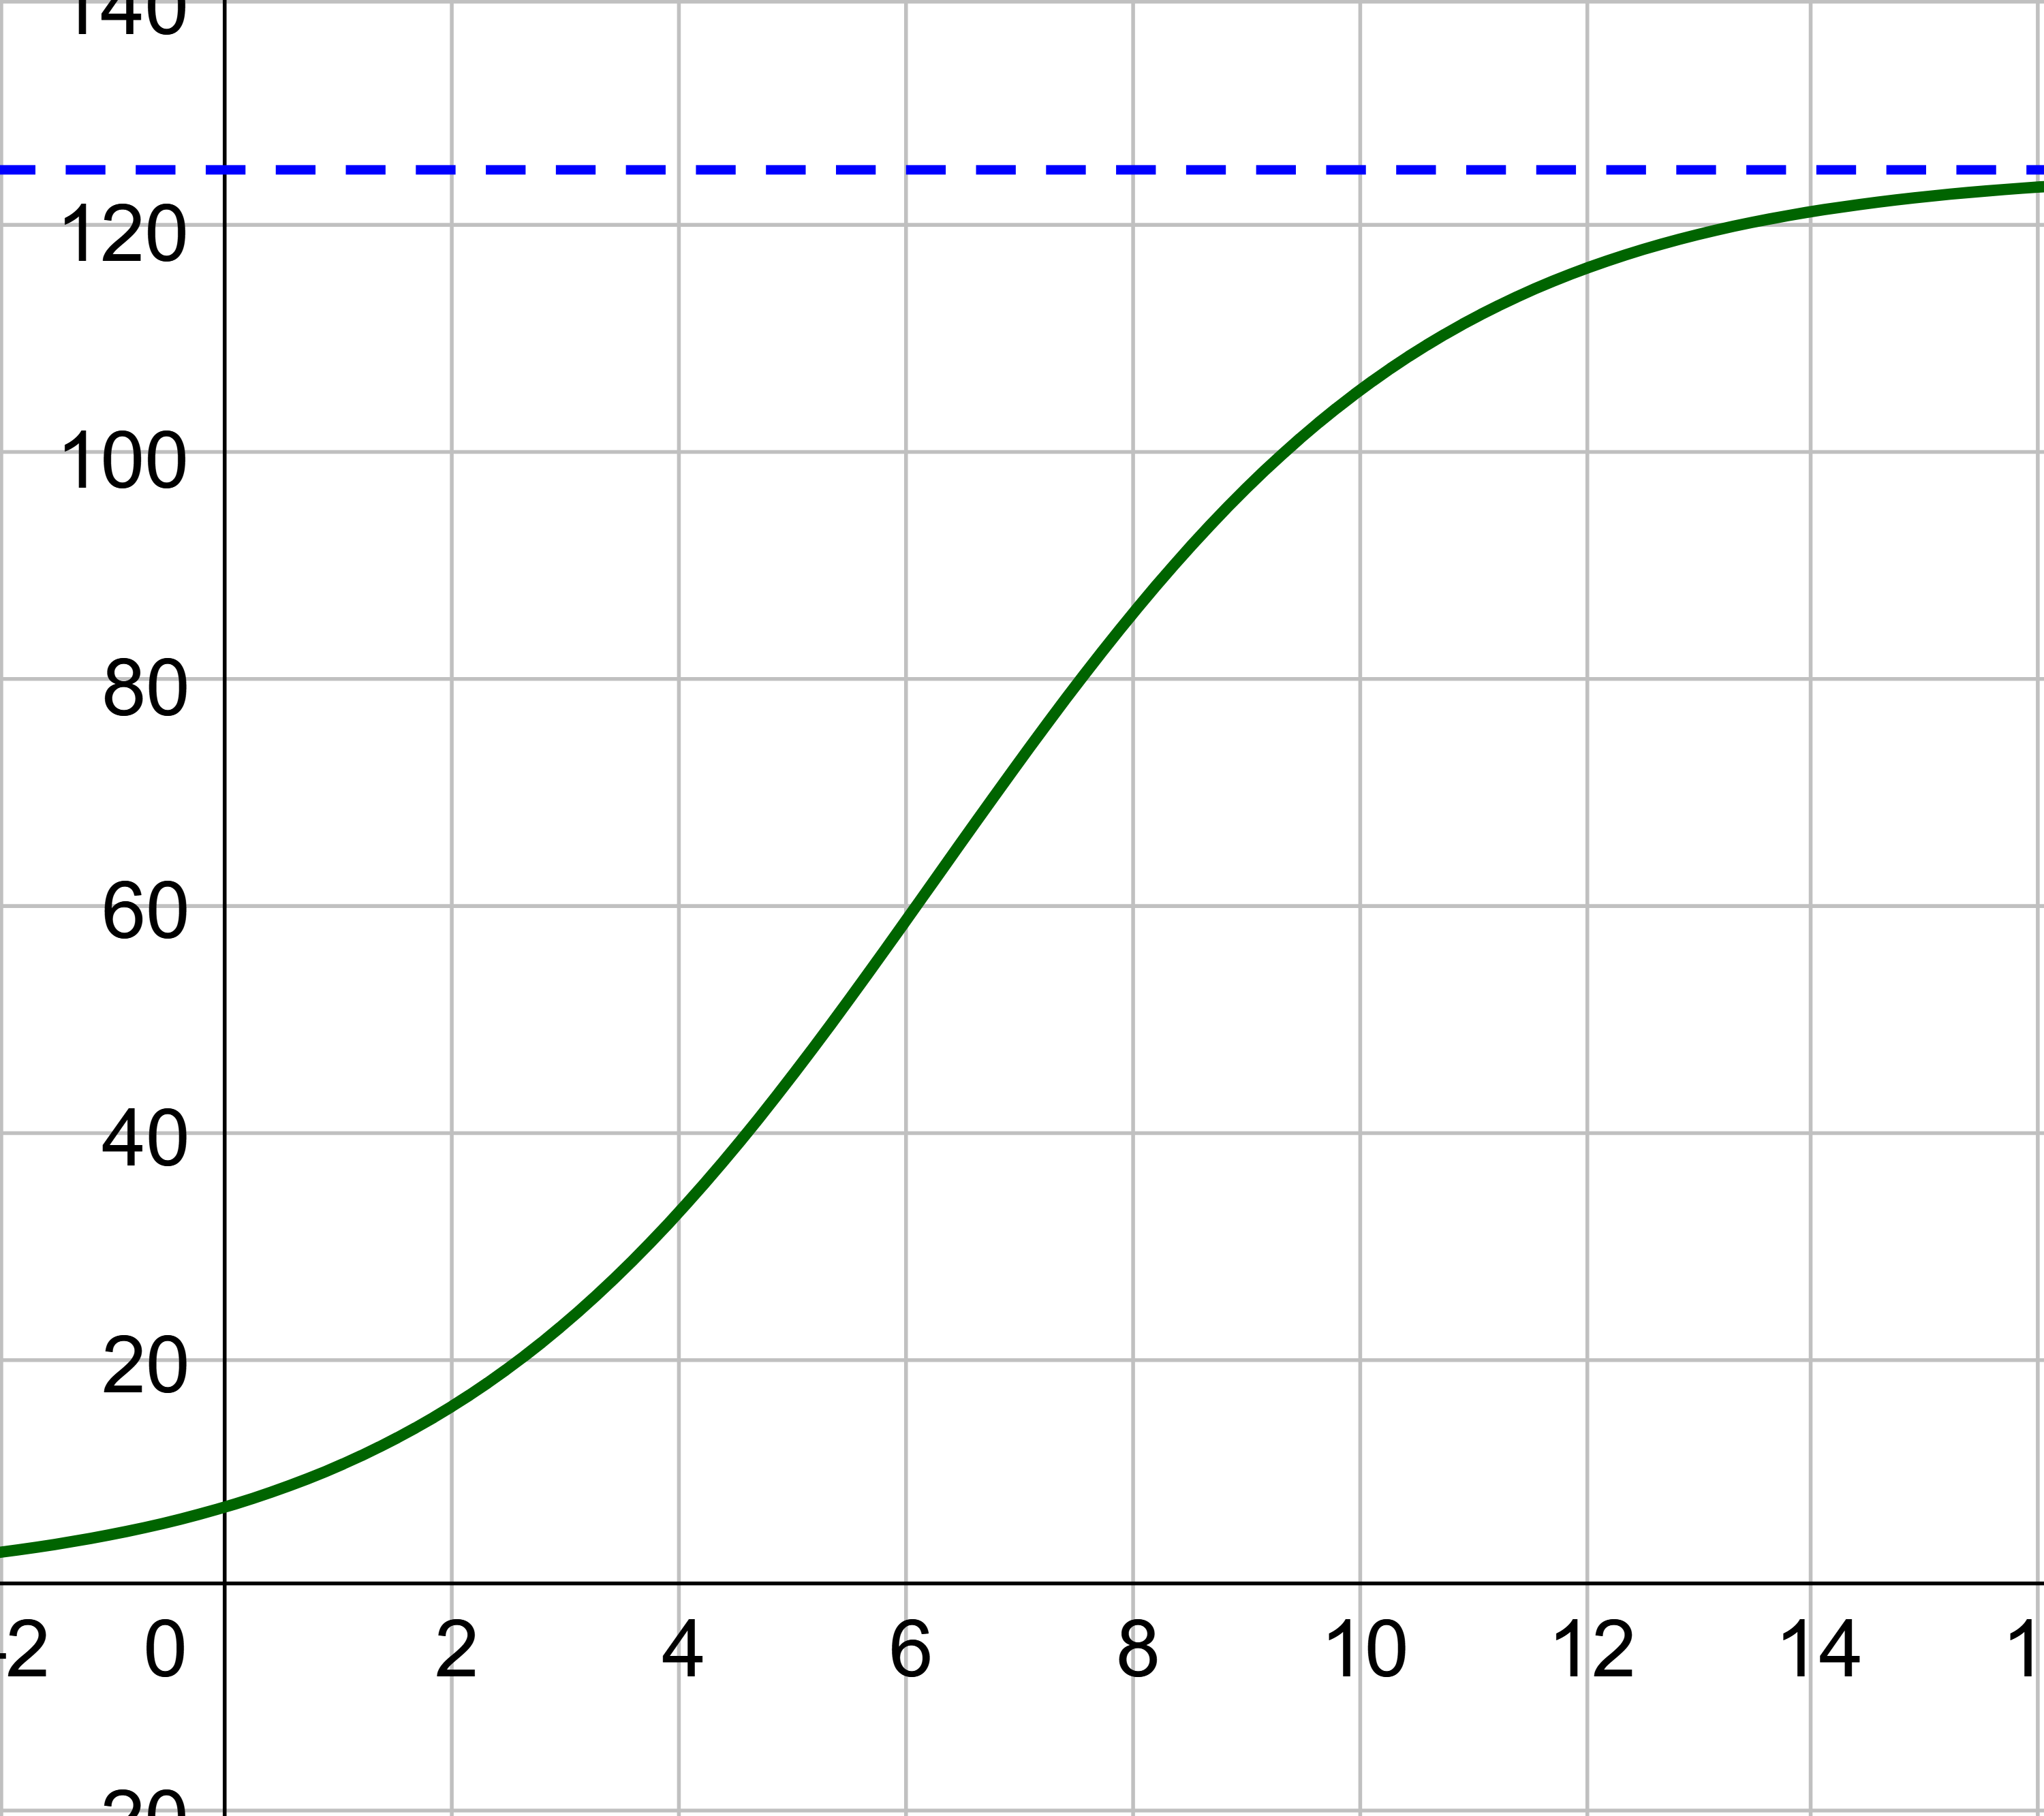
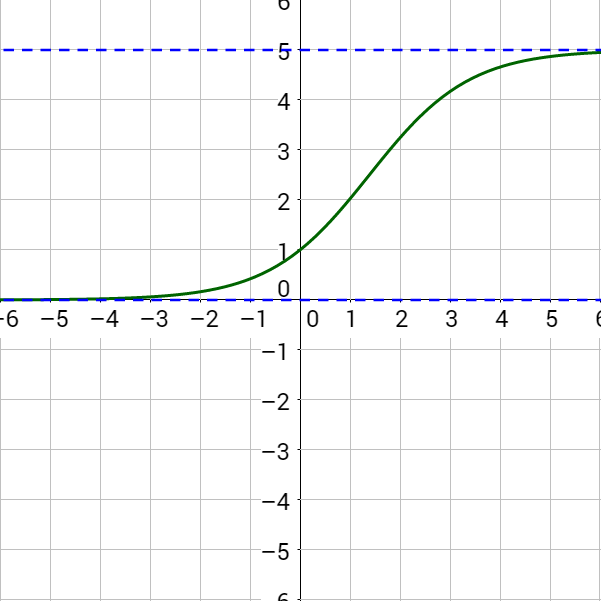
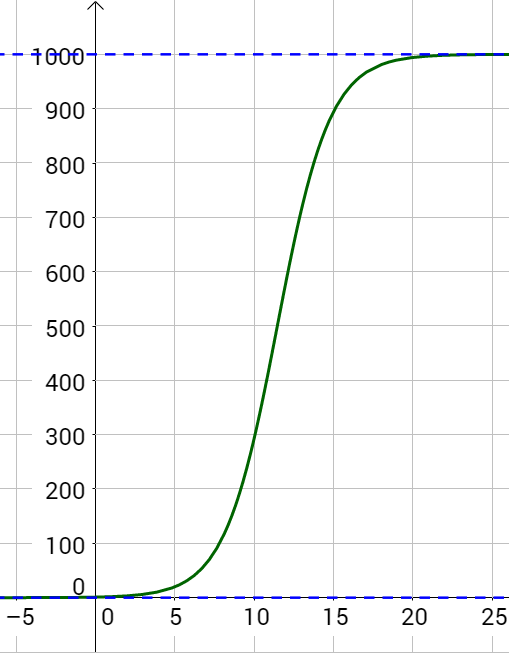
An influenza epidemic spreads through a population rapidly, at a rate that depends on two factors: The more people who have the flu, the more rapidly it spreads, and the more uninfected people there are, the more rapidly it spreads. These two factors make the logistic model a good one to study the spread of communicable diseases. And, clearly, there is a maximum value for the number of people infected: the entire population.
For example, at time t = 0 there is one person in a community of 1,000 people who has the flu. So, in that community, at most 1,000 people can have the flu. Researchers find that for this particular strain of the flu, the logistic growth constant is b = 0.6030. (a) Estimate the number of people in this community who will have had this flu after ten days. (b) Predict how many people in this community will have had this flu after a long period of time has passed.
Solution
Substitute the given data into the logistic growth model.
Because at most 1,000 people, the entire population of the community, can get the flu, we know the limiting value is c = 1000. To find a, we use the formula that the number of cases at time t = 0 is \(1 = \frac{1000}{1 + ae^{-b\left(0\right)}}\) so, , from which it follows that a = 999.
Analysis
Remember that, because we are dealing with a virus, we cannot predict with certainty the number of people infected. The model only approximates the number of people infected and will not give us exact or actual values. The graph in figure 5 gives a good picture of how this model fits the data.
Using the model in Example 3, estimate the number of cases of flu on day 15.
Answer
895
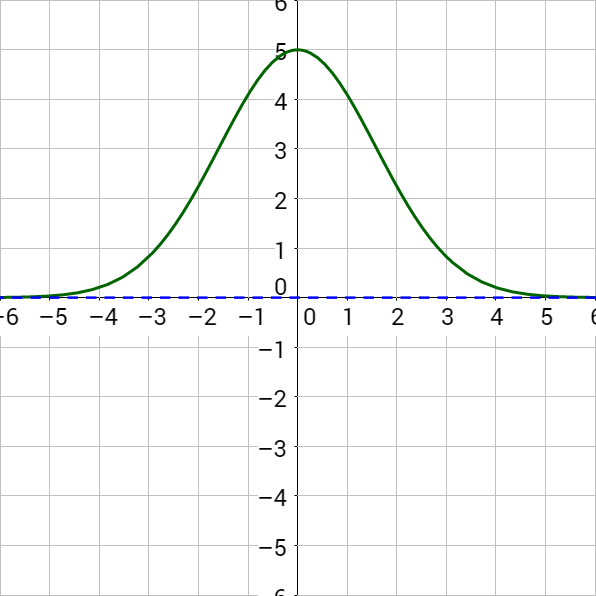
Data sets such as SAT scores and heights of women in America fit the Gaussian Model which is often used in statistics to model the normal distribution. The Gaussian Model is called the normal distribution because the distribution of many large data sets align with it. The mean value is in the center with less common values on each side. The shape to the Gaussian Model's graph is often called a bell curve.
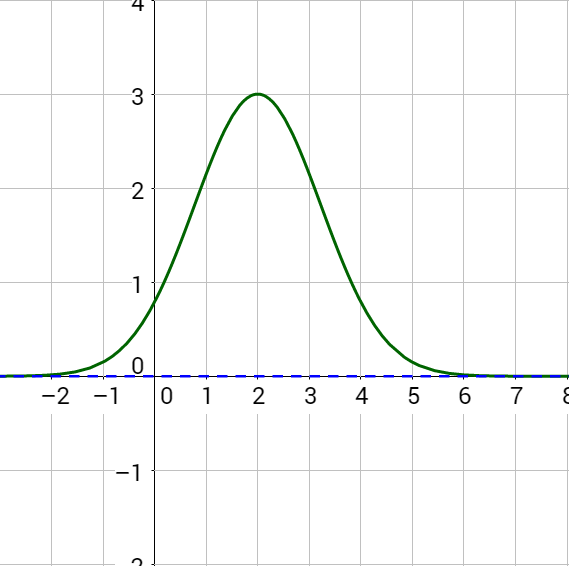
The Gaussian Model function is
f(x) = ae−(x − b)2/c
The average value of the data is the x-value corresponding to the central highest y-value.
f(x) = ae−(x − b)2/c
where a = maximum value
b = mean (average value)
c = determines the steepness of the sides
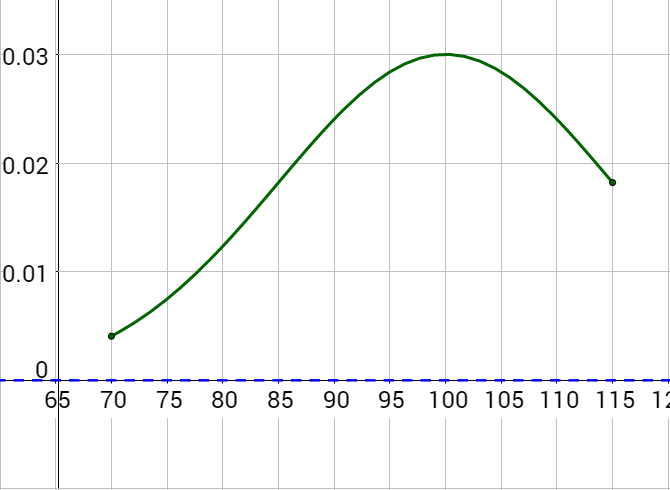
According to the National Center for Education Statistics, the national results of the 2009 ACT test roughly fits the normal distribution model
y = 0.25e−(x − 21.1)2/52.02; 1 ≤ x ≤ 36
Graph this function. Then determine the average ACT score in 2009.
Solution
Make a table of values to graph the function. Notice that a = 0.25, so that is the maximum y-value. The domain is given in the problem so only use x-values between 1 and 36.
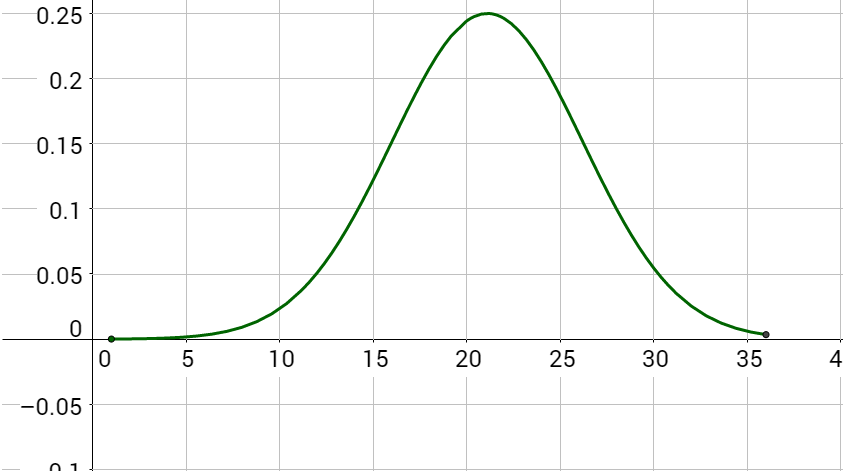
Notice the highest point of the graph has an x-value just a little more than 20. By comparing the function with the Gaussian model, b = 21.1 which is the average.
In physics, how humans perceive intensity of events such as sound or earthquakes is made into a logarithmic scale. For example, the Richter scale for earthquakes is
where R is the magnitude of the earthquake, I is the intensity of the earthquake, and I0 is 1 which is the minimum possible intensity used for comparison.
Find the intensity of each earthquake.
Solution
Use the Richter model above with R = 4.2 and I0 = 1. Then solve for I.
4.2 = log I
104.2 = 10log I
15,849 ≈ I
Use the Richter model above with R = 9.5 and I0 = 1. Then solve for I.
9.5 = log I
109.5 = 10log I
3,162,277,660 ≈ I
Find the intensity of a magnitude 5 earthquake.
Answer
100,000
y = A0ekt
where y = current amount
A0 = initial amount
k = decay constant (if k > 0 it is growth; if k < 0 it is decay)
t = time
where = initial value,
c = carrying capacity,
b = constant determined by the rate of growth
f(x) = ae−(x − b)2/c
where a = maximum value
b = mean (average value)
c = determines the steepness of the sides
Helpful videos about this lesson.
| x | 1 | 2 | 3 | 4 | 5 | 6 | 7 | 8 | 9 | 10 |
|---|---|---|---|---|---|---|---|---|---|---|
| f(x) | -0.631 | 0 | 0.369 | 0.631 | 0.834 | 1 | 1.140 | 1.262 | 1.369 | 1.465 |
| x | 1 | 2 | 3 | 4 | 5 | 6 | 7 | 8 | 9 | 10 |
|---|---|---|---|---|---|---|---|---|---|---|
| f(x) | 1.2 | 1.44 | 1.728 | 2.074 | 2.488 | 2.986 | 3.583 | 4.300 | 5.160 | 6.192 |