Precalculus by Richard Wright
Has this helped you?
This book is available
in print and ebook.

Precalculus by Richard Wright
Has this helped you?
This book is available
in print and ebook.
When the centurion and those with him who were guarding Jesus saw the earthquake and all that had happened, they were terrified, and exclaimed, “Surely he was the Son of God!” Matthew 27:54 NIV
Summary: In this section, you will:
SDA NAD Content Standards (2018): PC.4.1, PC.5.3

The mass on the end of a Foucault pendulum moves as the earth moves. A graph of the displacement of the pendulum over time is in the shape of a wave and can be modeled with a sine or cosine function. This lesson is about graphing sine and cosine functions.
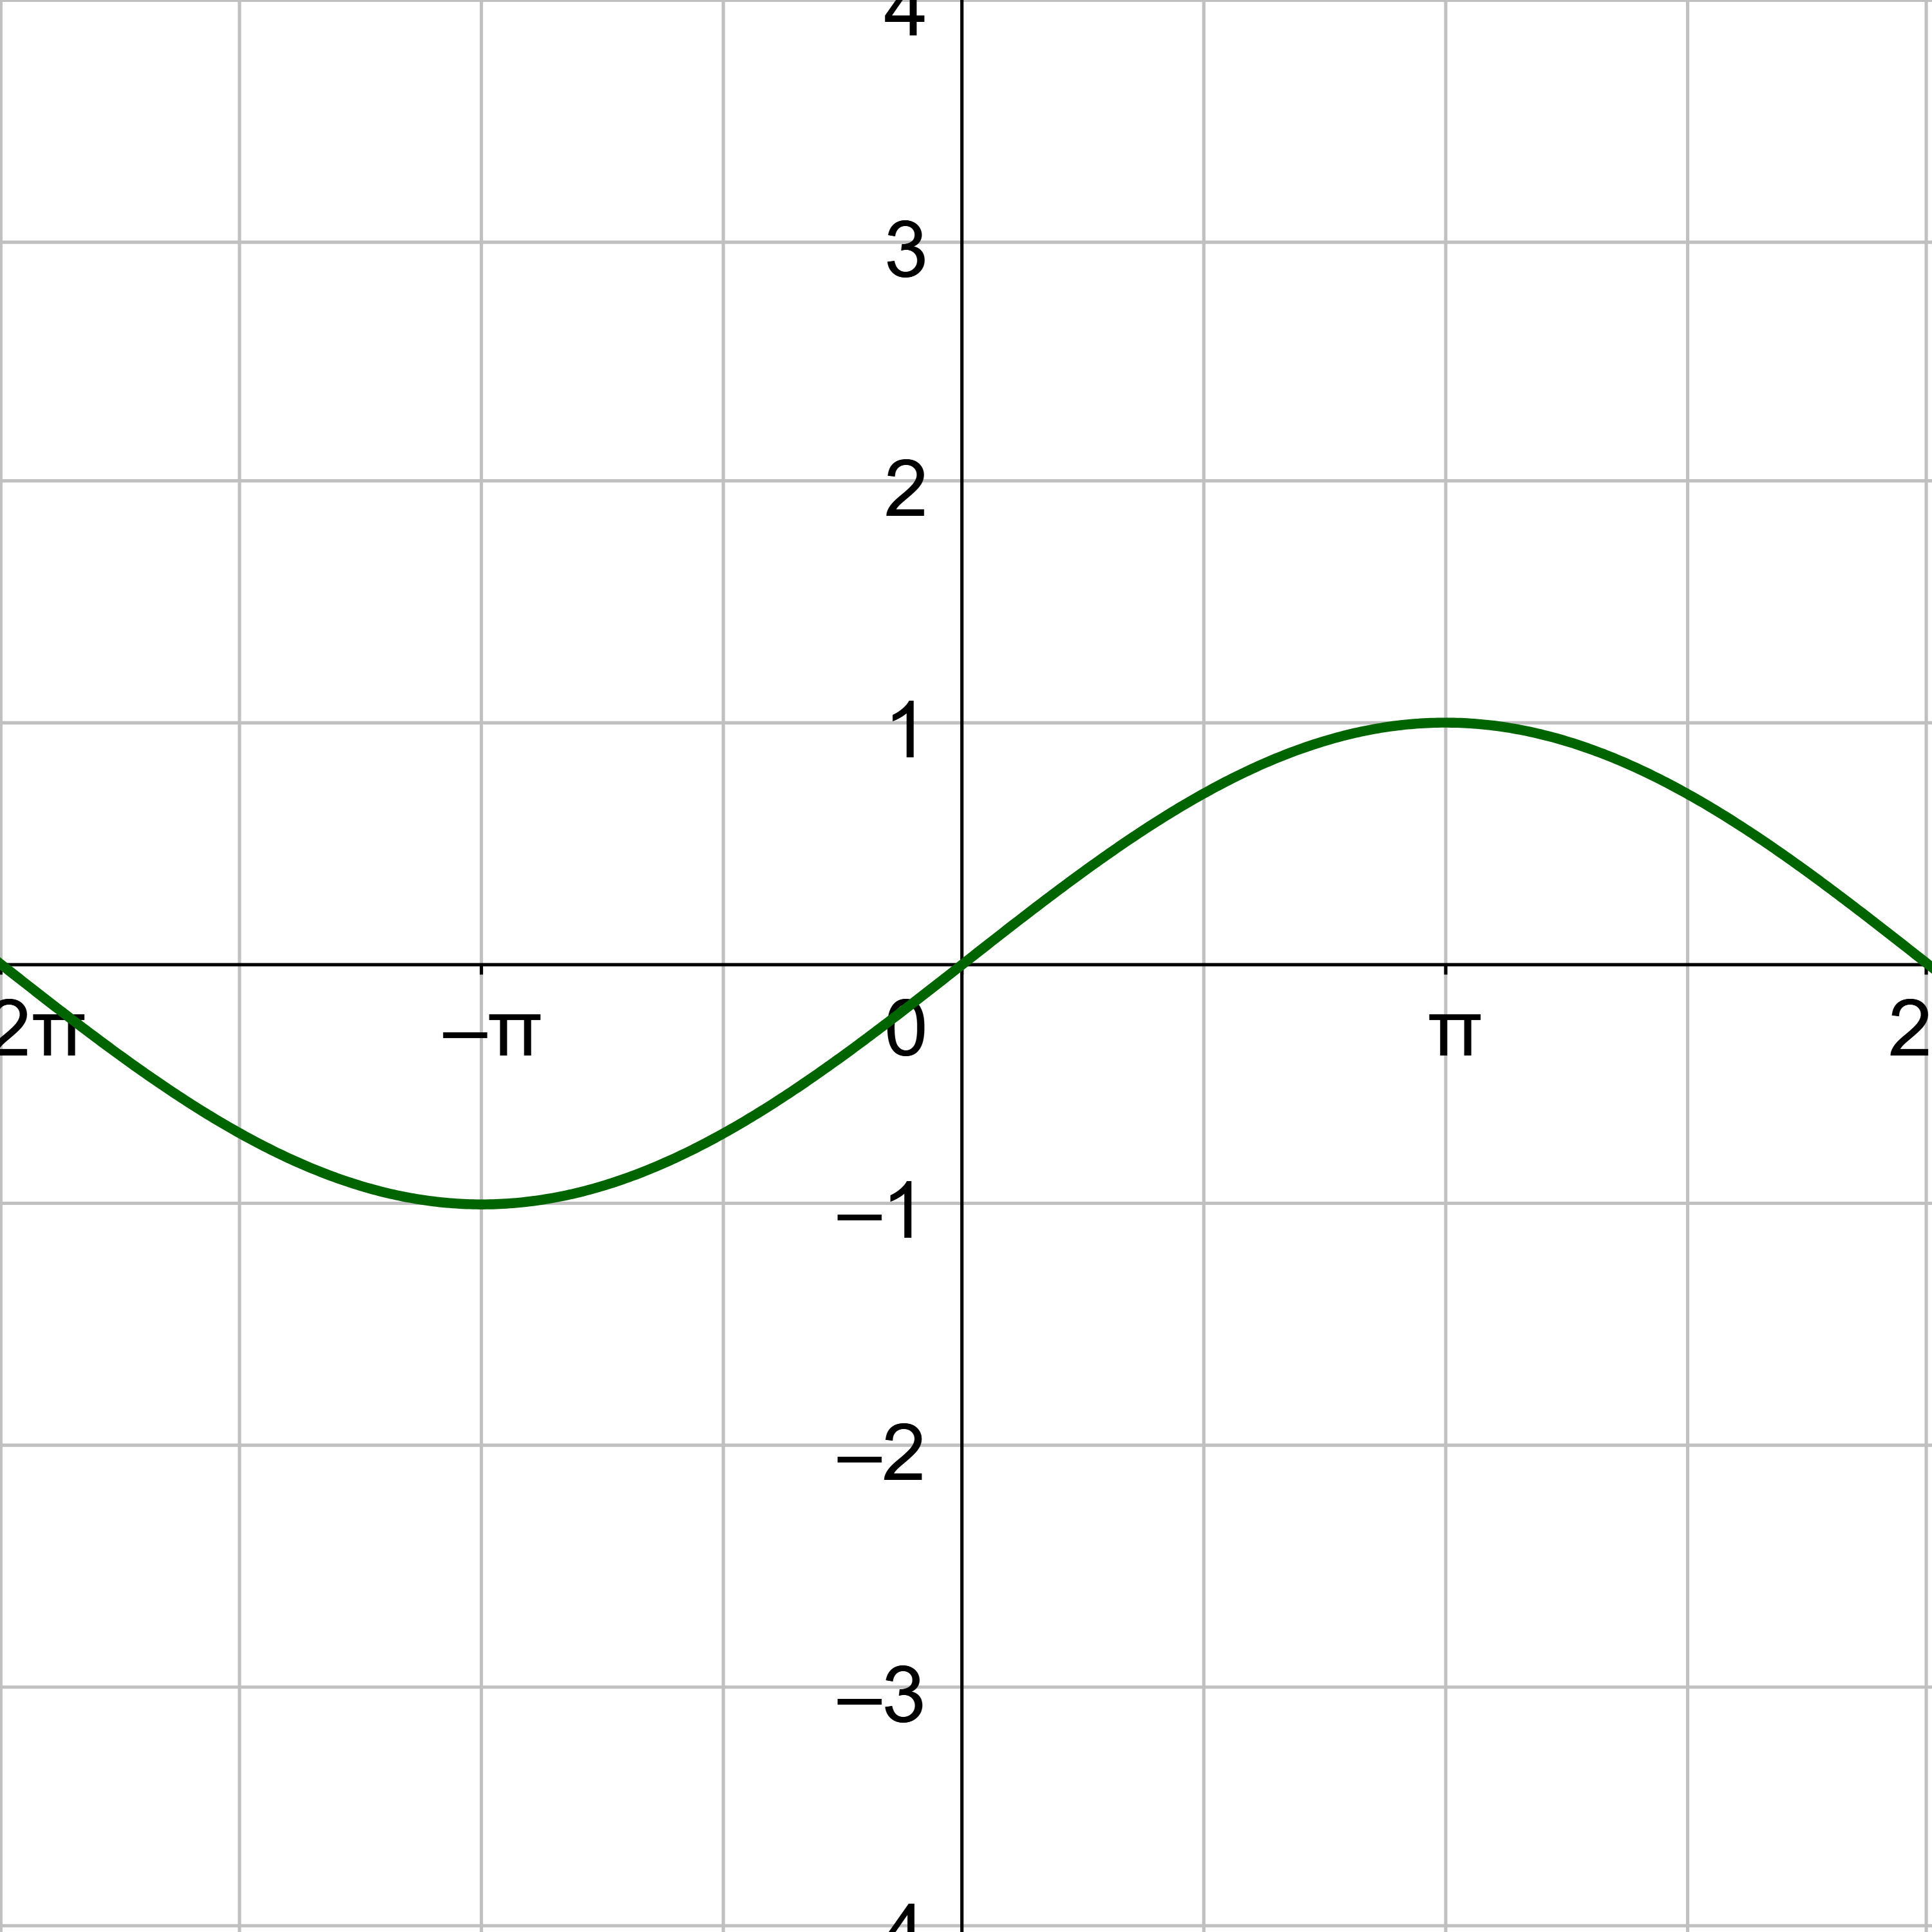
Consider the unit circle. Let x be the angle and y be the height above the x-axis on the unit circle. When y = sin x or y = cos x is graphed on the coordinate plane, this will produce a graph that looks like a wave as in figure 1. Notice the pattern repeats because the angle can move around the unit circle multiple times.
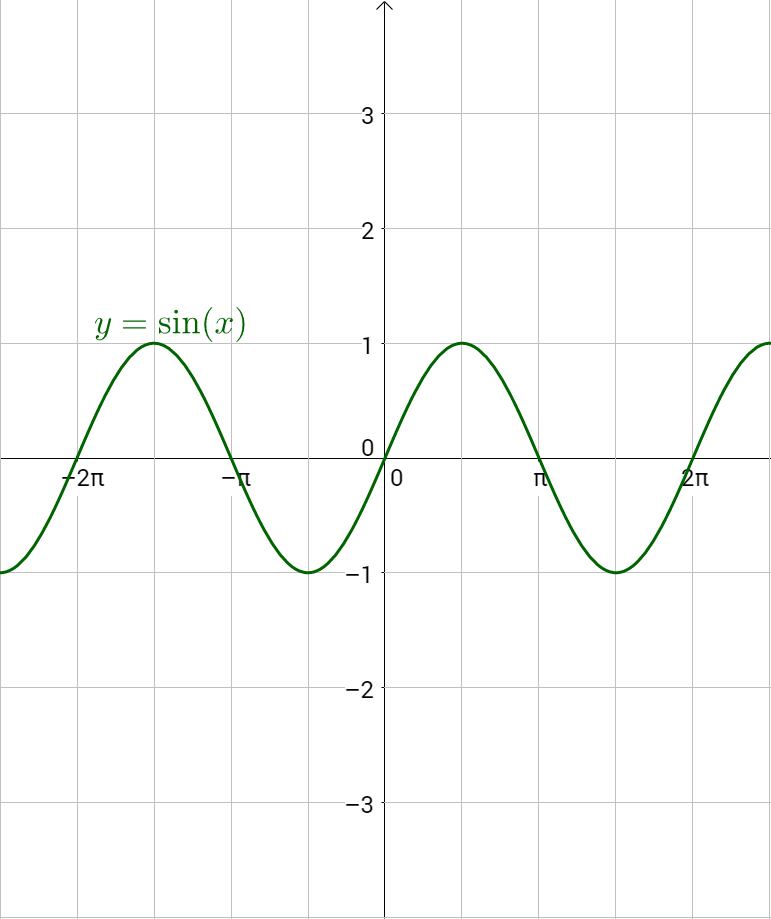
To graph a sine graph by hand, plot key points. The y-value of sine is zero at the angles of 0, π, and 2π. Sine equals 1 at π/2 and −1 at 3π/2. Plot those points on a coordinate plane and draw the wave. Repeat the wave pattern to complete the graph. Notice the maximum and minimum are halfway between zeros.
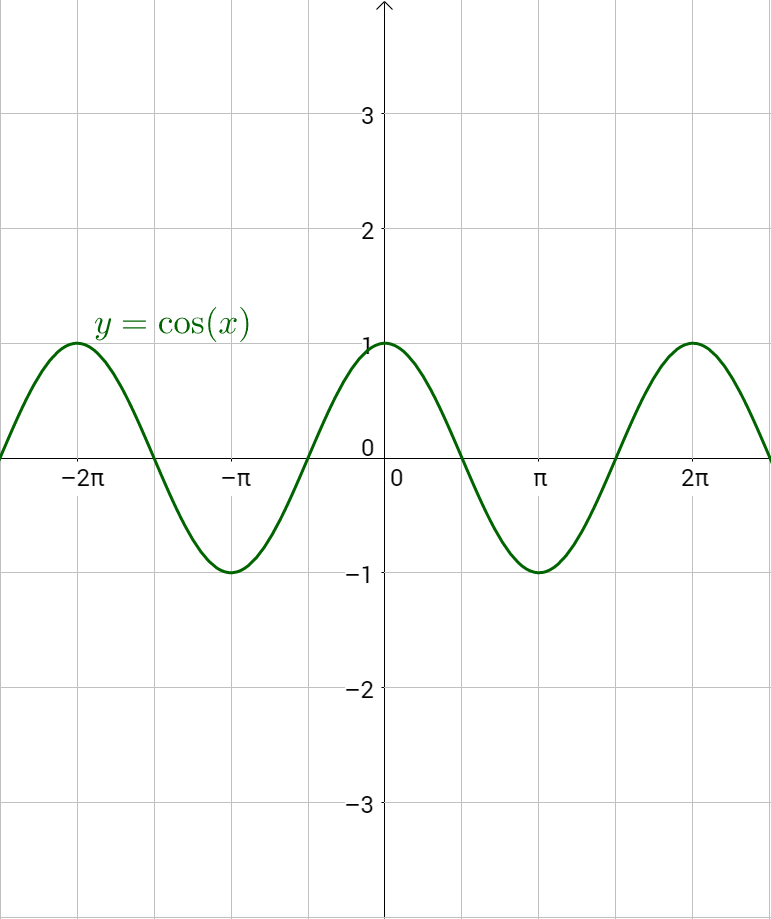
Cosine is the same shape as sine, only it starts at 1 instead of 0.
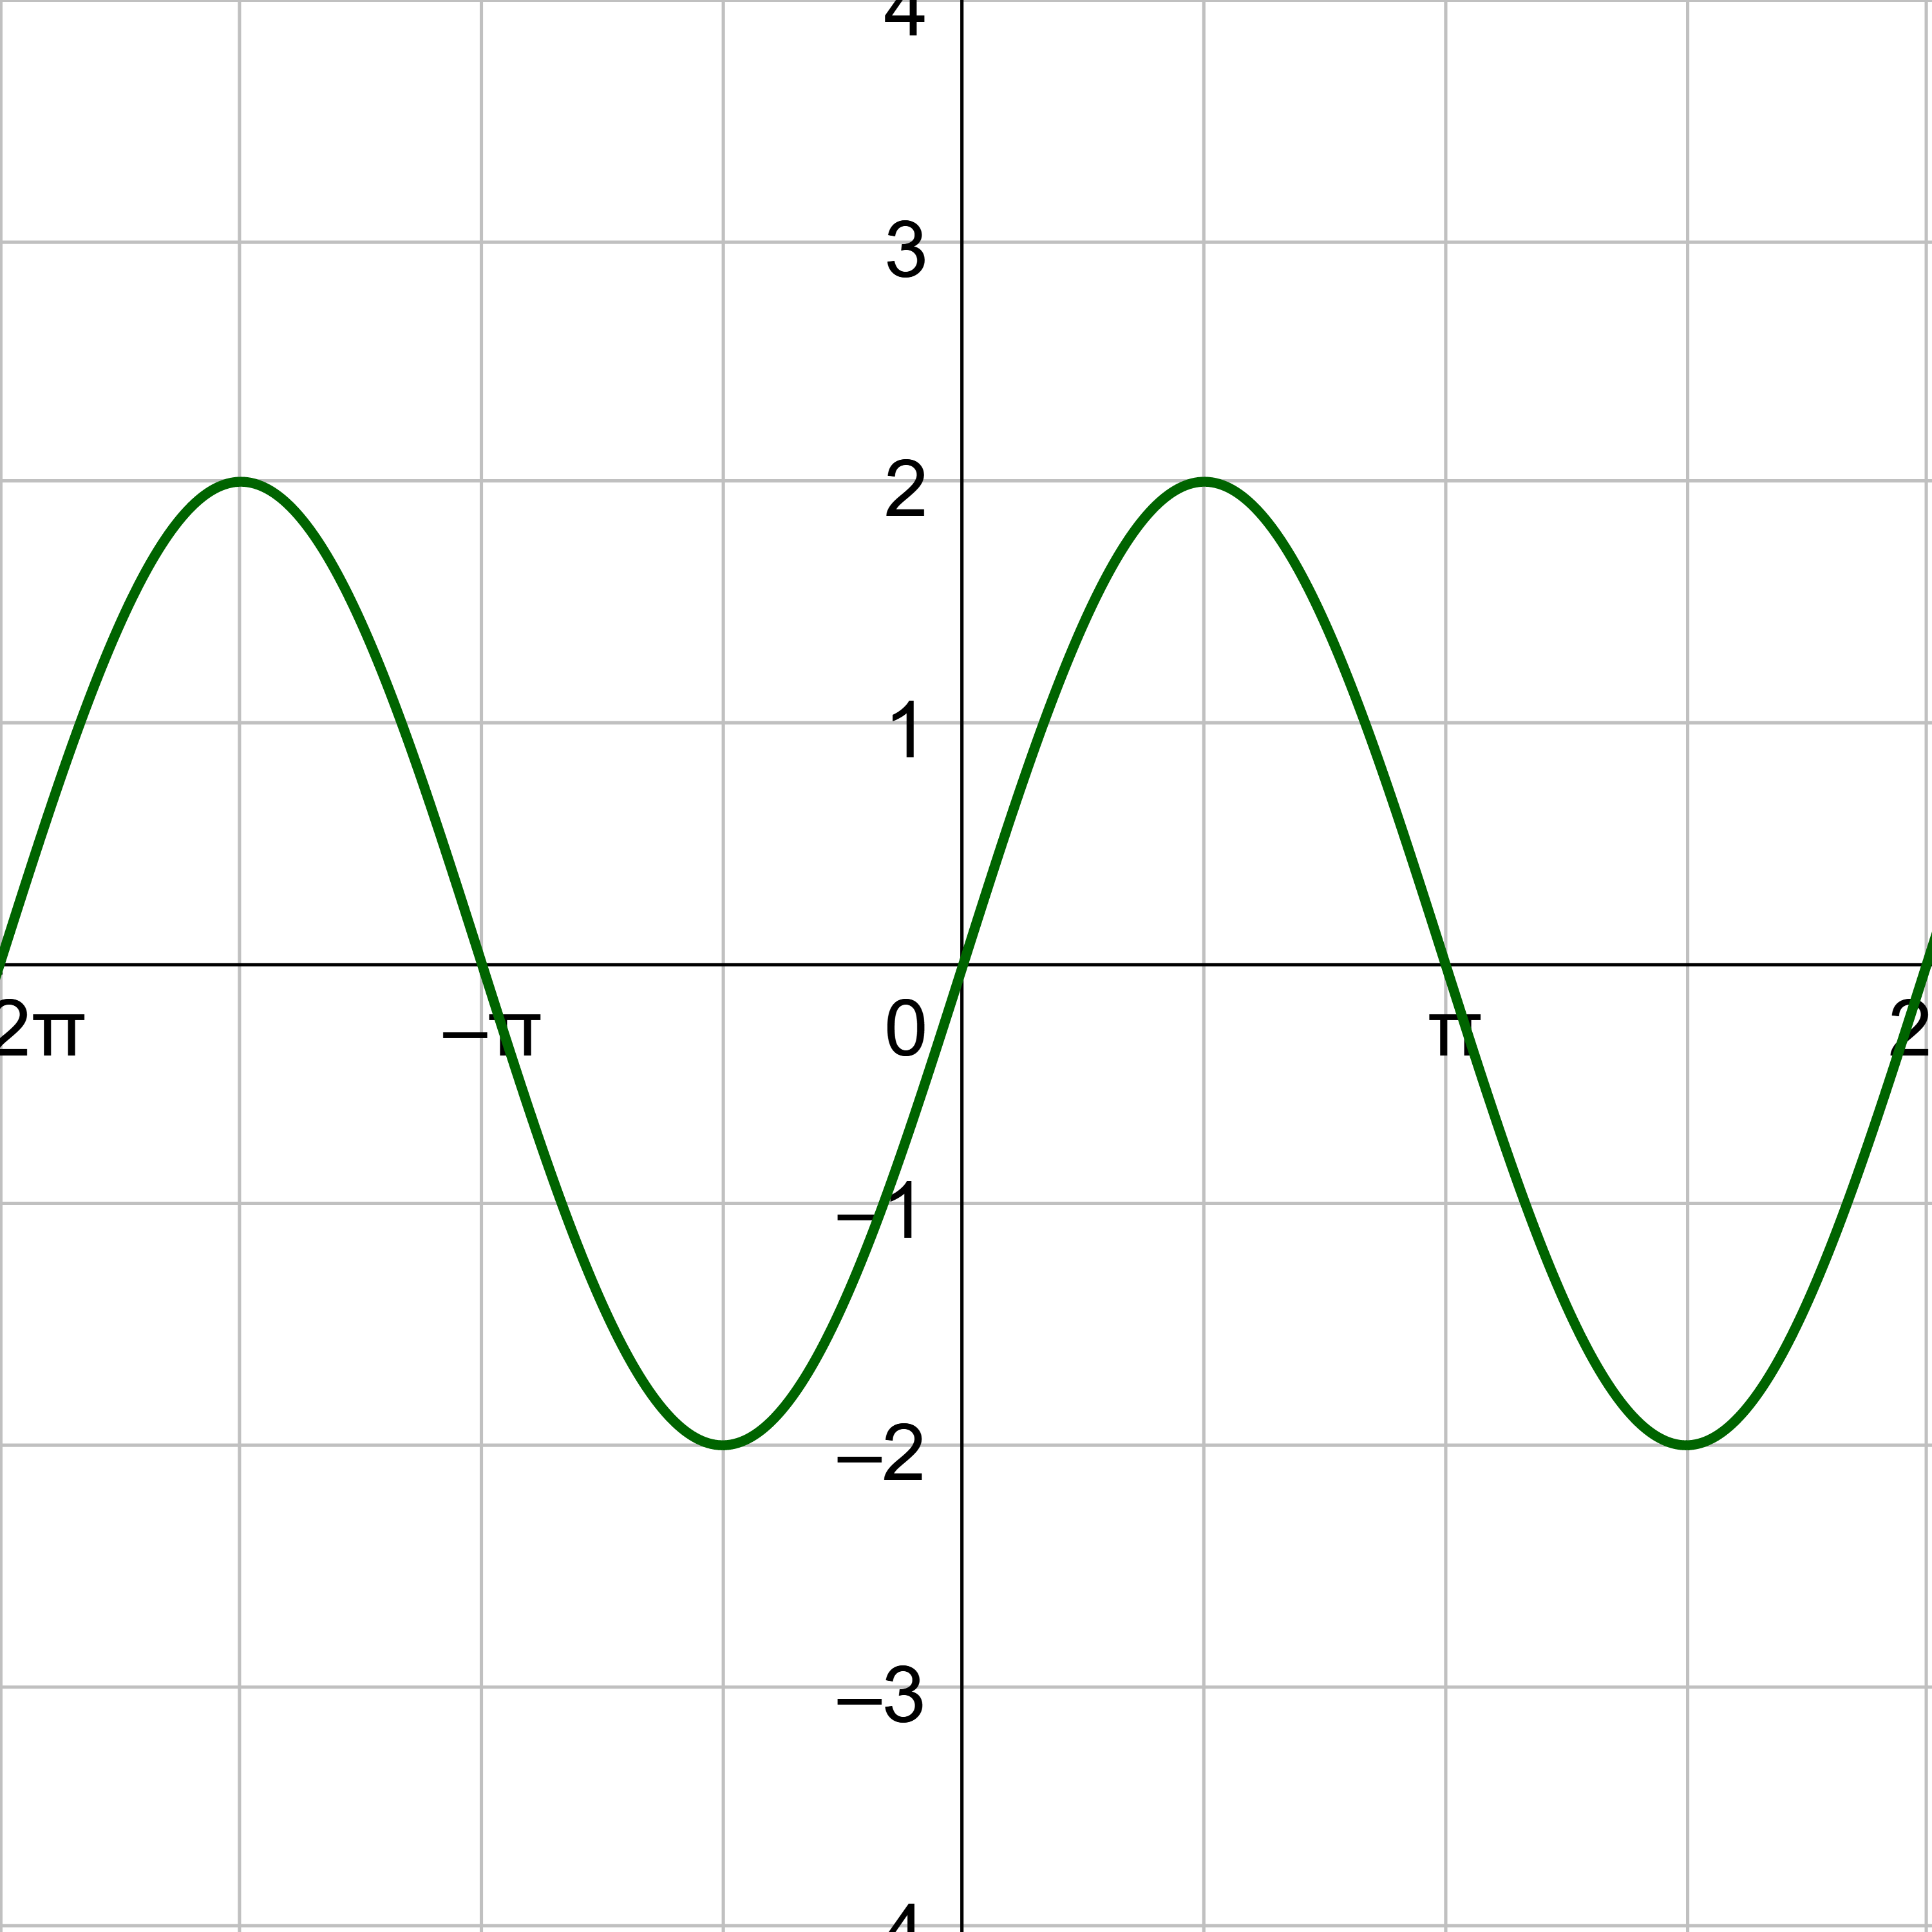
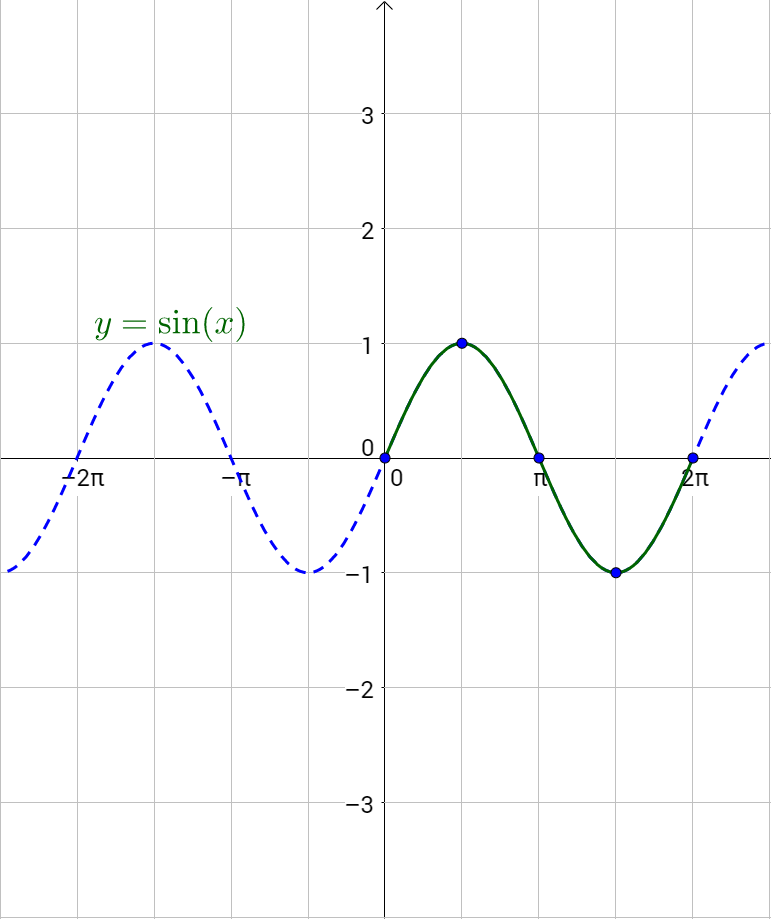
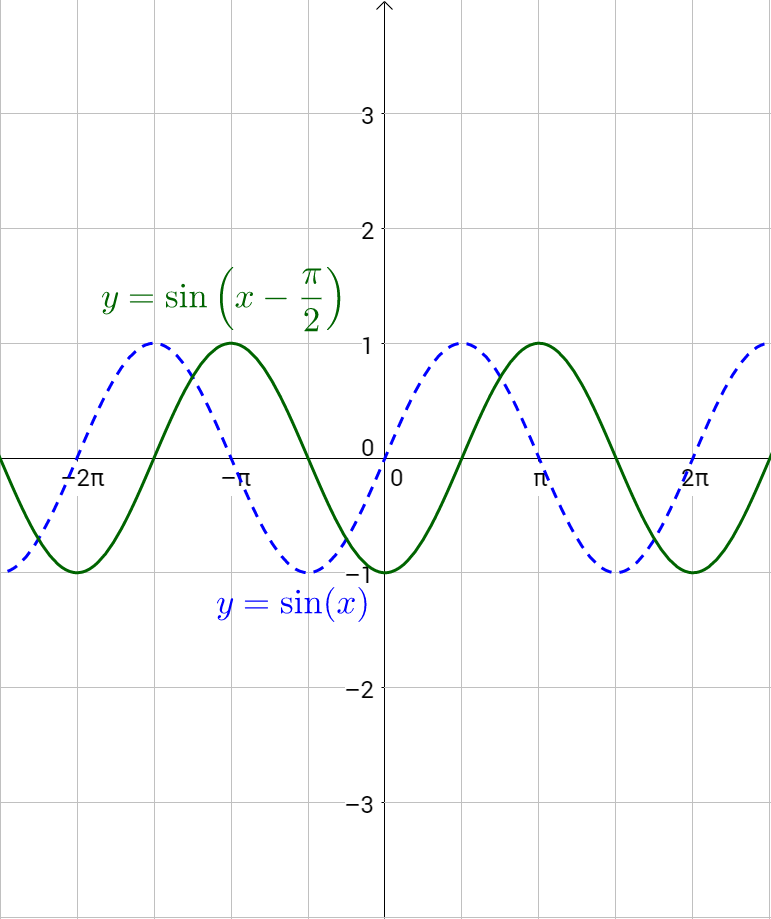
Graph y = sin x and y = cos x
Solution
The key points for sine are (0, 0), \(\left(\frac{π}{2}, 1\right)\), (π, 0), \(\left(\frac{3π}{2}, -1\right)\), and (2π, 0). Graph the key points and sketch the sine curve through the points. Then continue the pattern both positive and negative.
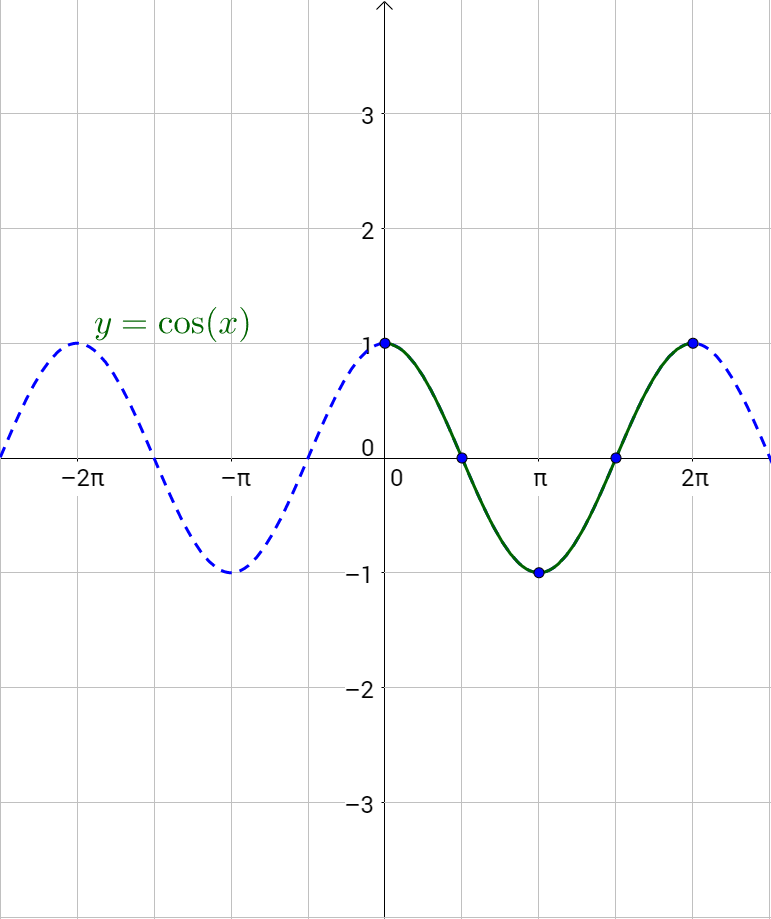
The key points for cosine are (0, 1), \(\left(\frac{π}{2}, 0\right)\), (π, −1), \(\left(\frac{3π}{2}, 0\right)\), and (2π, 1). Graph the key points and sketch the curve through the points. Then continue the pattern both positive and negative.
By multiplying a graph by a value, a, the graph is stretched vertically by a. This is because the function equals y, so if we multiply the function by a, then we multiply y by a. The original height of the sine or cosine graph is 1, the transformed height is a. This height is called the amplitude.
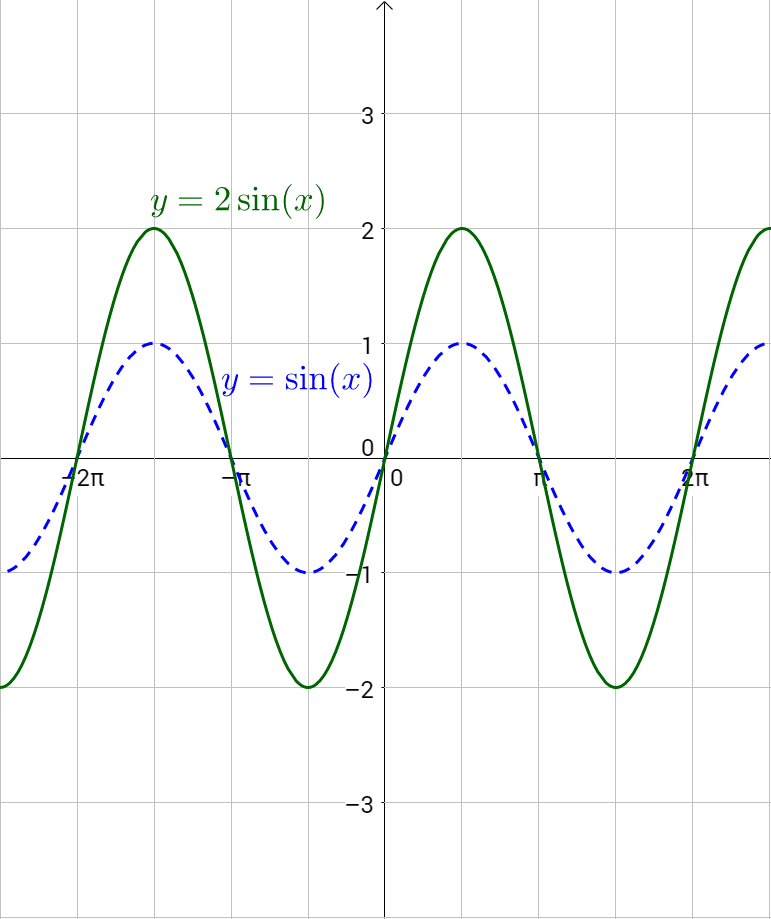
The amplitude, or height, of the sine or cosine graph is a.
Amplitude = | a |
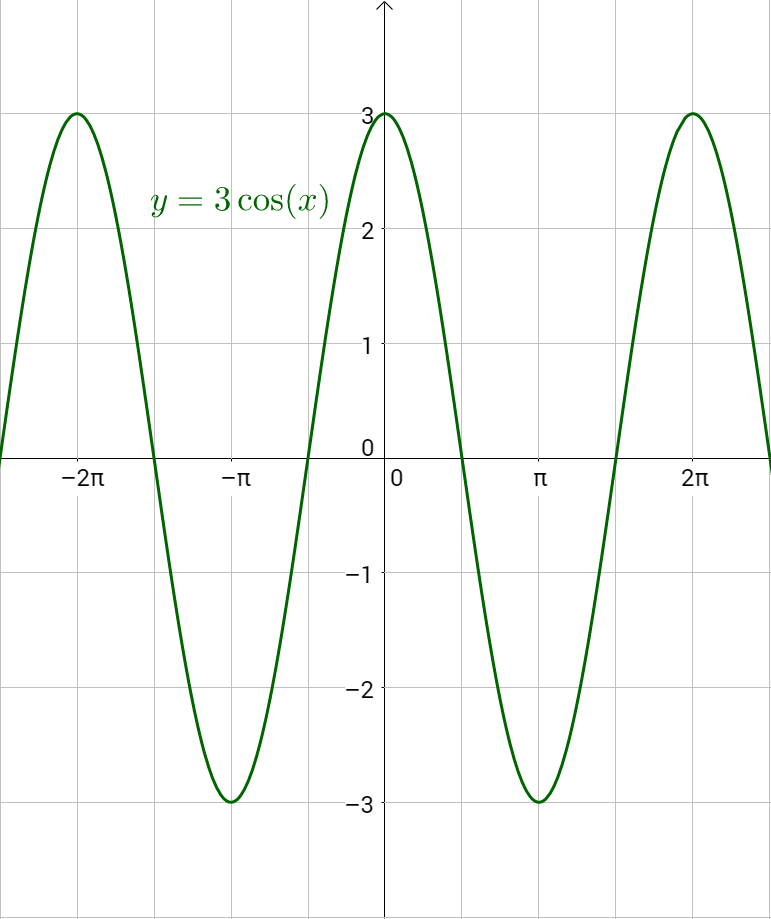
Find the amplitude of y = 3 cos x.
Solution
Compare y = 3 cos x to y = a cos x. Notice that the a = 3, the amplitude is 3.
Find the amplitude of y = 5 sin x.
Answer
5
The distance on the x-axis of one full cycle of the graph is period. The period of the basic sine or cosine graph is 2π, but if the x is multiplied by a number, b, the graph is horizontally shrunk by the factor, b.
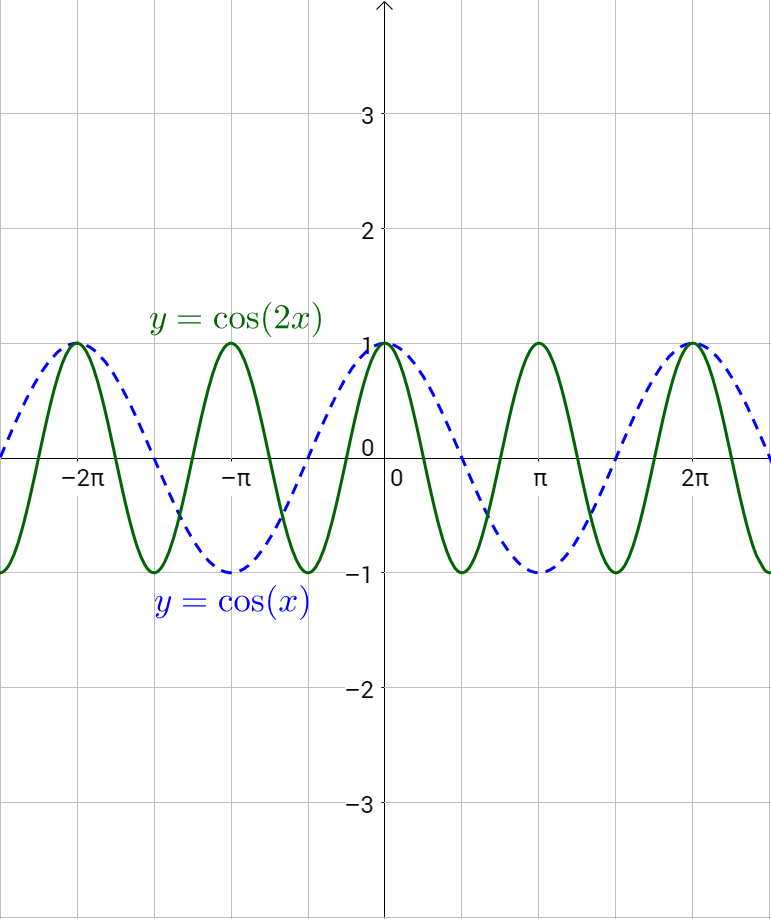
The period, or distance of one cycle, of the sine or cosine graph is \(\frac{2π}{b}\).
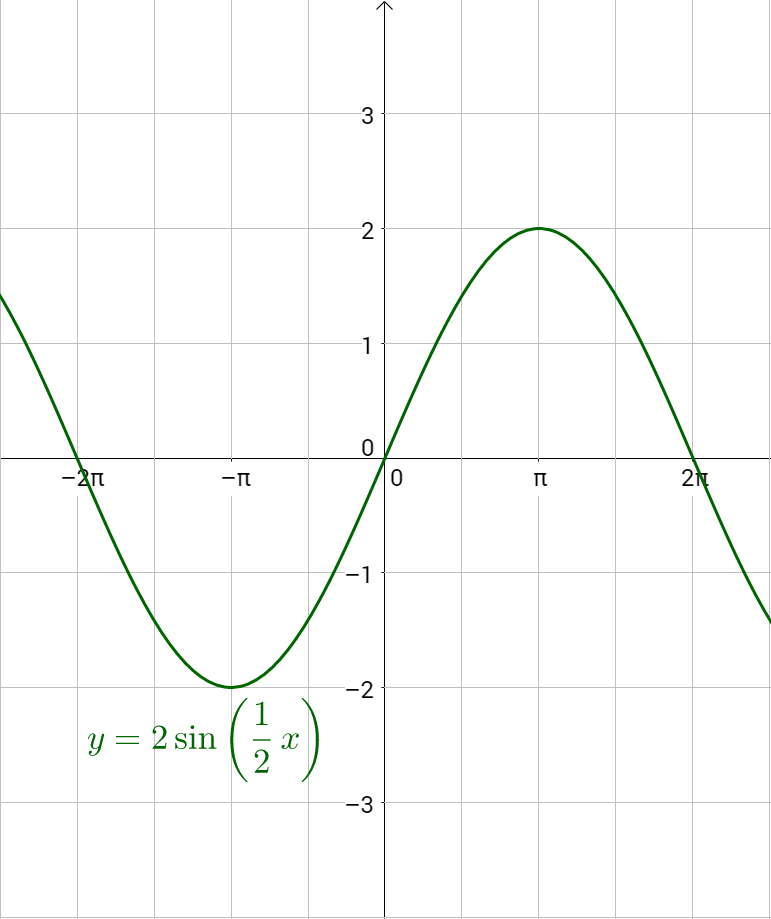
Find the period of \(y = 2 \sin{\frac{1}{2}x}\).
Solution
By comparing \(y = 2 \sin{\frac{1}{2}x}\) to y = sin bx, b = \(\frac{1}{2}\). Calculate the period.
Find the period of y = cos 4x.
Answer
\(\frac{π}{2}\)
Graphs can be shifted horizontally. Since the horizontal is the x direction, to shift, or translate, the graph, add or subtract values to the x. This translation is called phase shift.
The phase shift, or horizontal translation, is c/b. If c is positive, the translation is to the right.
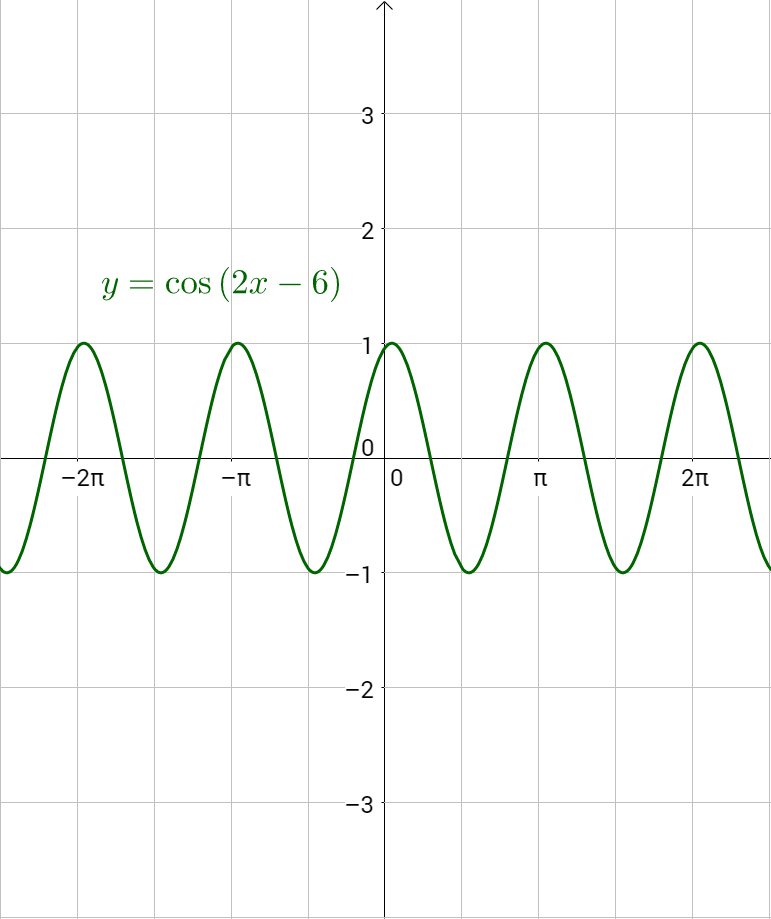
Find the phase shift of y = cos(2x + 6).
Solution
Compare y = cos(2x + 6) with y = cos(bx – c) to see b = 2 and c = −6. Calculate the phase shift.
Because the c is negative, the phase shift is 3 units to the left.
Find the phase shift of \(y = \frac{1}{2} \sin{\left(4x - π\right)}\).
Answer
\(\frac{π}{4}\) to the right
To shift a graph vertically, add a number to the entire function. Since the function equals y, adding a number to the function, adds the number to y. The middle of sine and cosine is usually at y = 0. Thus, the vertical translation is called the midline.
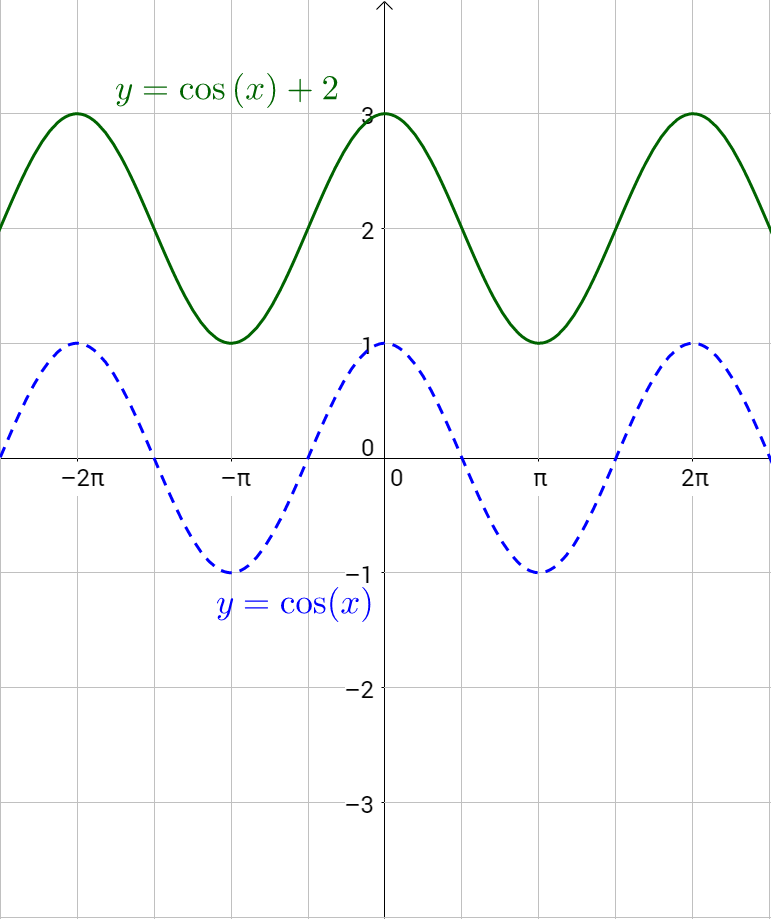
The midline of a graph is y = d.
Midline y = d
Put it all together.
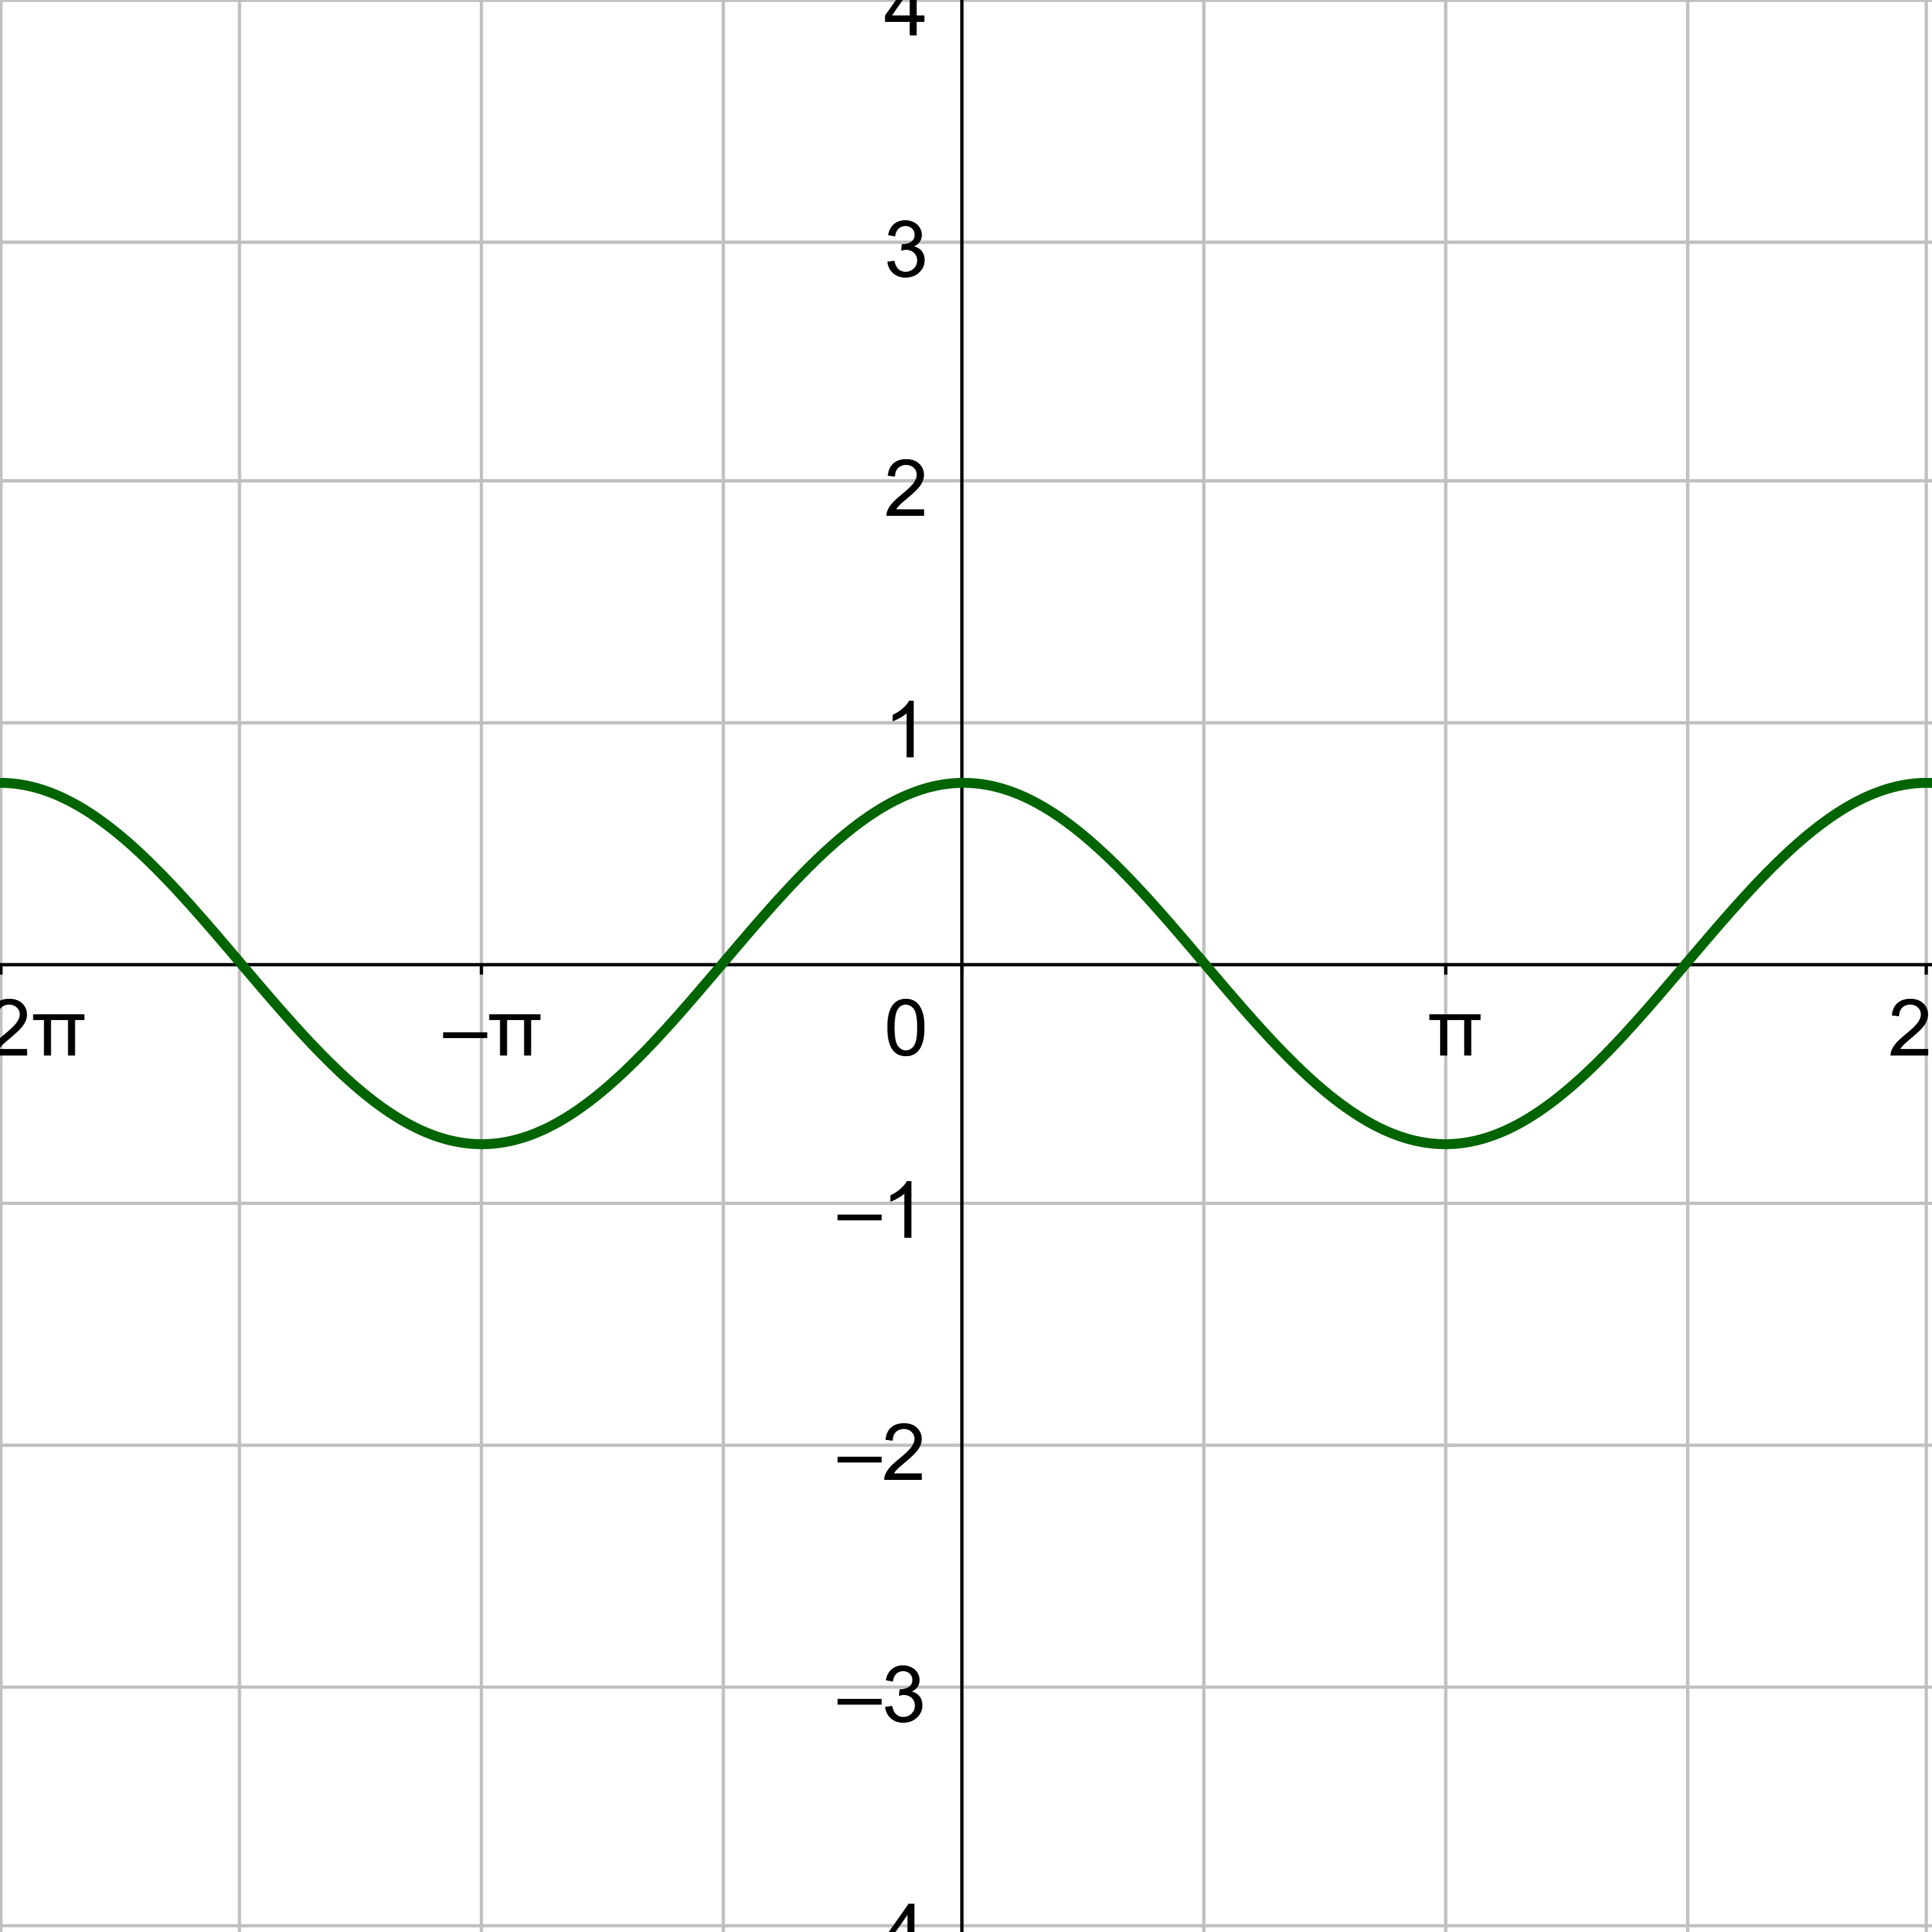
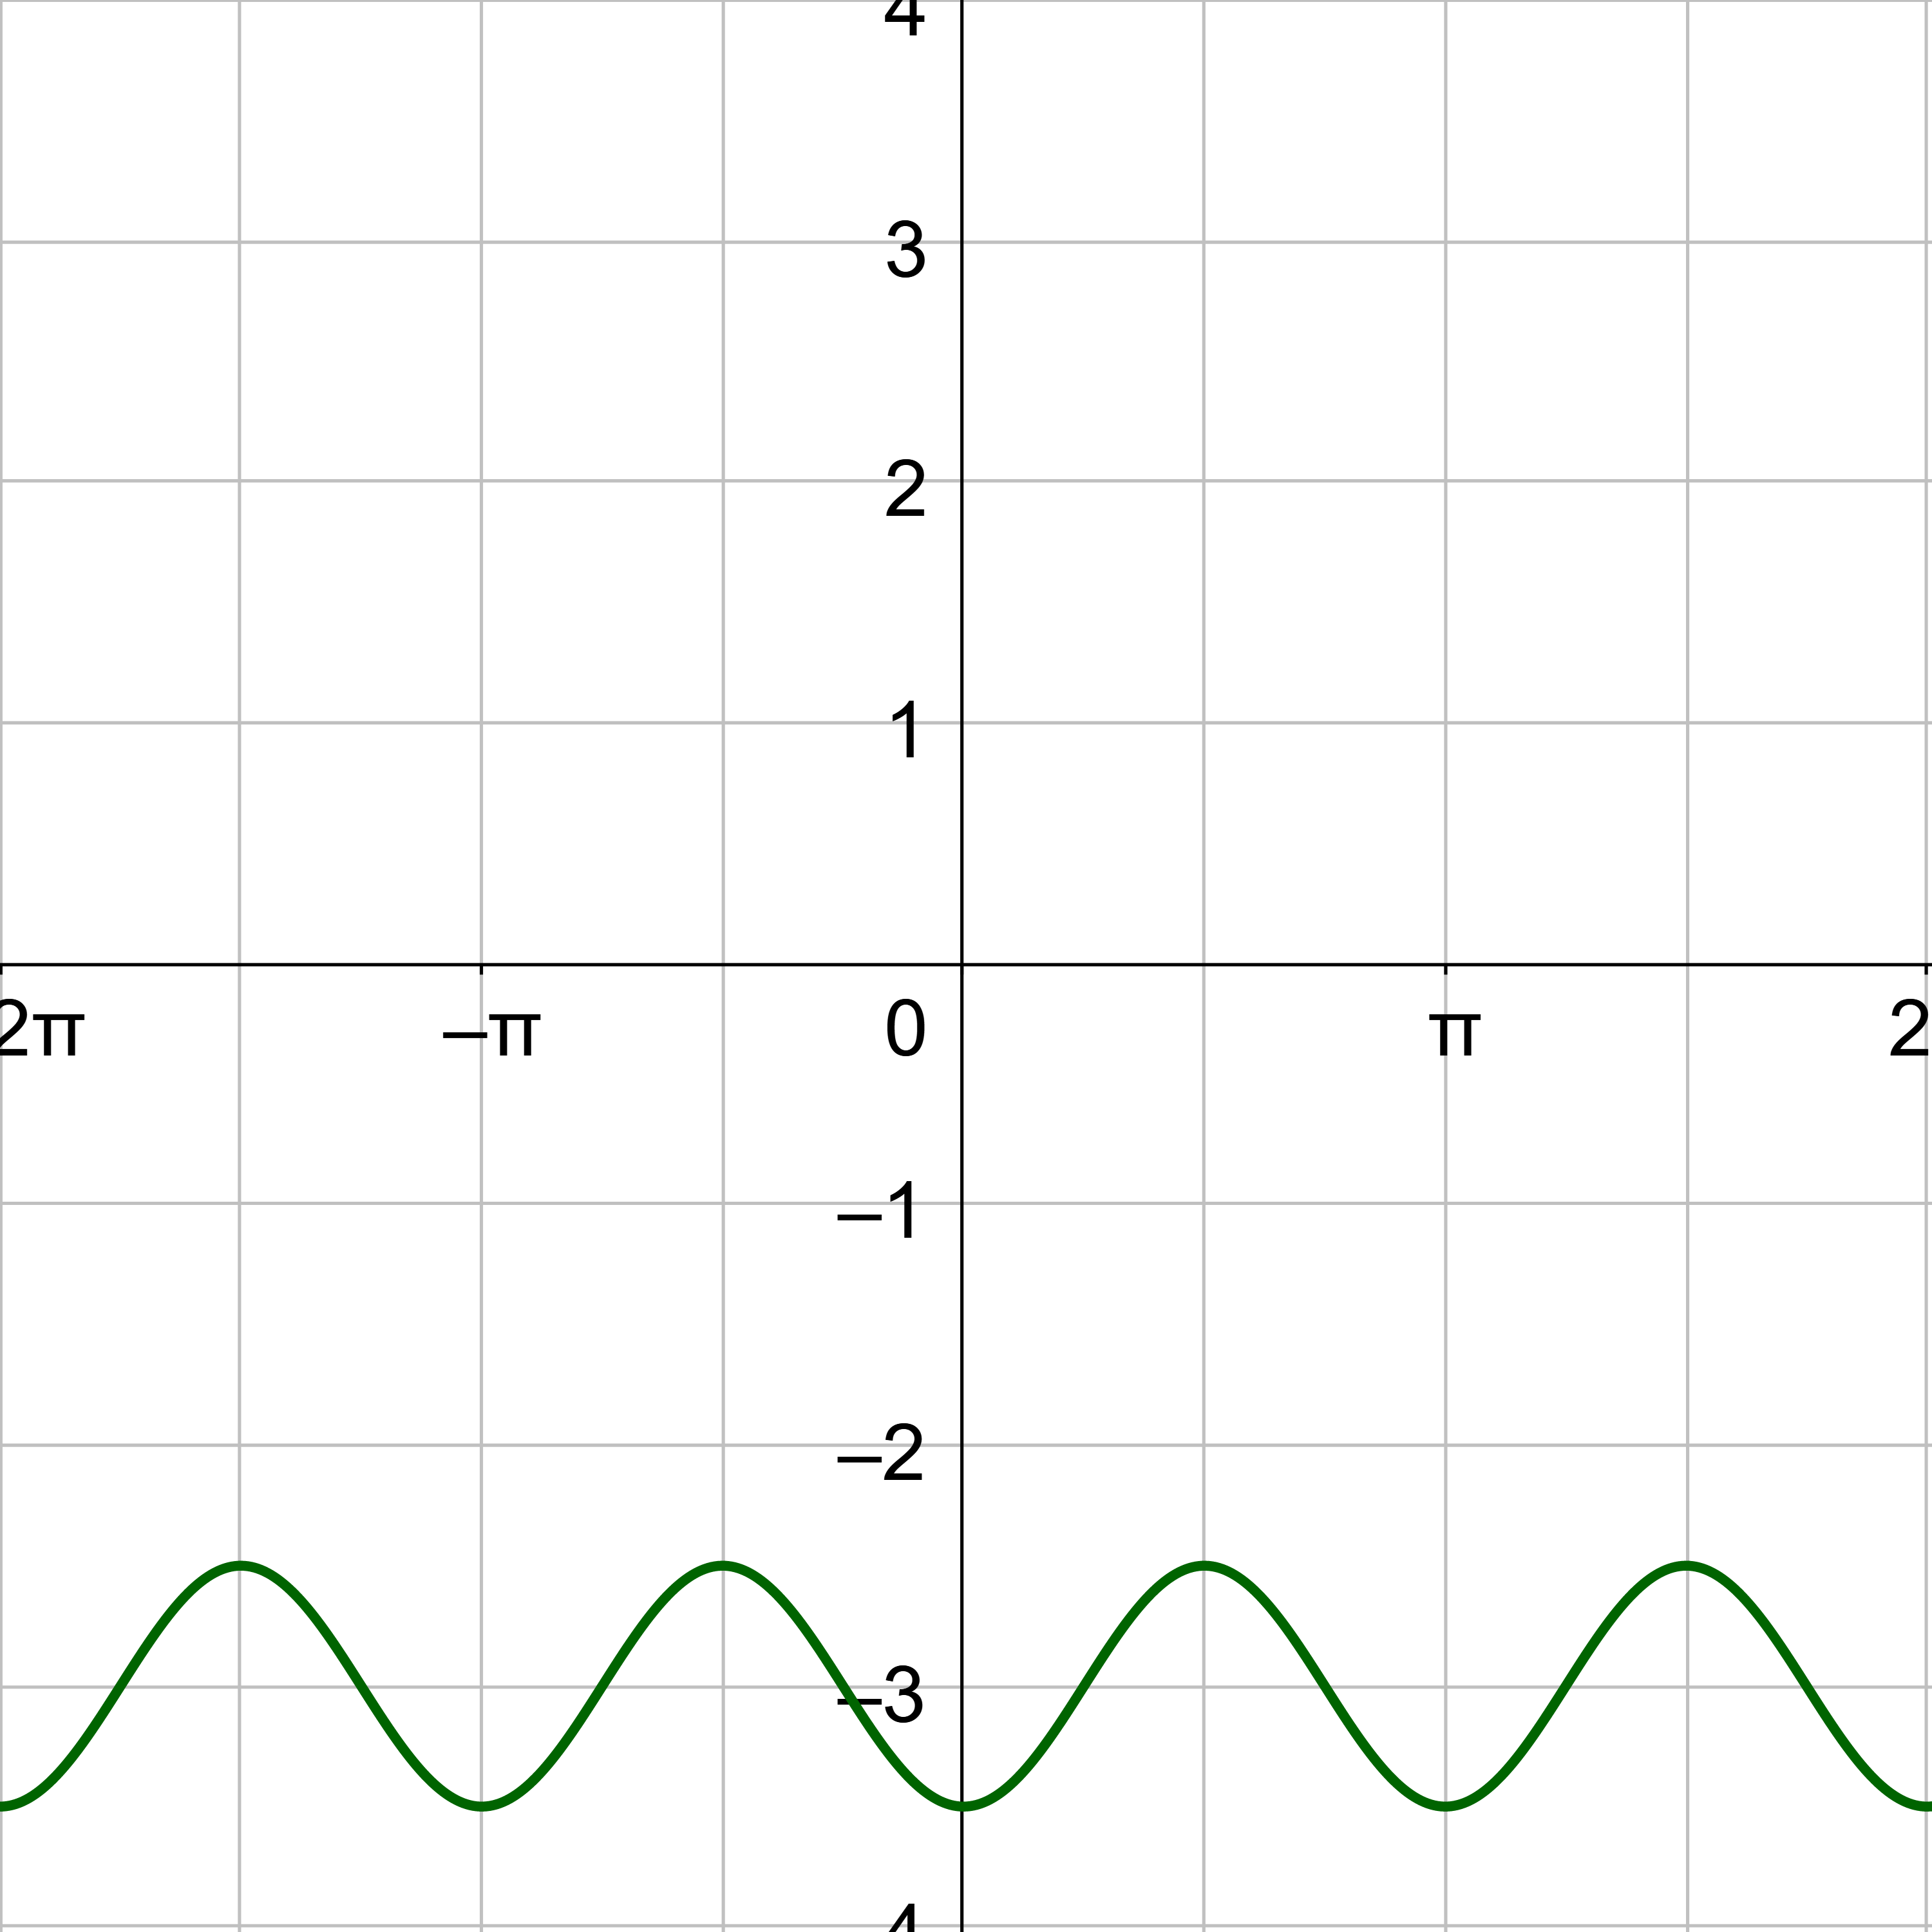
Graph y = sin (3x + π) + 1
Solution
Compare y = sin(3x + π) + 1 to y = a sin(bx − c) + d.
a = 1
b = 3
c = −π
d = 1
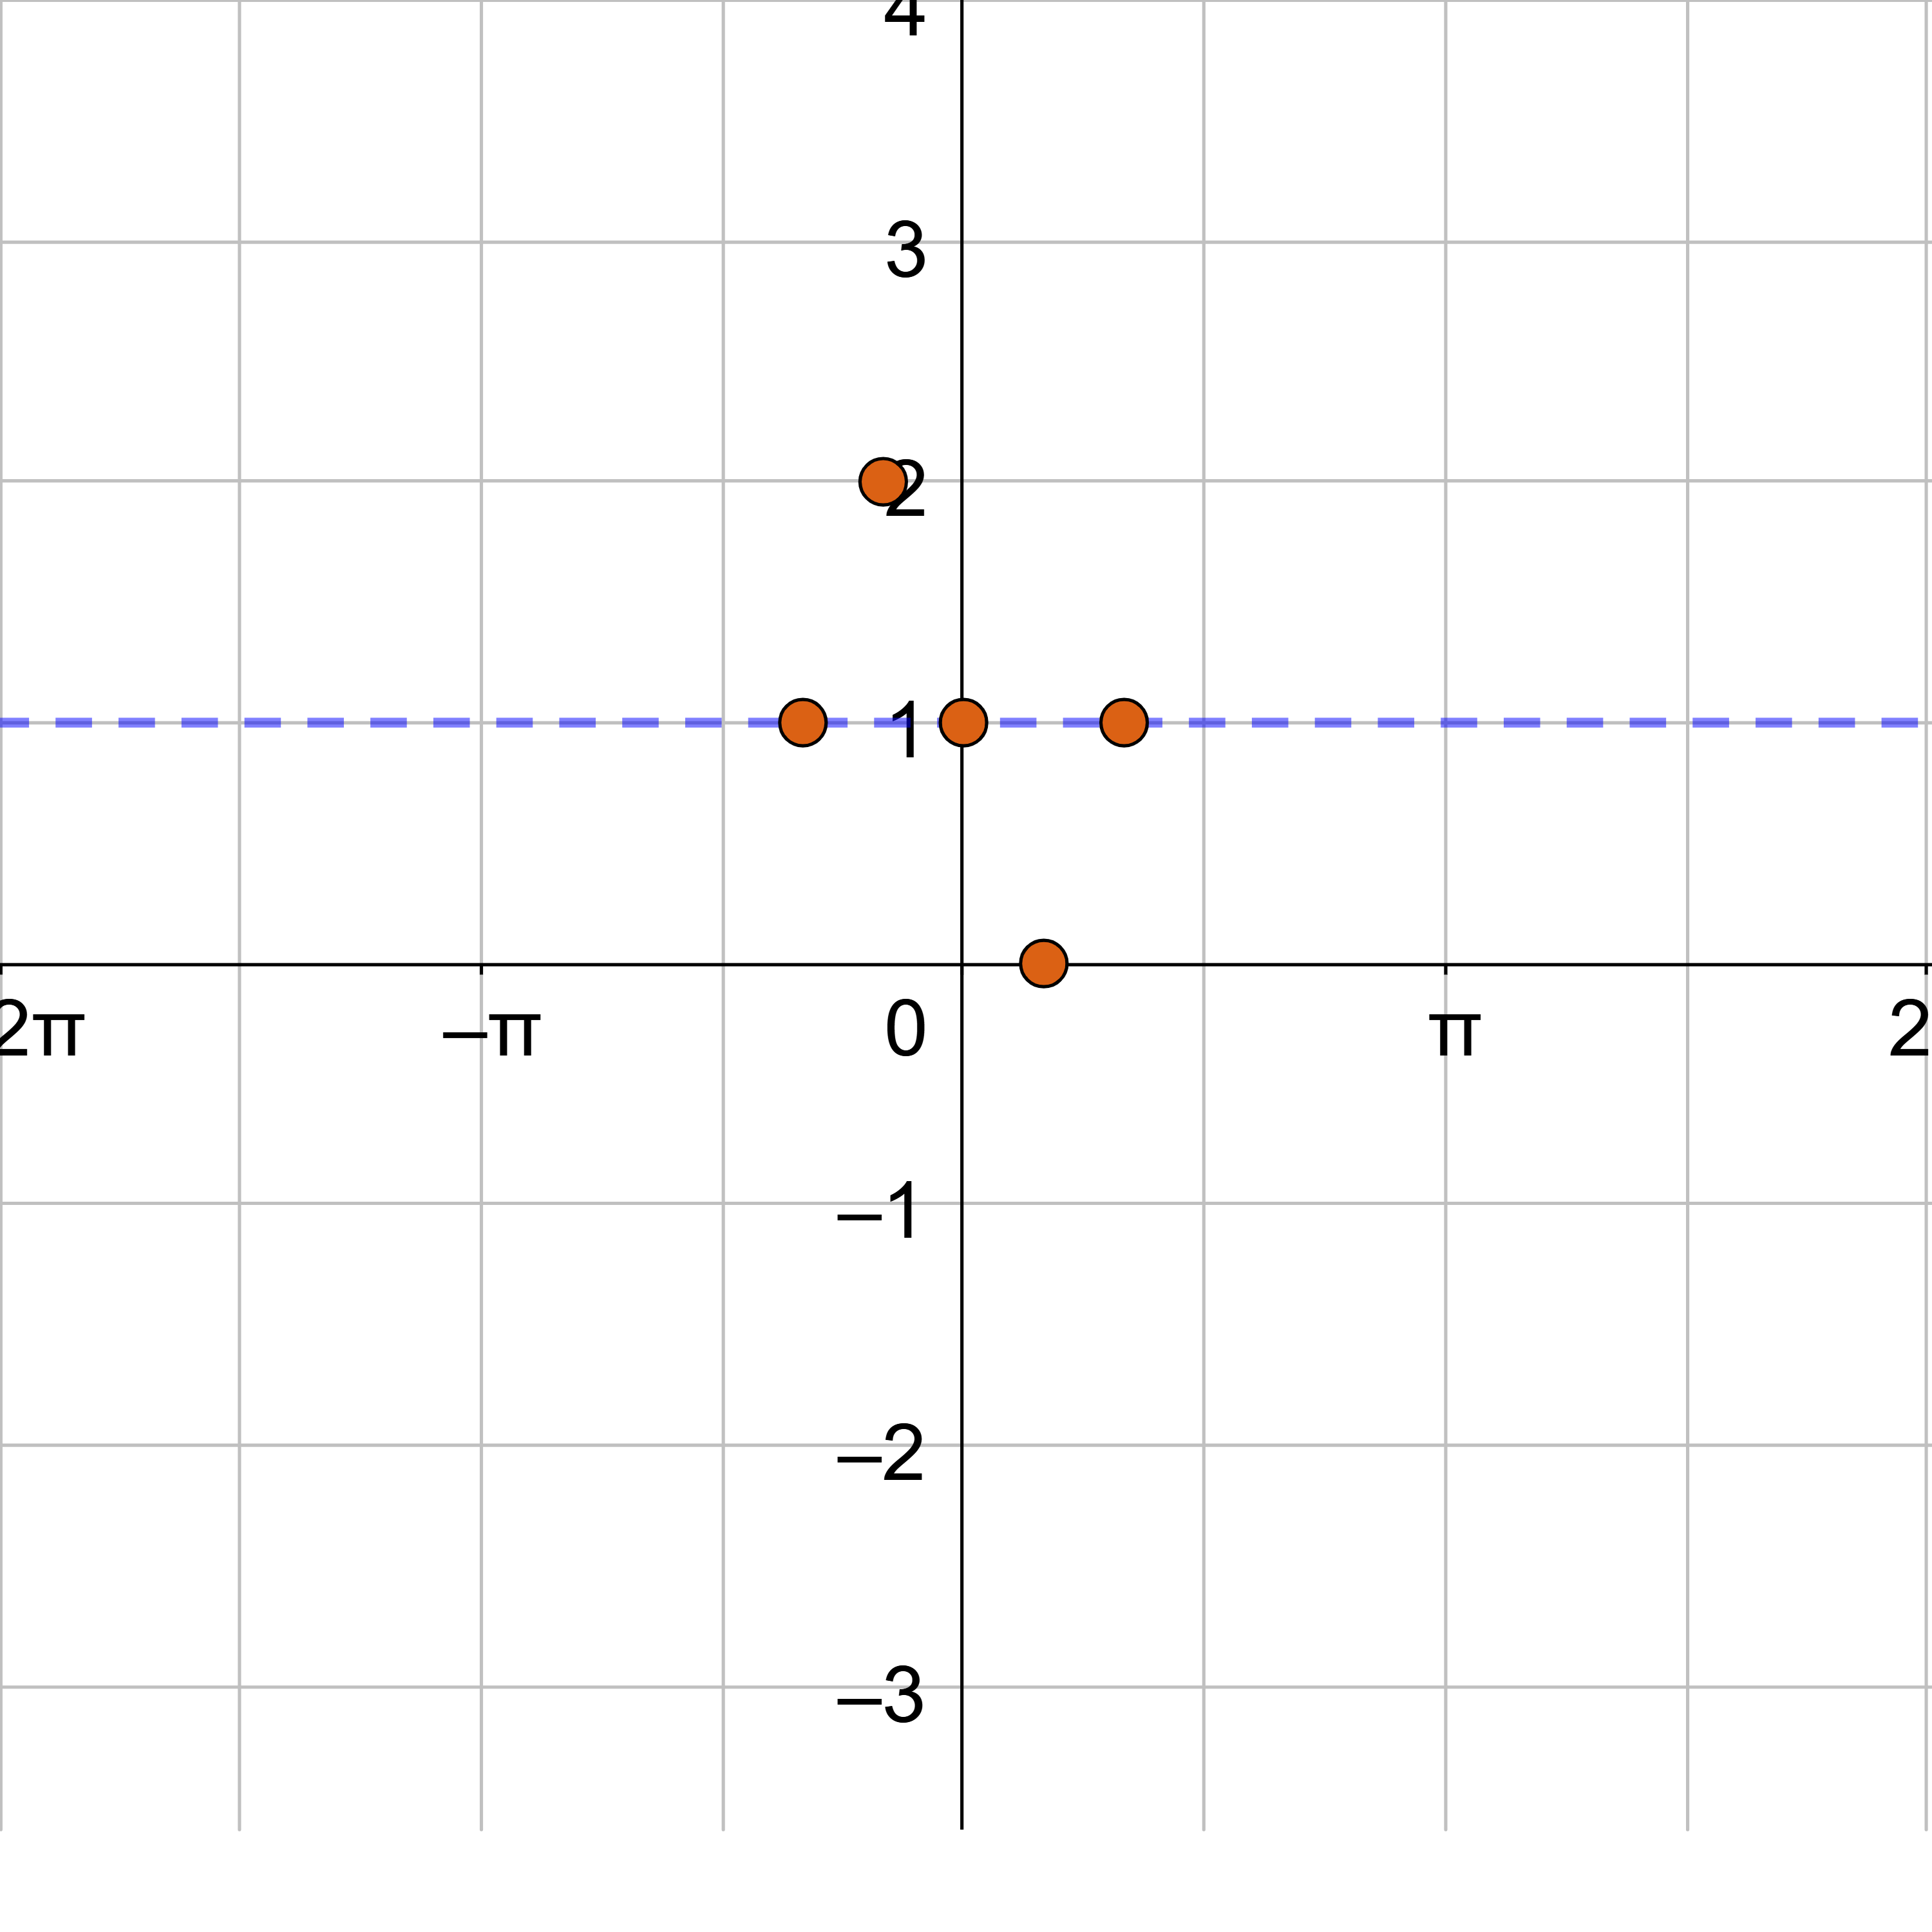
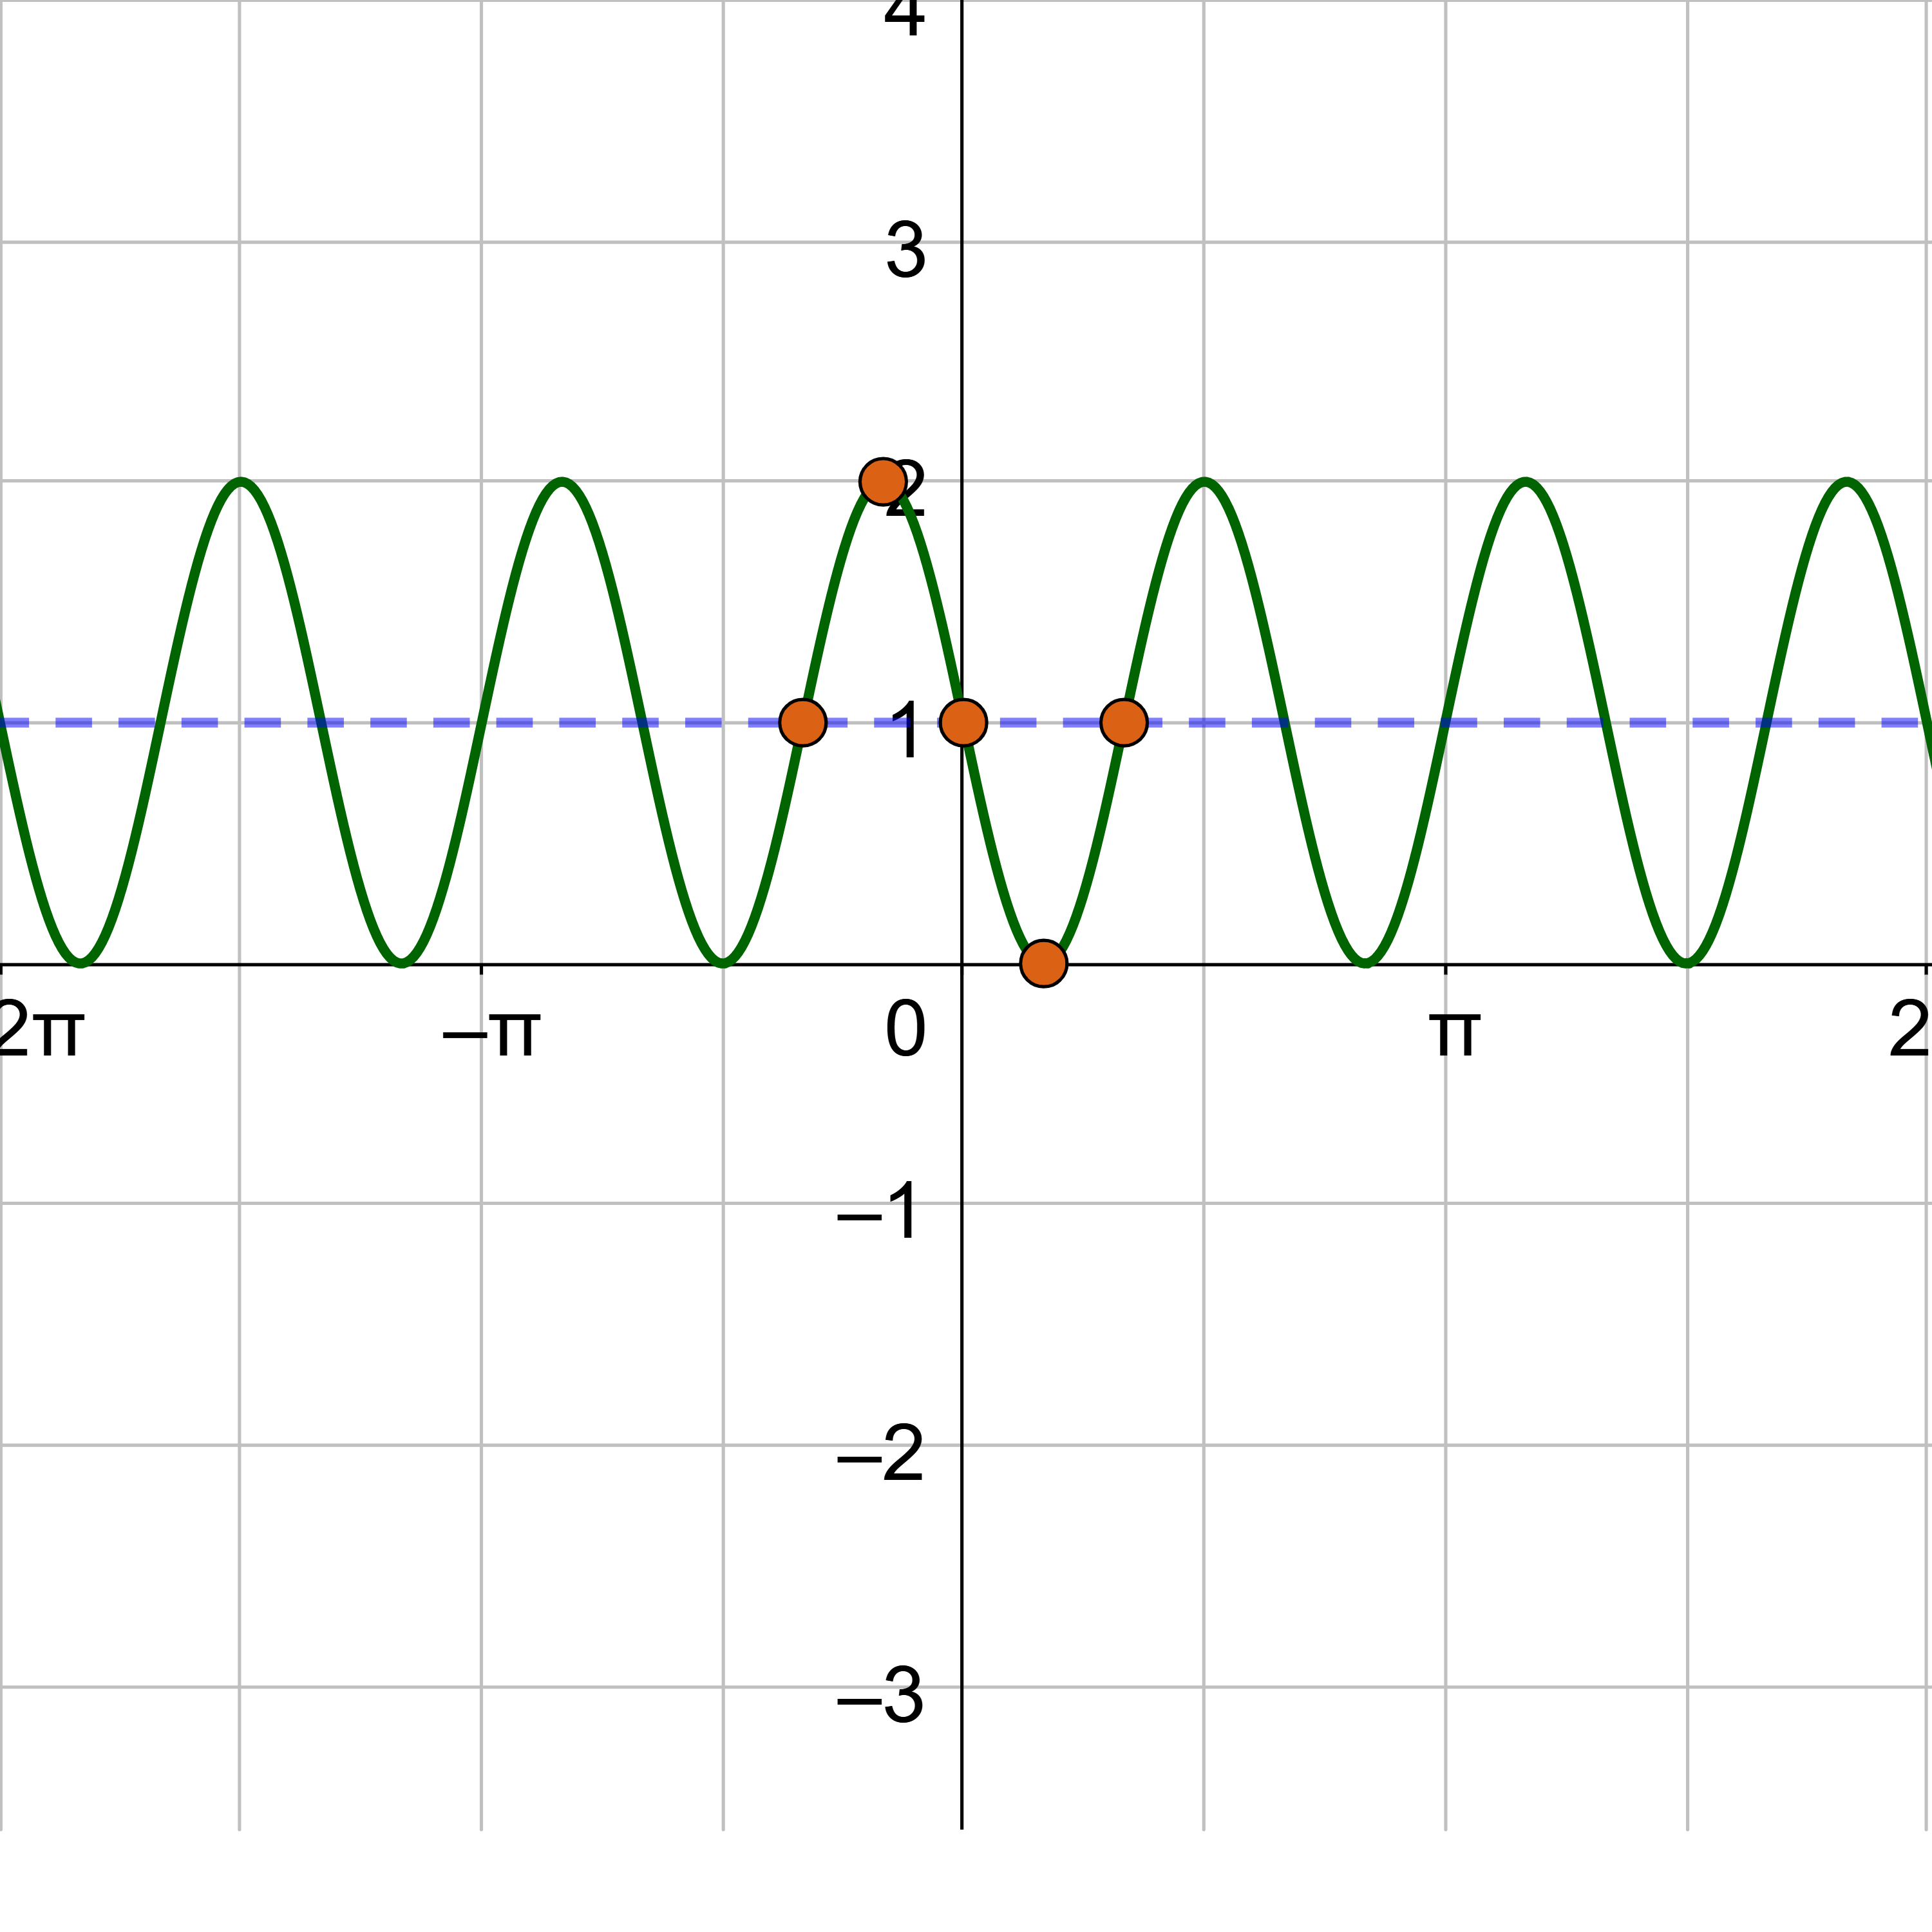
The midline is y = d, so y = 1. Draw this line on the graph as a light dotted line.
The amplitude is 1, so label the y-axis so the maximum of the curve is 1 above the midline, 2, and the minimum is 1 below the midline, 0.
The period is
The phase shift is
The first key points for sine is at (0, 0), but it has shifted left \(\frac{π}{3}\) and up 1, so it is \(\left(-\frac{π}{3}, 1\right)\). The fifth key point is one period to the right or at \(\left(-\frac{π}{3} + \frac{2π}{3}, 1\right) = \left(\frac{π}{3}, 1\right)\). The middle key point is halfway between the 1st and 5th key points, (0, 1). The maximum is halfway between the 1st and 3rd key points and the amplitude higher, \(\left(-\frac{π}{6}, 2\right)\). The minimum is halfway between the 3rd and 5th key points and the amplitude lower, \(\left(\frac{π}{6}, 0\right)\).
Sketch the sine curve through the key points and continue the shape so it repeats at either end.
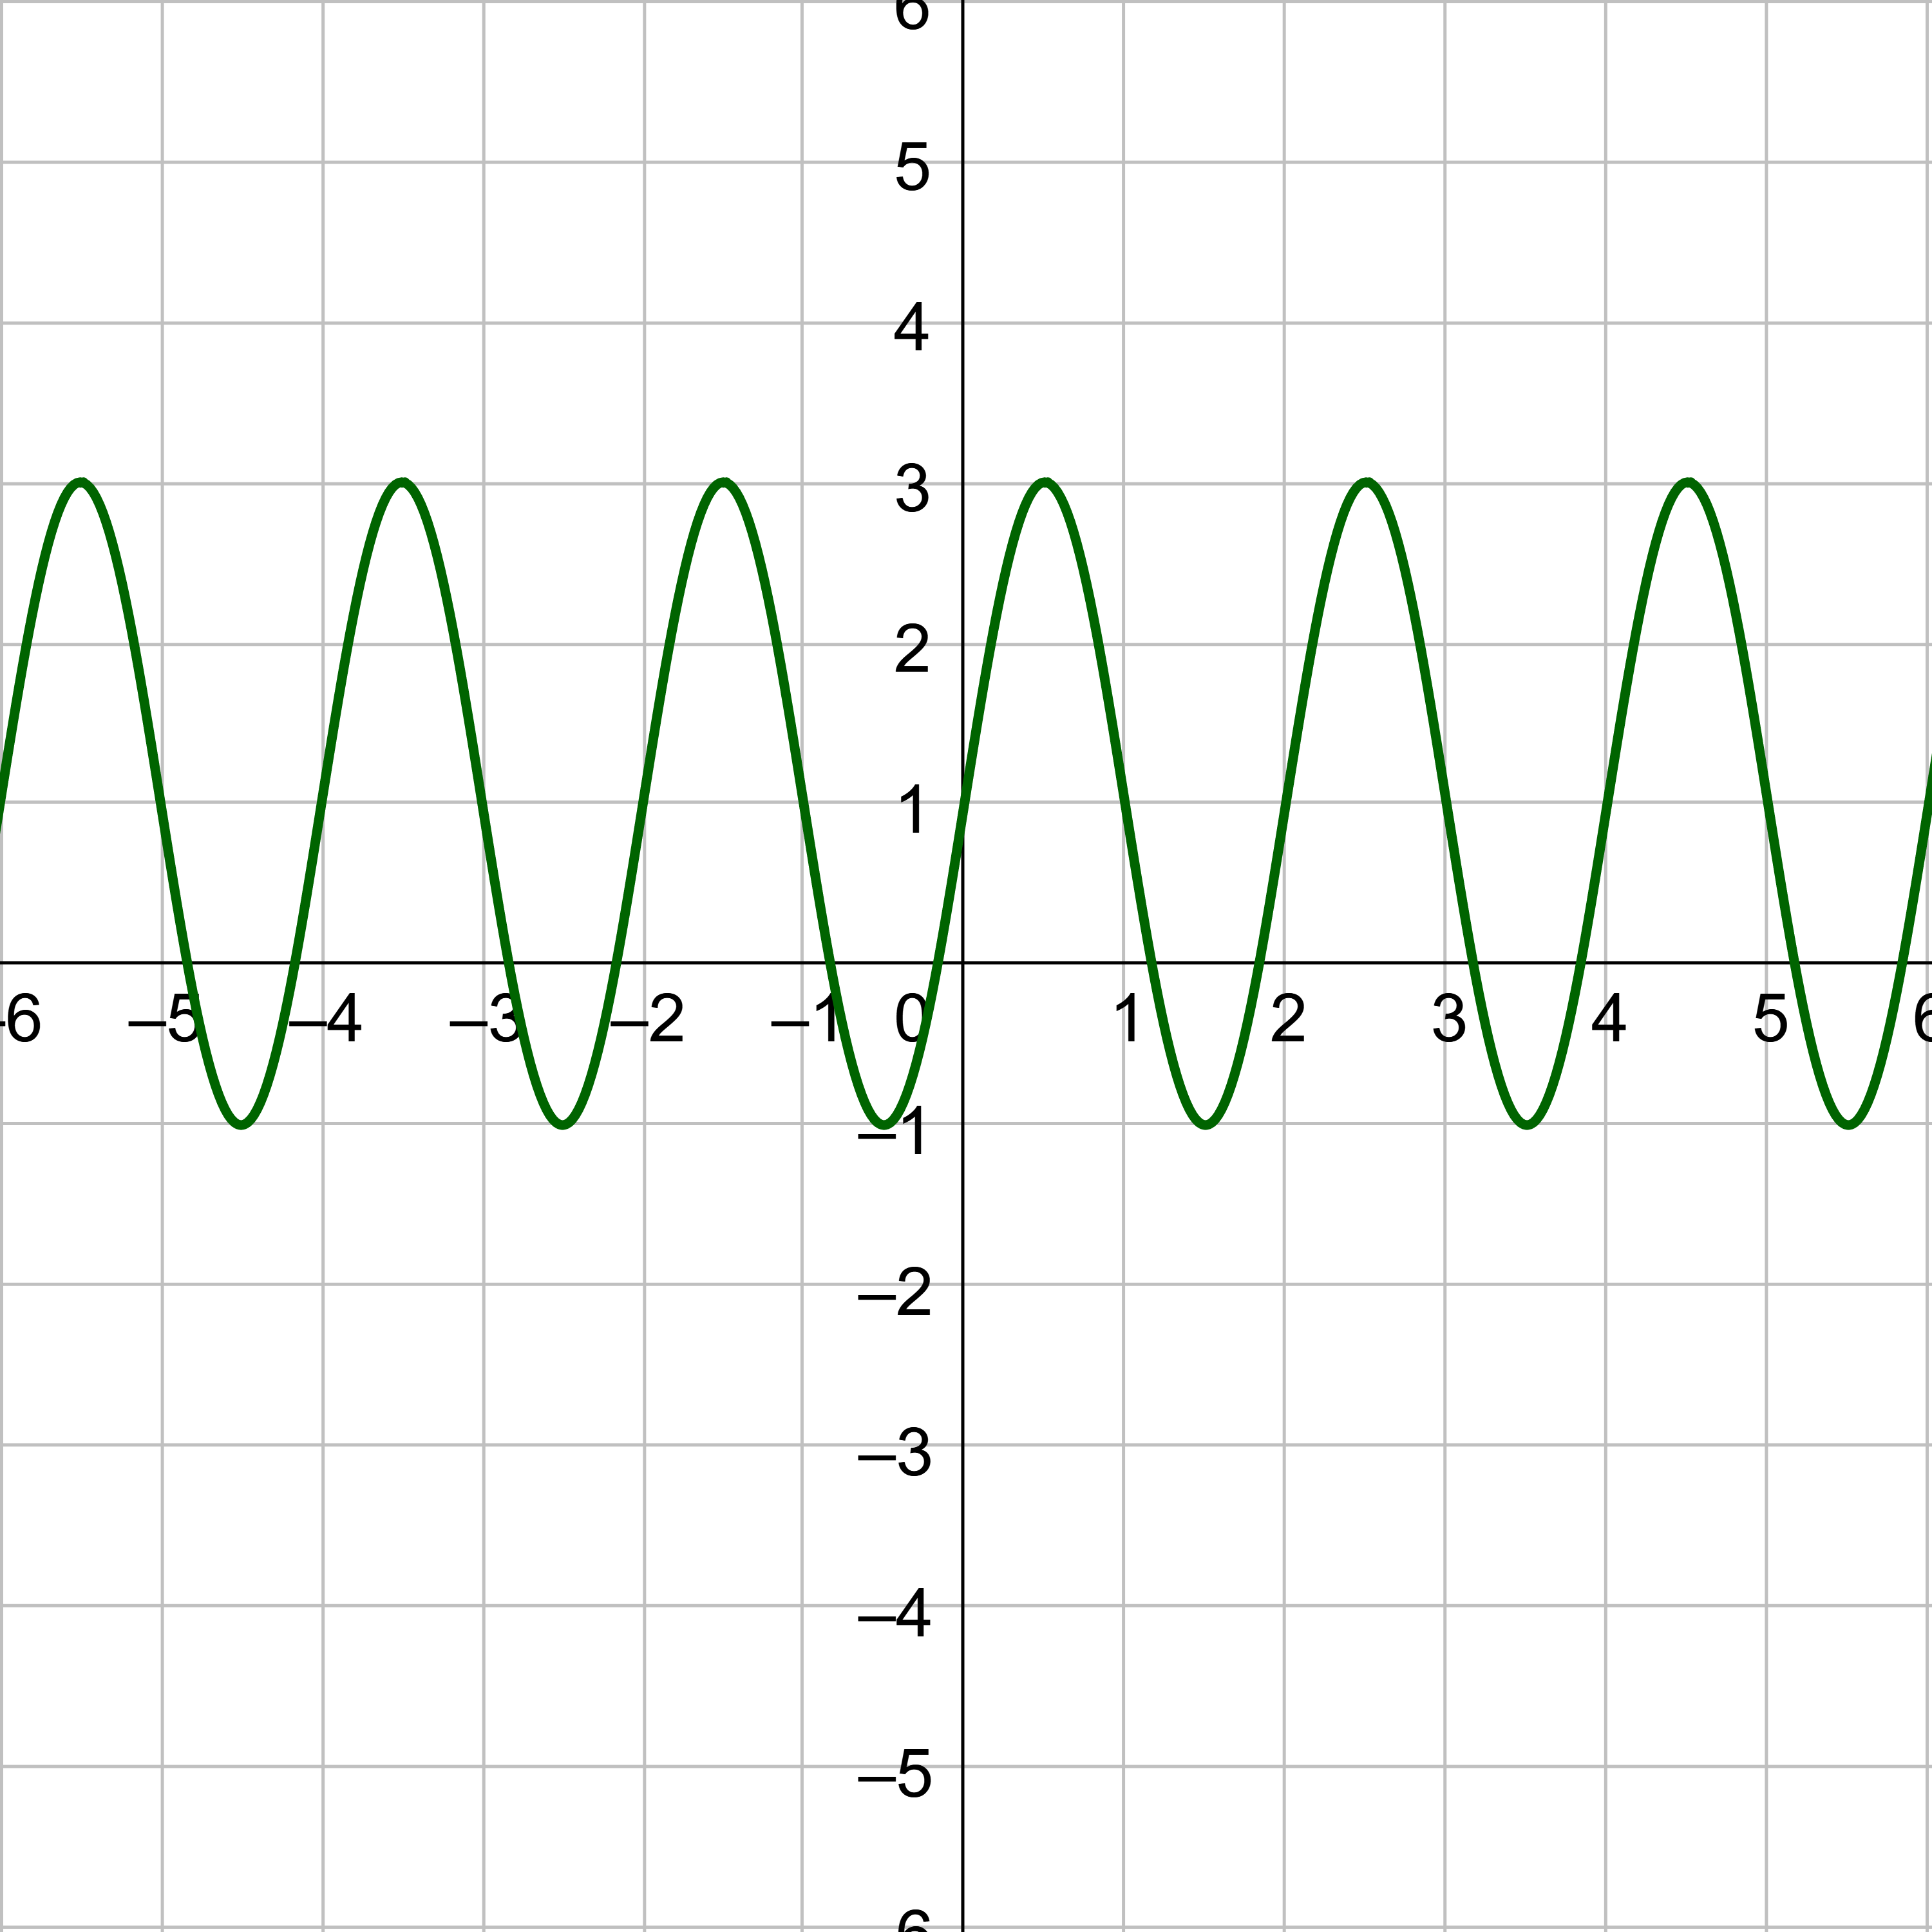
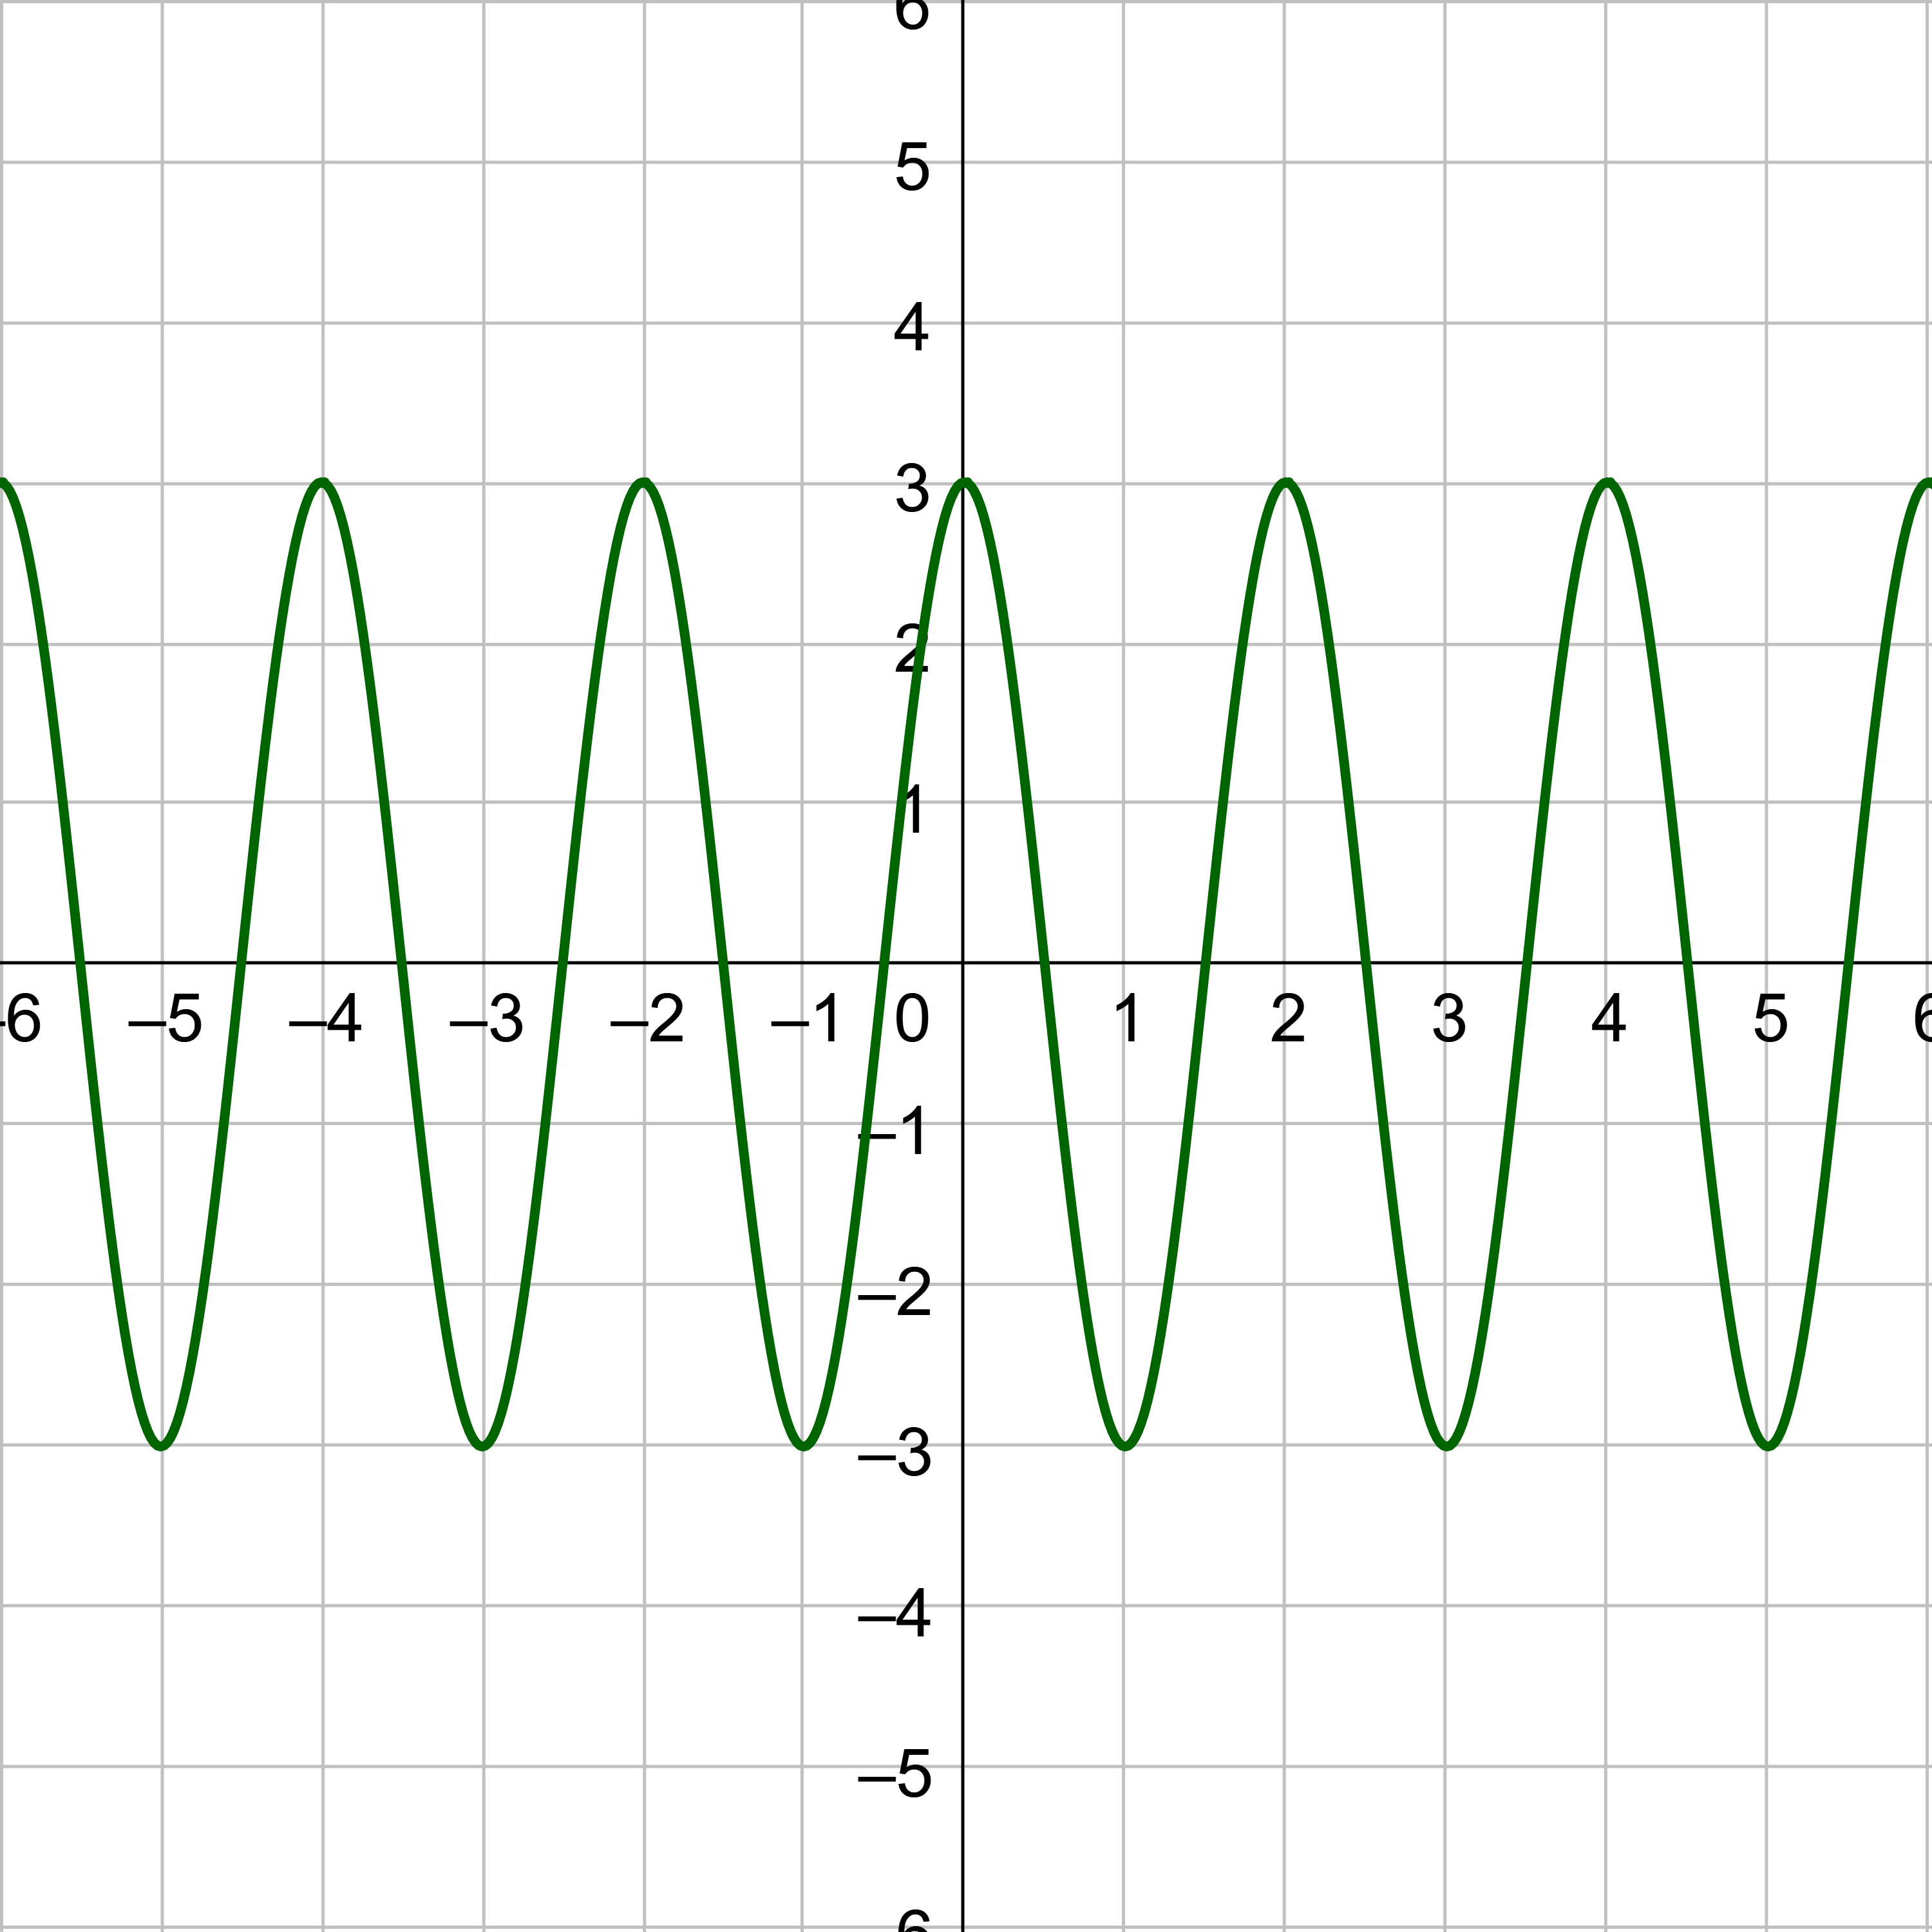
Sketch a graph of y = 4 cos(2x) – 3.
Solution
Compare y = 4 cos(2x) – 3 with y = a cos(bx − c) + d.
a = 4
b = 2
c = 0
d = −3
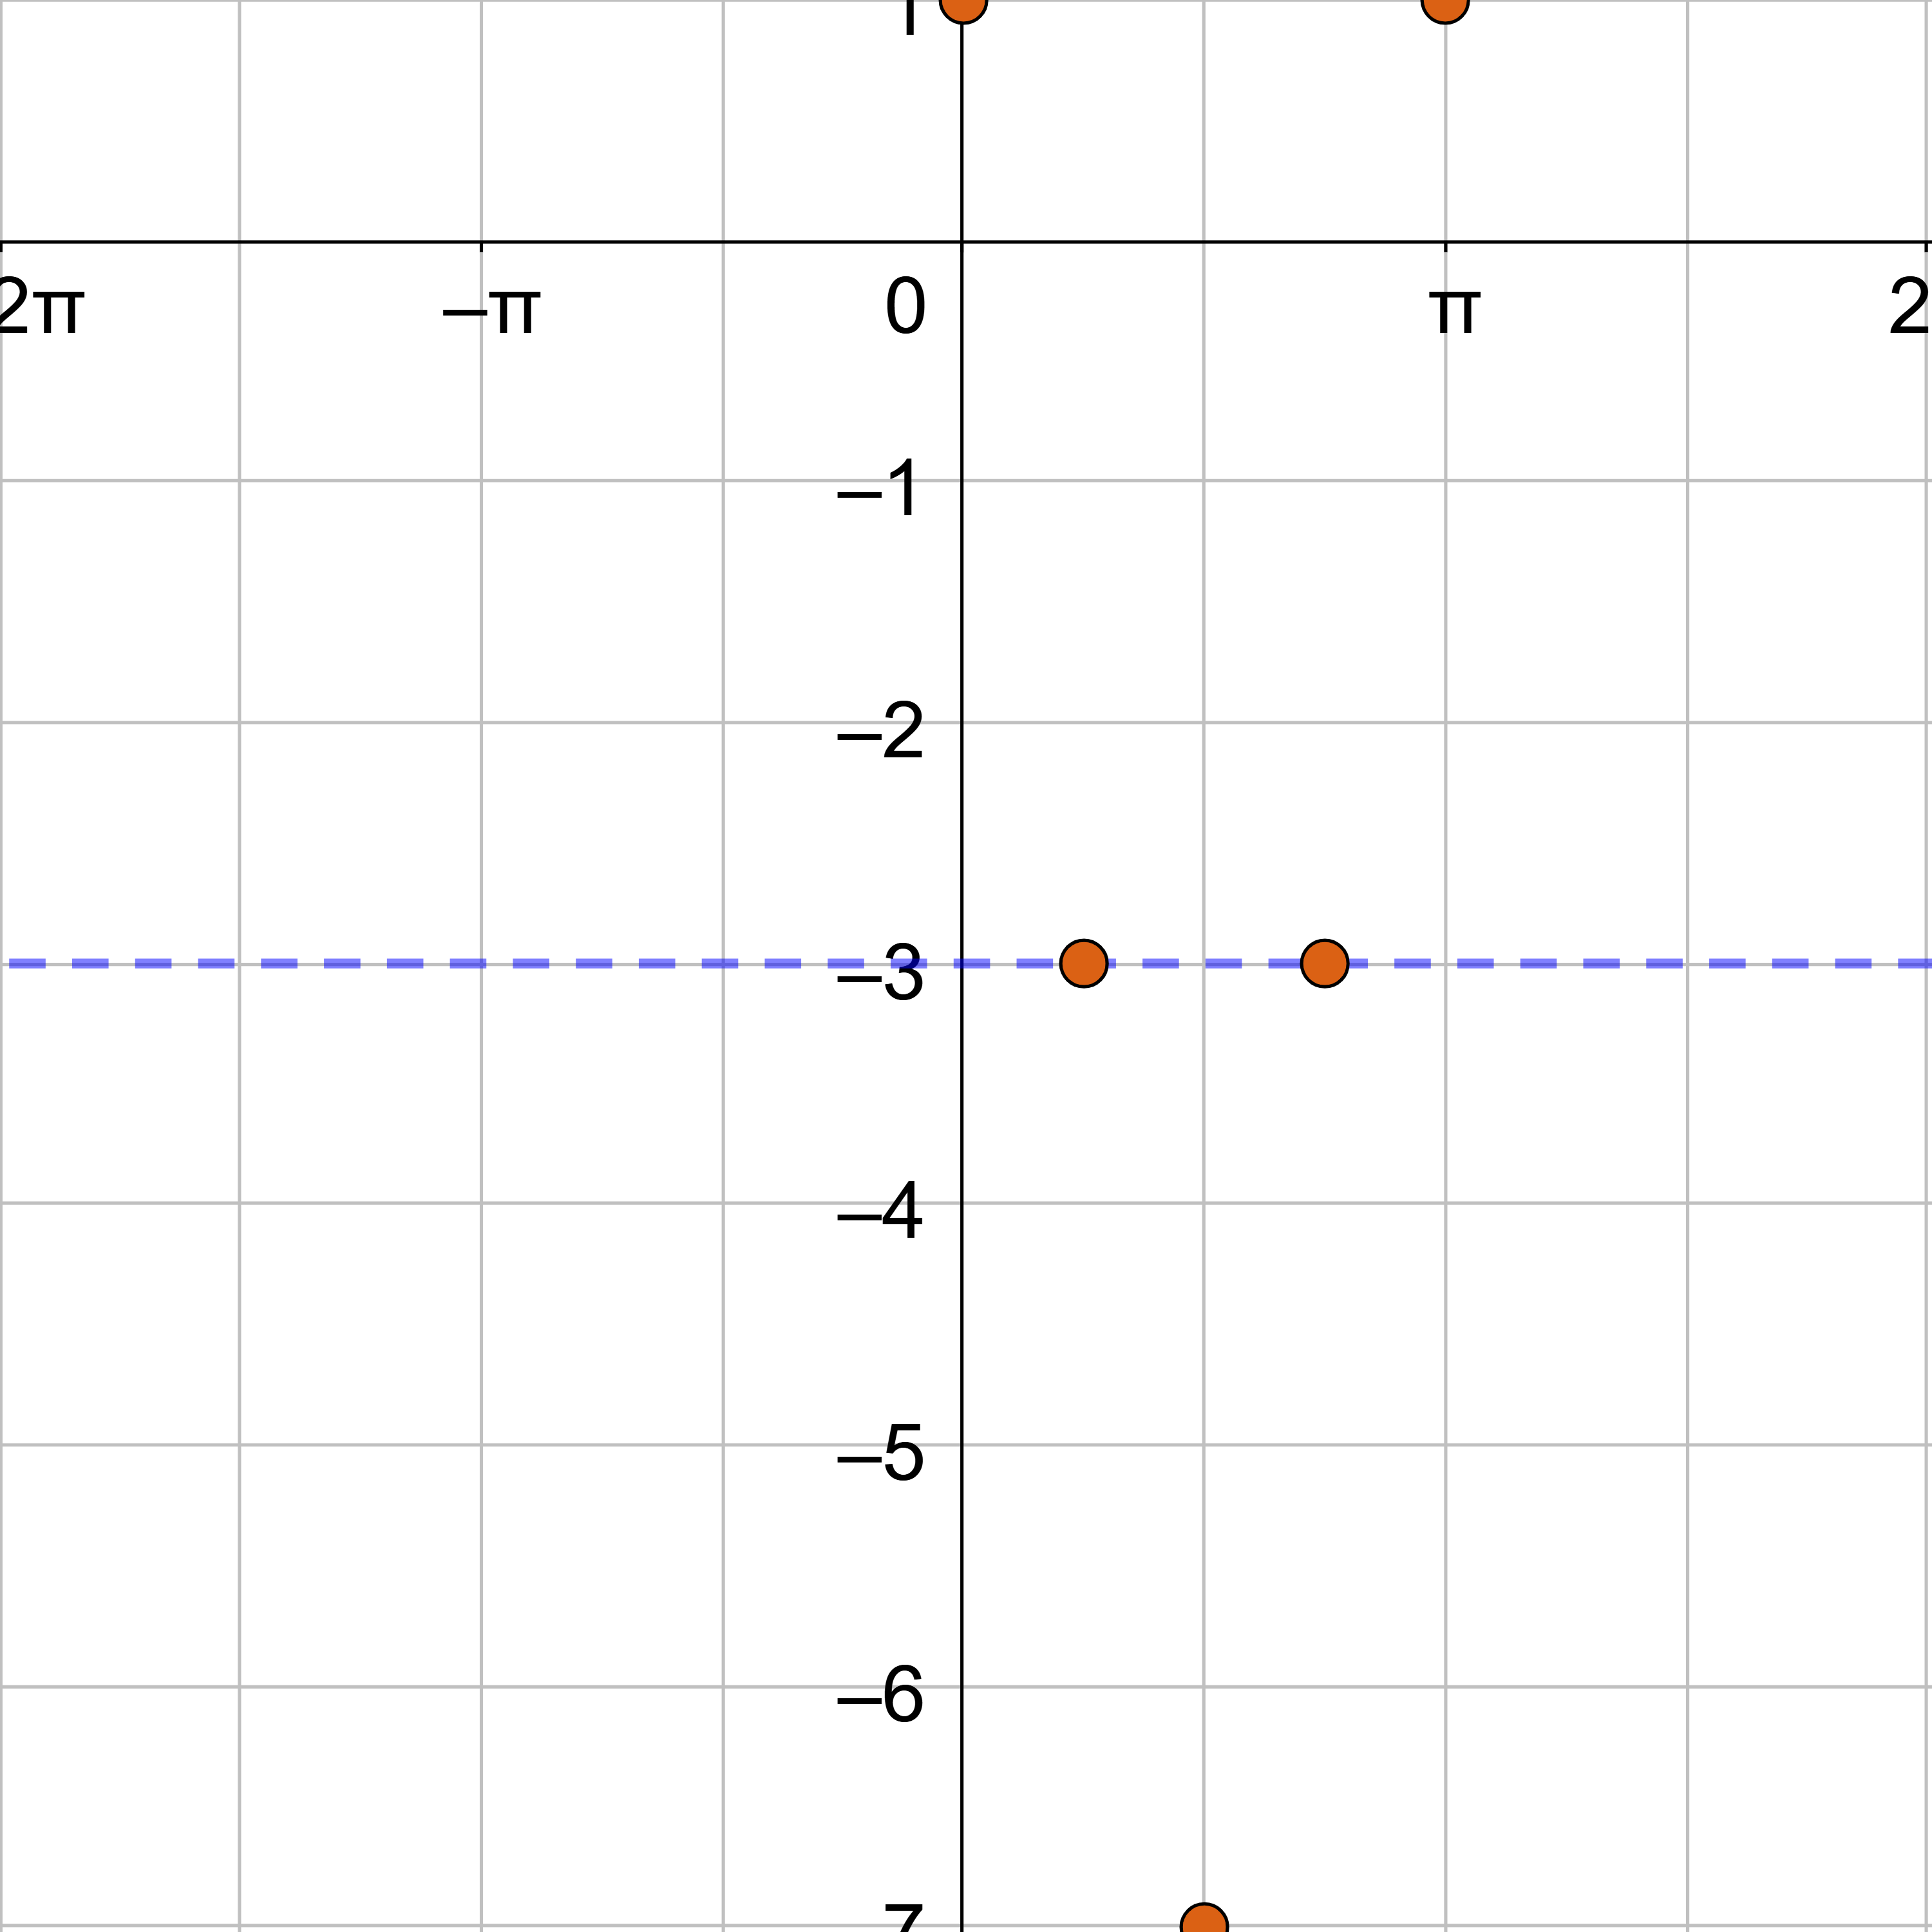
The midline is y = d, so y = −3. Draw this line on the graph as a light dotted line.
The amplitude is 4, so label the y-axis so the maximum of the curve is 4 above the midline, 1, and the minimum is 4 below the midline, −7.
The period is
$$ T = \frac{2π}{b} $$
$$ T = \frac{2π}{2} $$
$$ T = π $$
The phase shift is
$$ PS = \frac{c}{b} $$
$$ PS = \frac{0}{2} = 0 $$
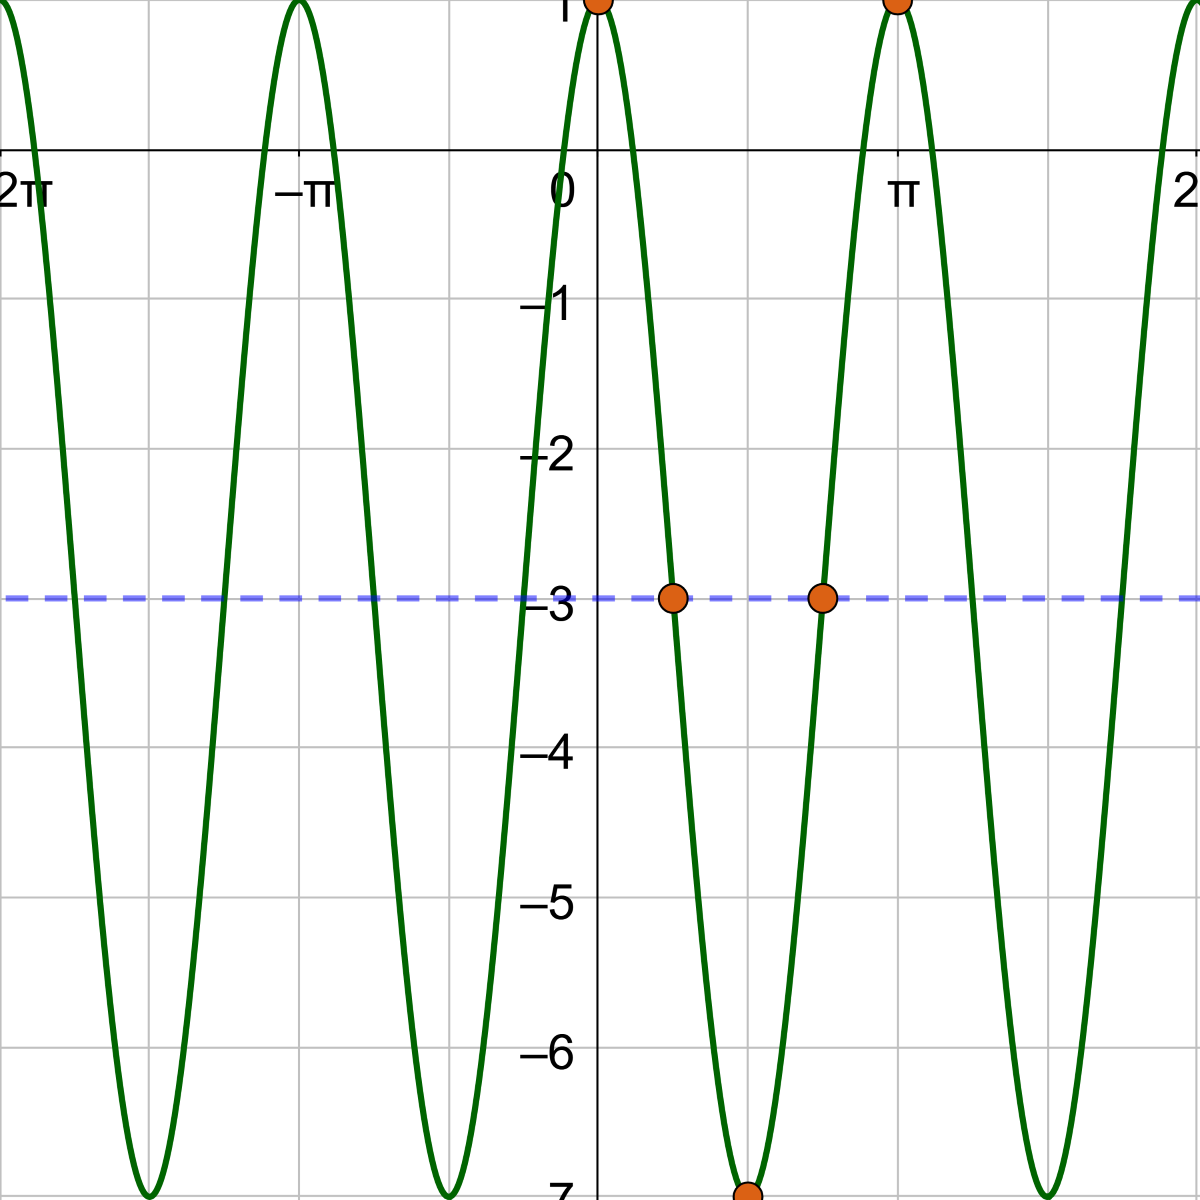
The first key points for cosine is at (0, a), but it has shifted down 3, so it is (0, 4 − 1) = (0, 3). The fifth key point is one period to the right or at (0 + π, 3) = (π, 3). These are the maximums. The minimum is the middle key point and is halfway between the 1st and 5th key points but an amplitude below the midline, \(\left(\frac{π}{2}, -7\right)\). One zero is halfway between the 1st and 3rd key points on the midline, \(\left(\frac{π}{4}, -3\right)\). The other zero is halfway between the 3rd and 5th key points on the midline, \(\left(\frac{3π}{4}, -3\right)\).
Sketch the sine curve through the key points and continue the shape so it repeats at either end.
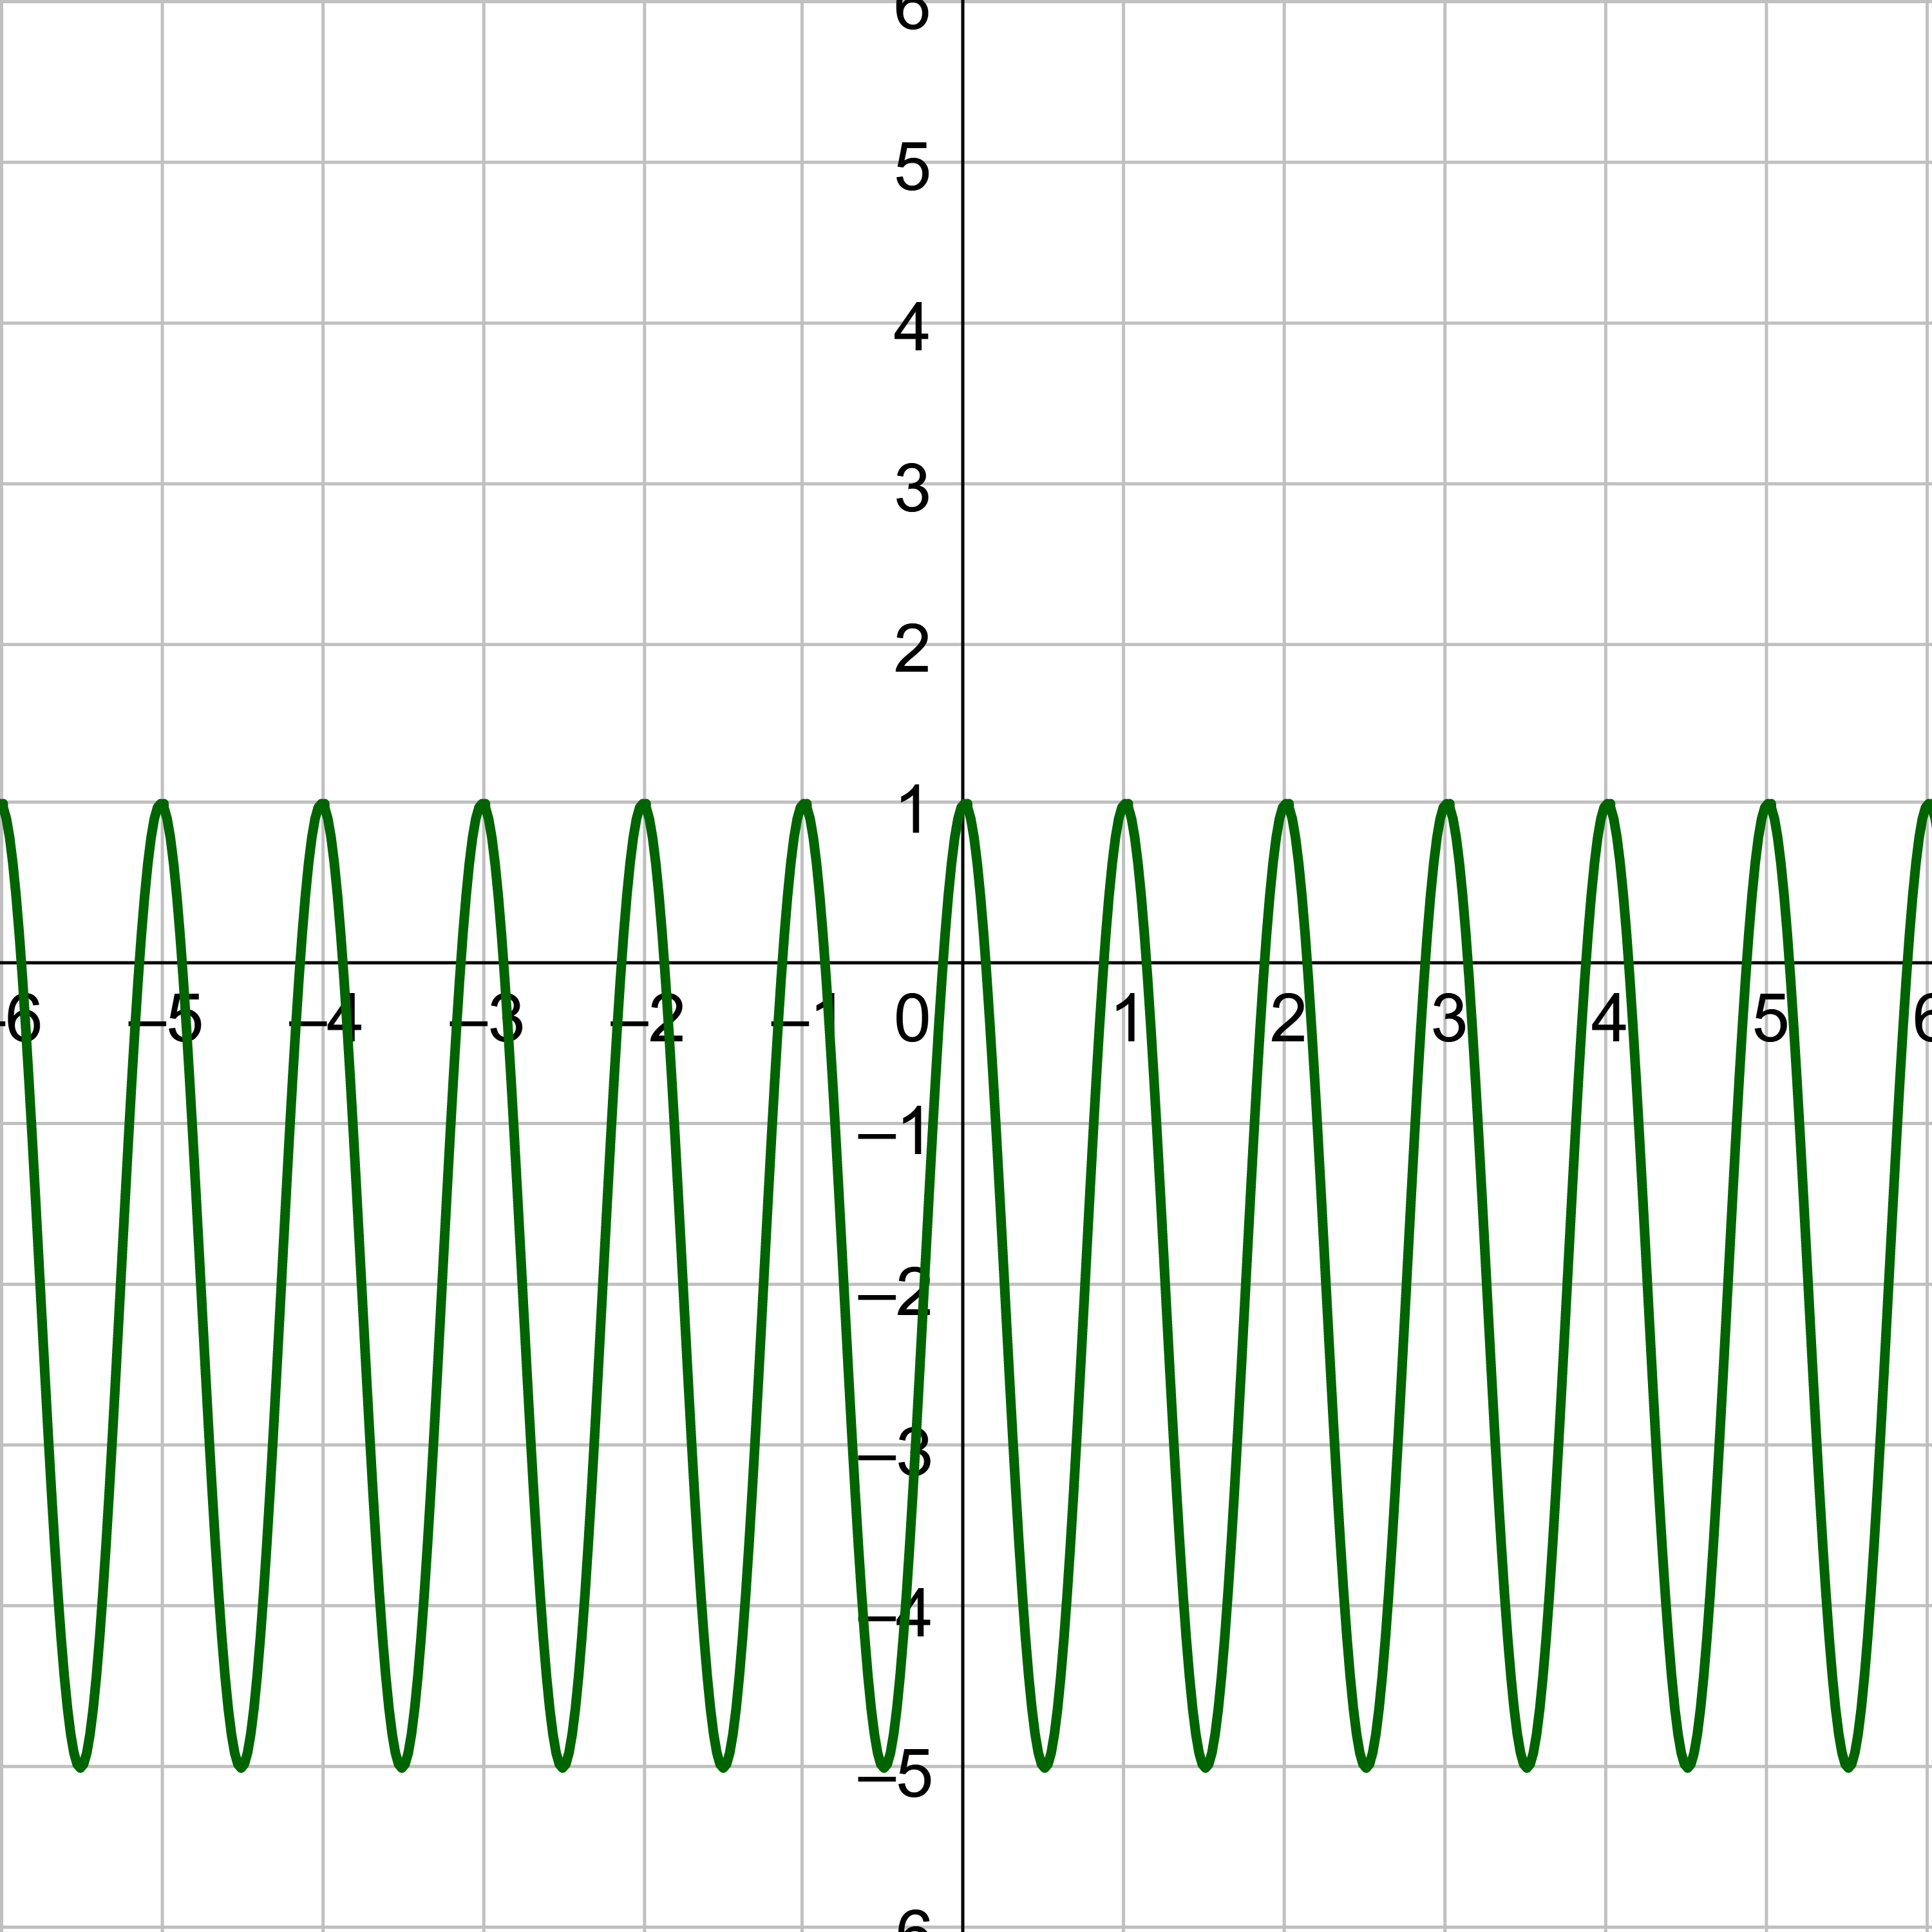
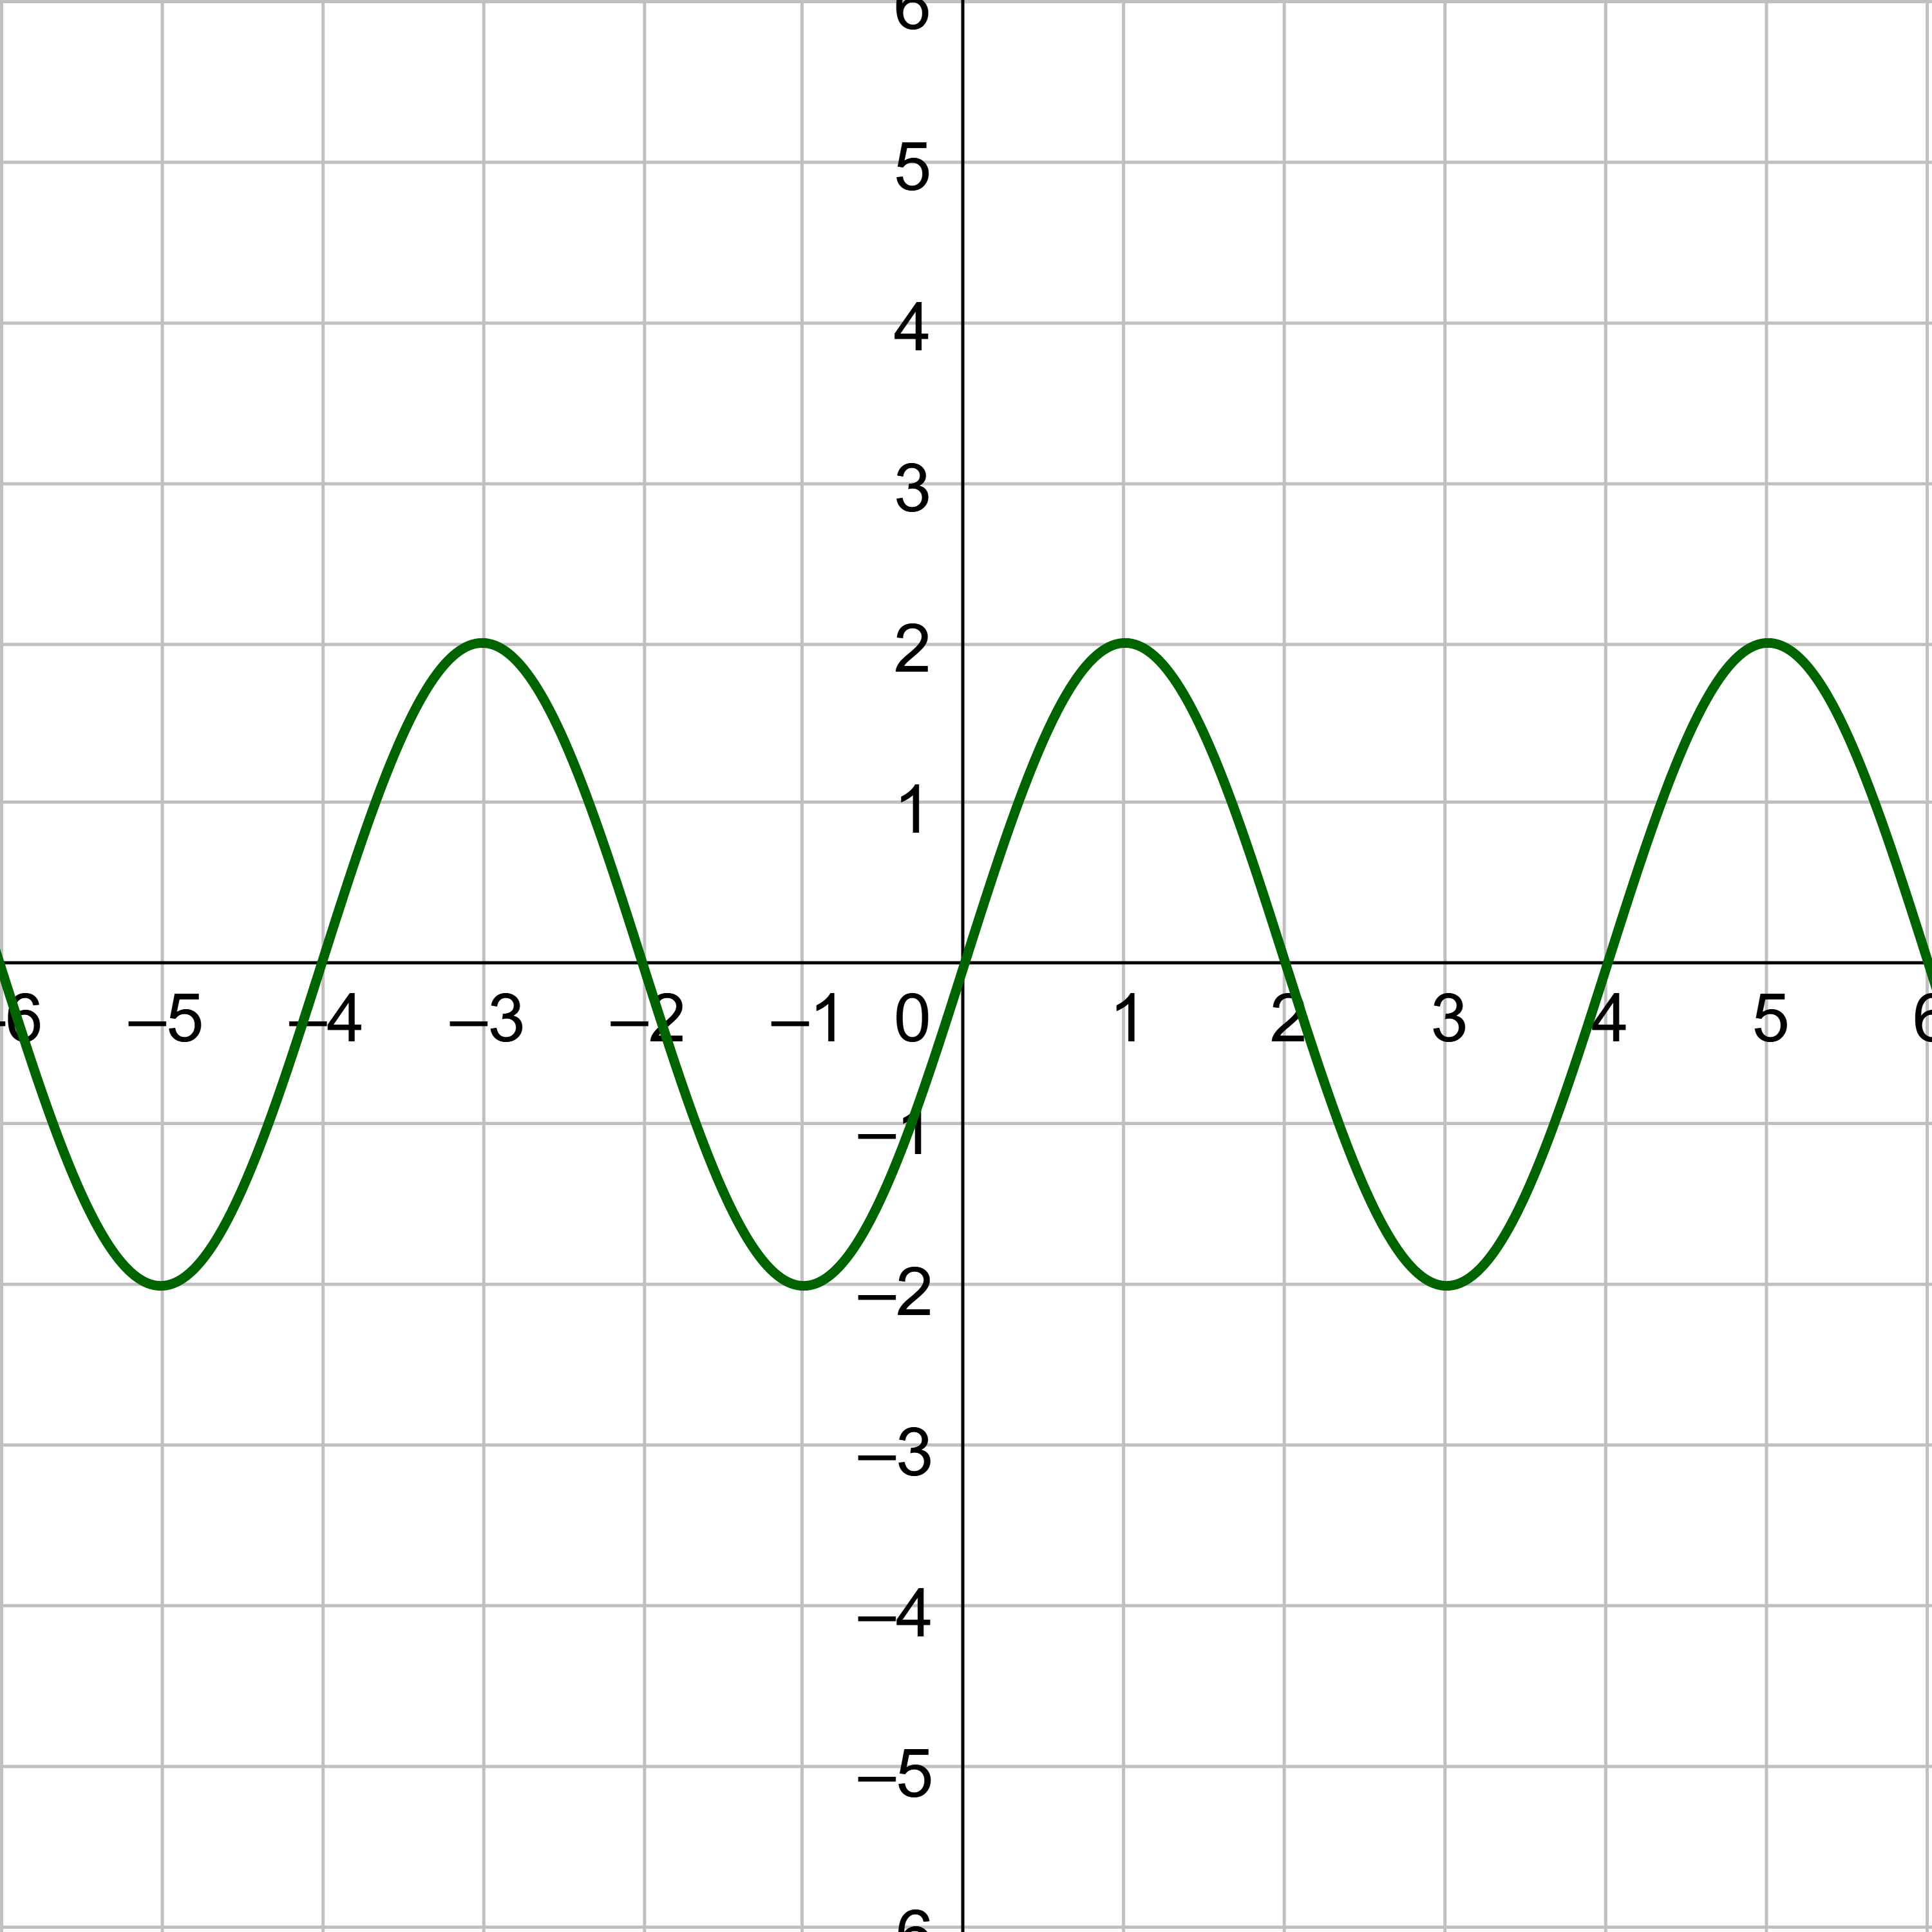
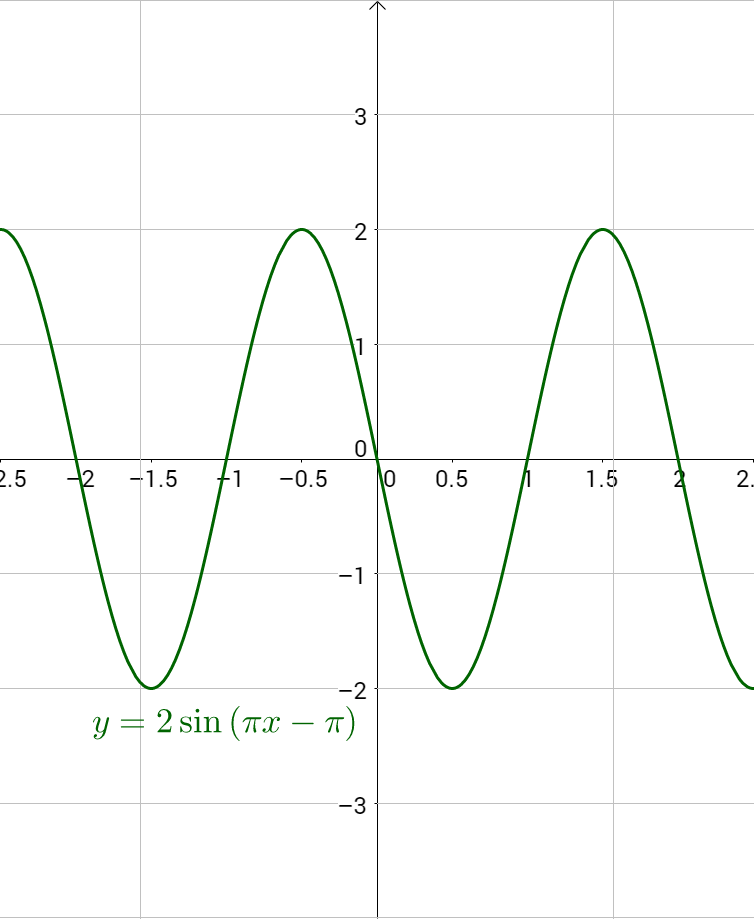
Sketch a graph of y = 2 sin(πx − π)
Answer
Periodic motion and other events that repeat can often be modeled with a sine or cosine function. To begin, decide if you want to use sine or cosine. If the data is zero at x = 0, use y = a sin(bx − c) + d. If the data is a maximum at x = 0, use y = a cos(bx − c) + d. Otherwise either sine or cosine will work. Second, determine the equilibrium, or middle, value by averaging the minimum and maximum values. This is the vertical translation, called the midline, y = d. Next determine the amplitude, a, by subtracting the maximum and the equilibrium values. Then determine the period by finding how long it takes to complete a full cycle. Calculate b using period = \(\frac{2π}{b}\). Finally find c by looking at the phase shift. If using sine, find when the first intercept occurs. If you are using cosine, find when the first maximum occurs. This is the phase shift, so use it to calculate c; \(PS = \frac{c}{b}\). Now fill in the formula to create the model.
Alternatively, to find c after you have found the a, b, and d, you could substitute a data point for x and y and solve for c.
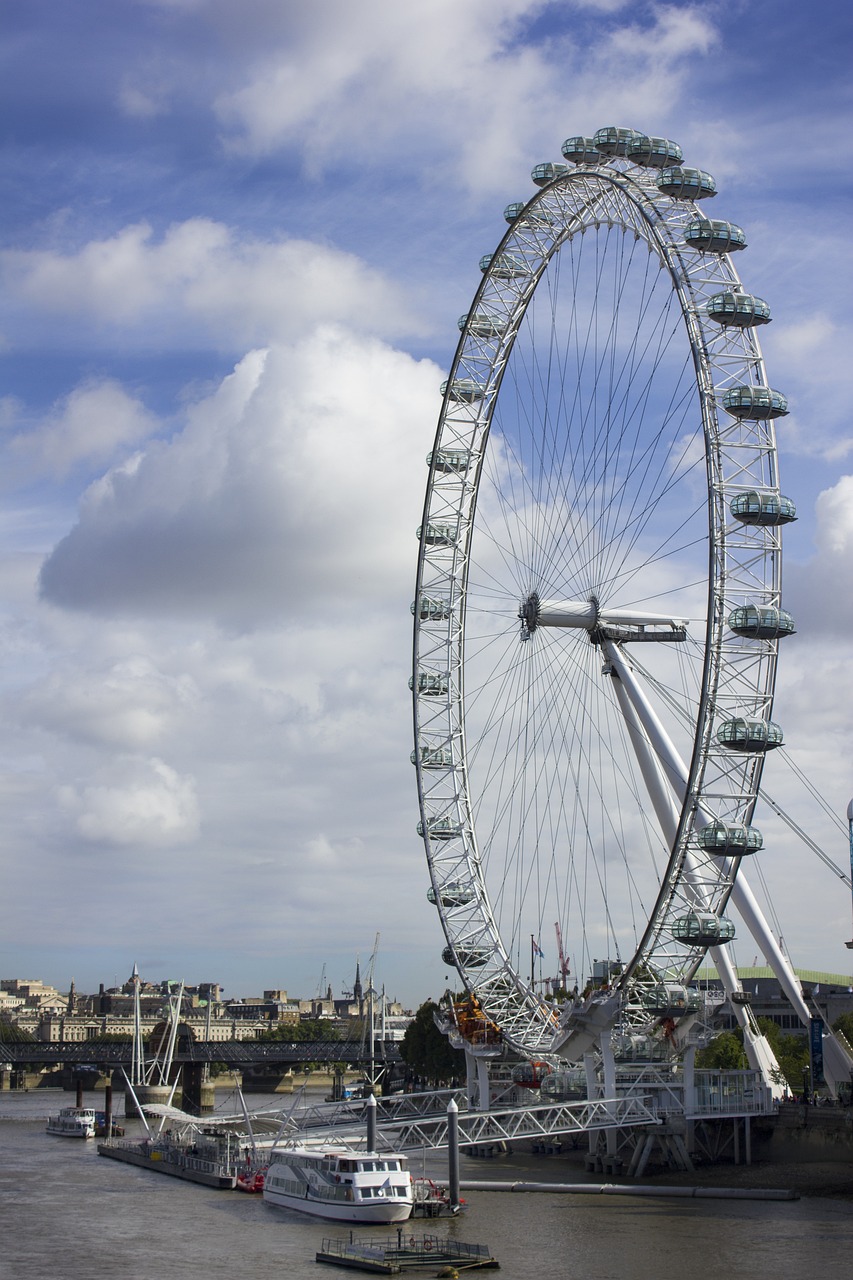
The London Eye is a huge Ferris wheel with a diameter of 120 meters (394 feet). It completes one rotation every 30 minutes. Riders board from a platform 15 meters above the ground. Express a rider's height above ground as a function of time in minutes.
Solution
Since passengers board at the lowest point, use cosine. Because it starts at a minimum instead of a maximum make a negative.
With a diameter of 120 m, the wheel has a radius of 60 m. The height will oscillate with amplitude 60 m above and below the center.
Passengers board 15 m above ground level, so the center of the wheel must be located 60 + 15 = 75 m above ground level. The midline of the oscillation will be at 75 m.
The wheel takes 30 minutes to complete 1 revolution, so the height will oscillate with a period of 30 minutes.
Amplitude: 60, so a = −60
Midline: 75, so d = 75
Period: 30, so \(b = \frac{2π}{30} = \frac{π}{15}\)
Phase shift: 0
An equation for the rider’s height would be where t is in minutes and y is measured in meters.
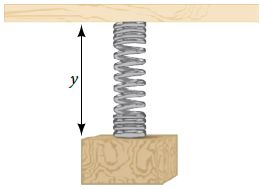
A weight is attached to a spring that is then hung from a board, as shown in figure 18. As the spring oscillates up and down, the position y of the weight relative to the board ranges from −1 in. (at time x = 0) to −7 in. (at time x = π) below the board. Assume the position of y is given as a sinusoidal function of x. Then find a cosine function that gives the position y in terms of x.
Answer
y = 3 cos(x) – 4
Helpful videos about this lesson.