Precalculus by Richard Wright
Precalculus by Richard Wright
Blessed are the pure in heart, for they will see God. Matthew 5:8 NIV
Summary: In this section, you will:
SDA NAD Content Standards (2018): PC.4.1, PC.5.3

Sandhill cranes are large birds native to North America that can be almost 4 feet high when they stand. They migrate between the southern United States and southern Canada, although they have occasionally been spotted in Great Britain and China. Pretend you are standing in your yard as a sandhill crane flies over. Trigonometric functions can be used to calculate the distance between you and the crane. This lesson is about sketching graphs of the other trigonometric functions.
The process for graphing the other trigonometric functions is almost the same as sketching the graph of sine or cosine like in lesson 4-06. There are two main differences: the shape of the graph and the period of tangent and cotangent.
There is no amplitude for tangent and cotangent, but there is still a vertical stretch that takes the place of amplitude.
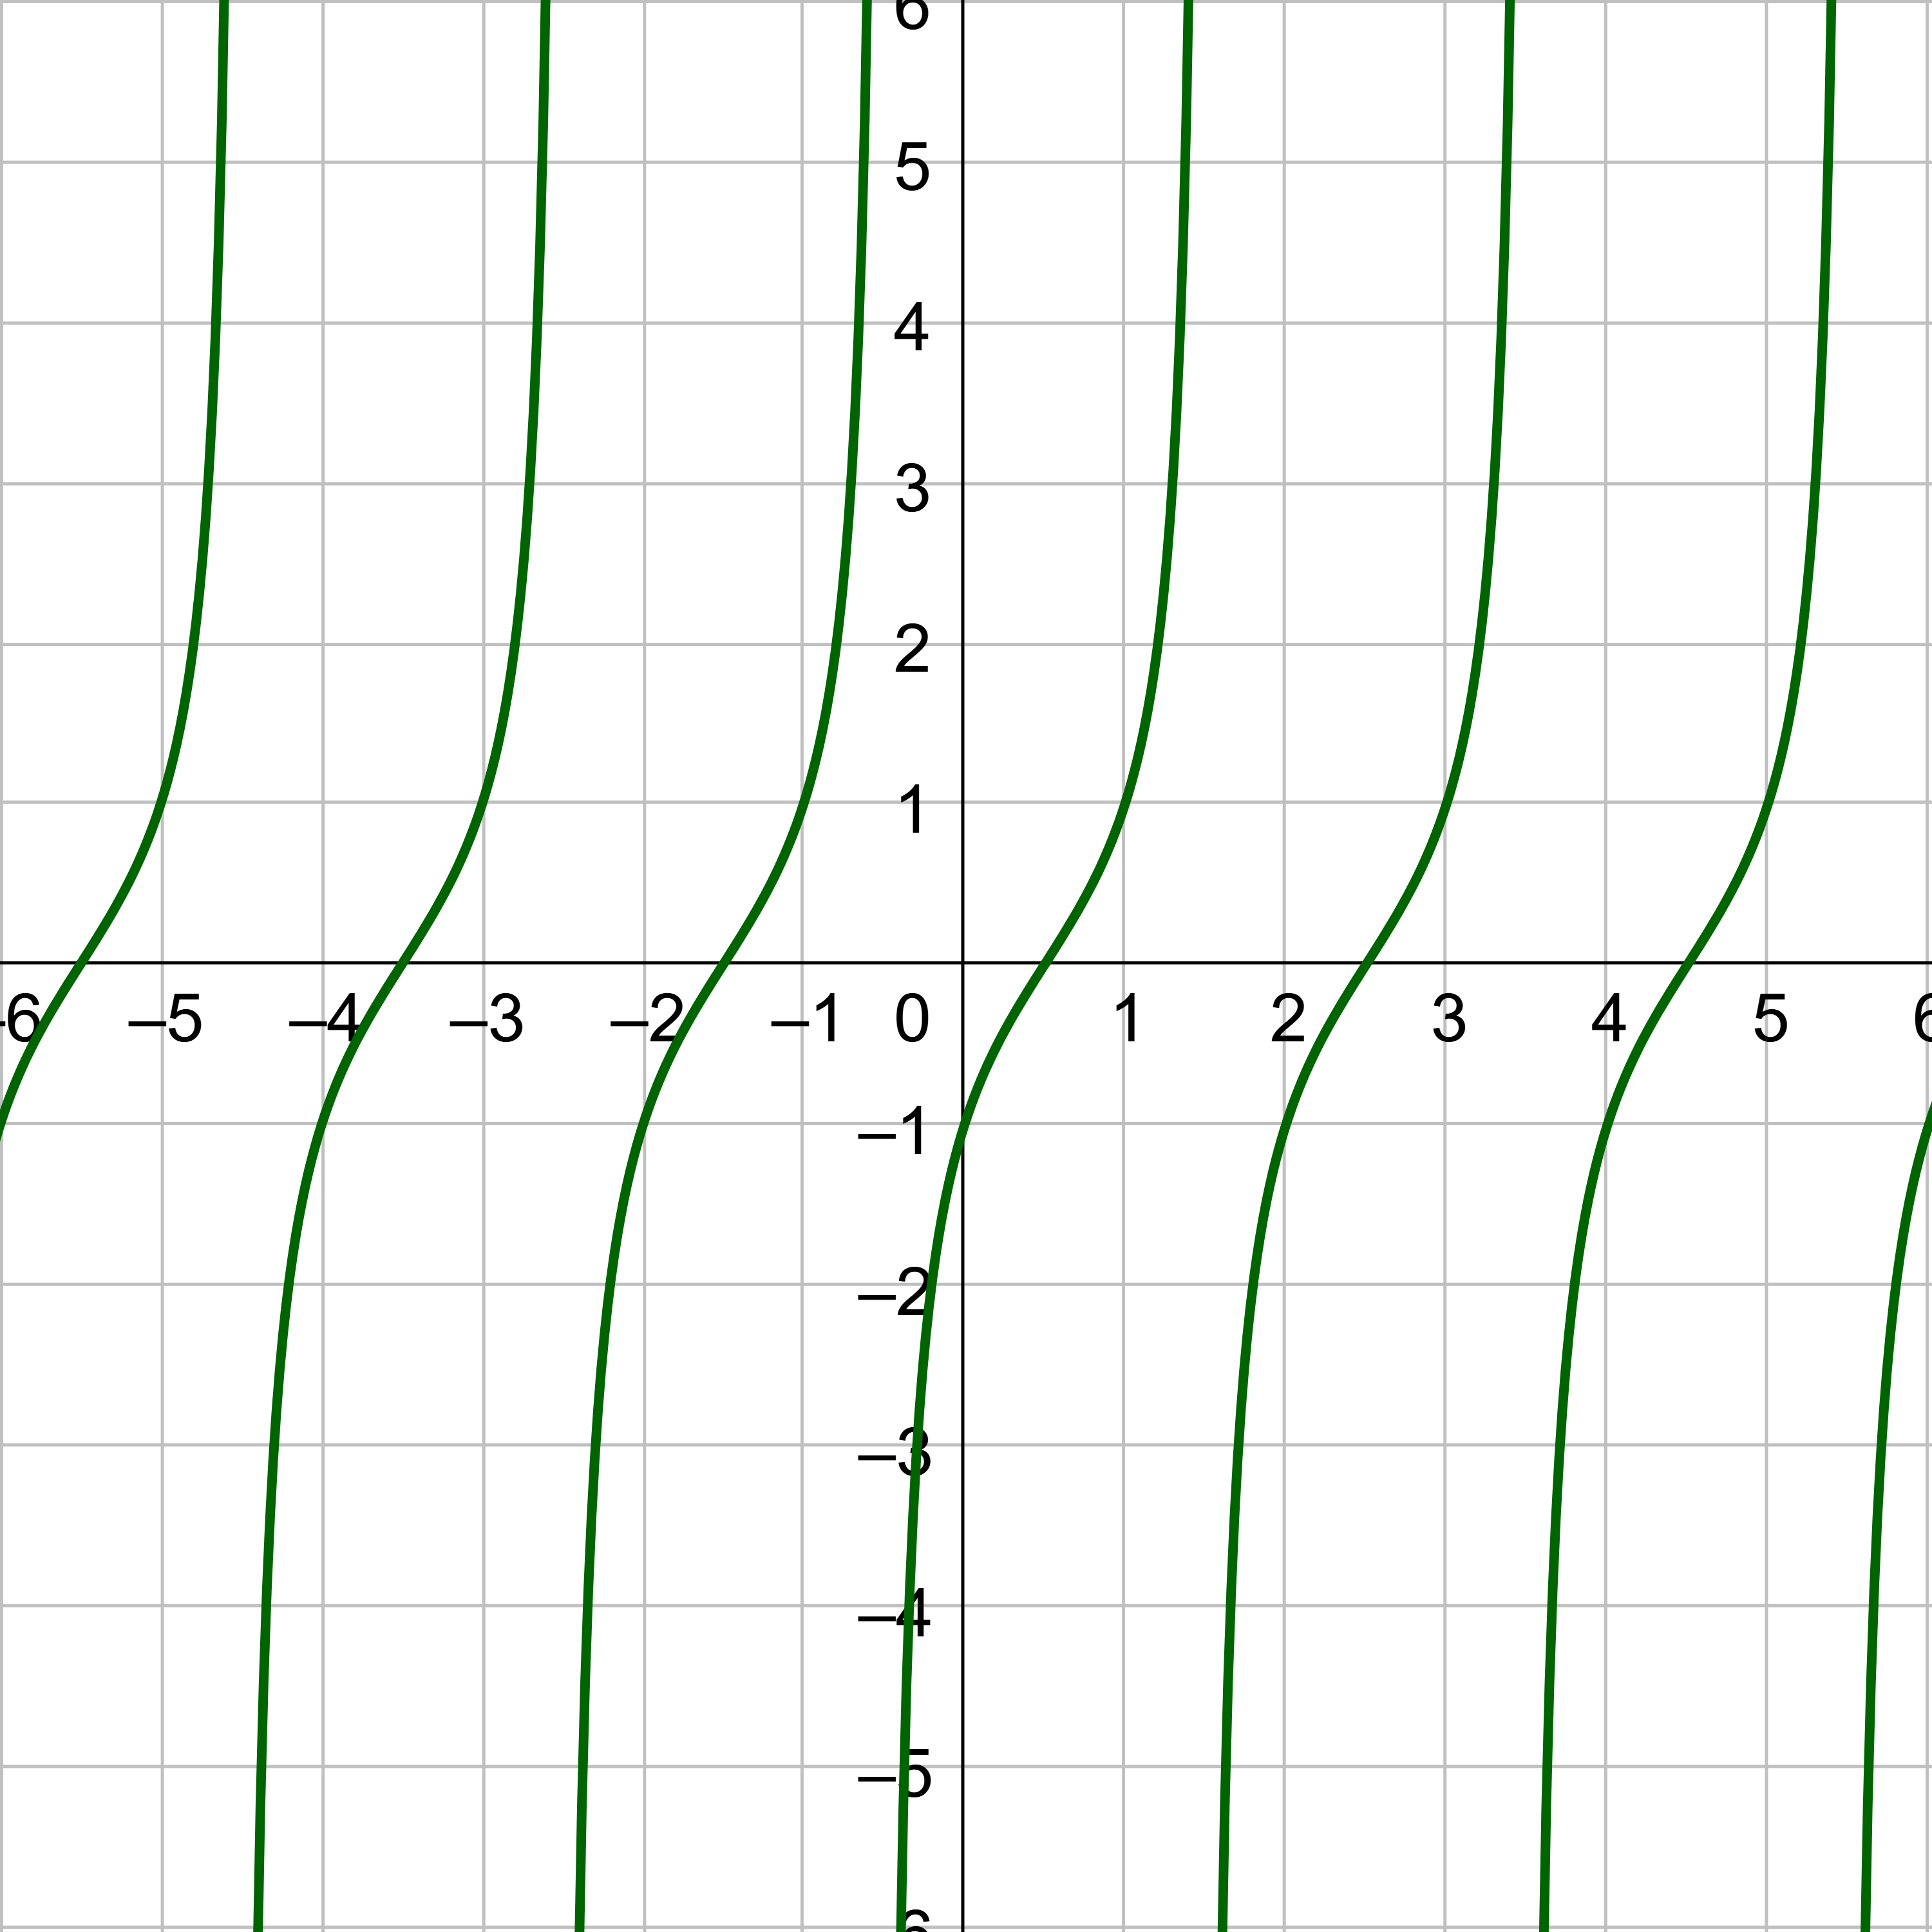
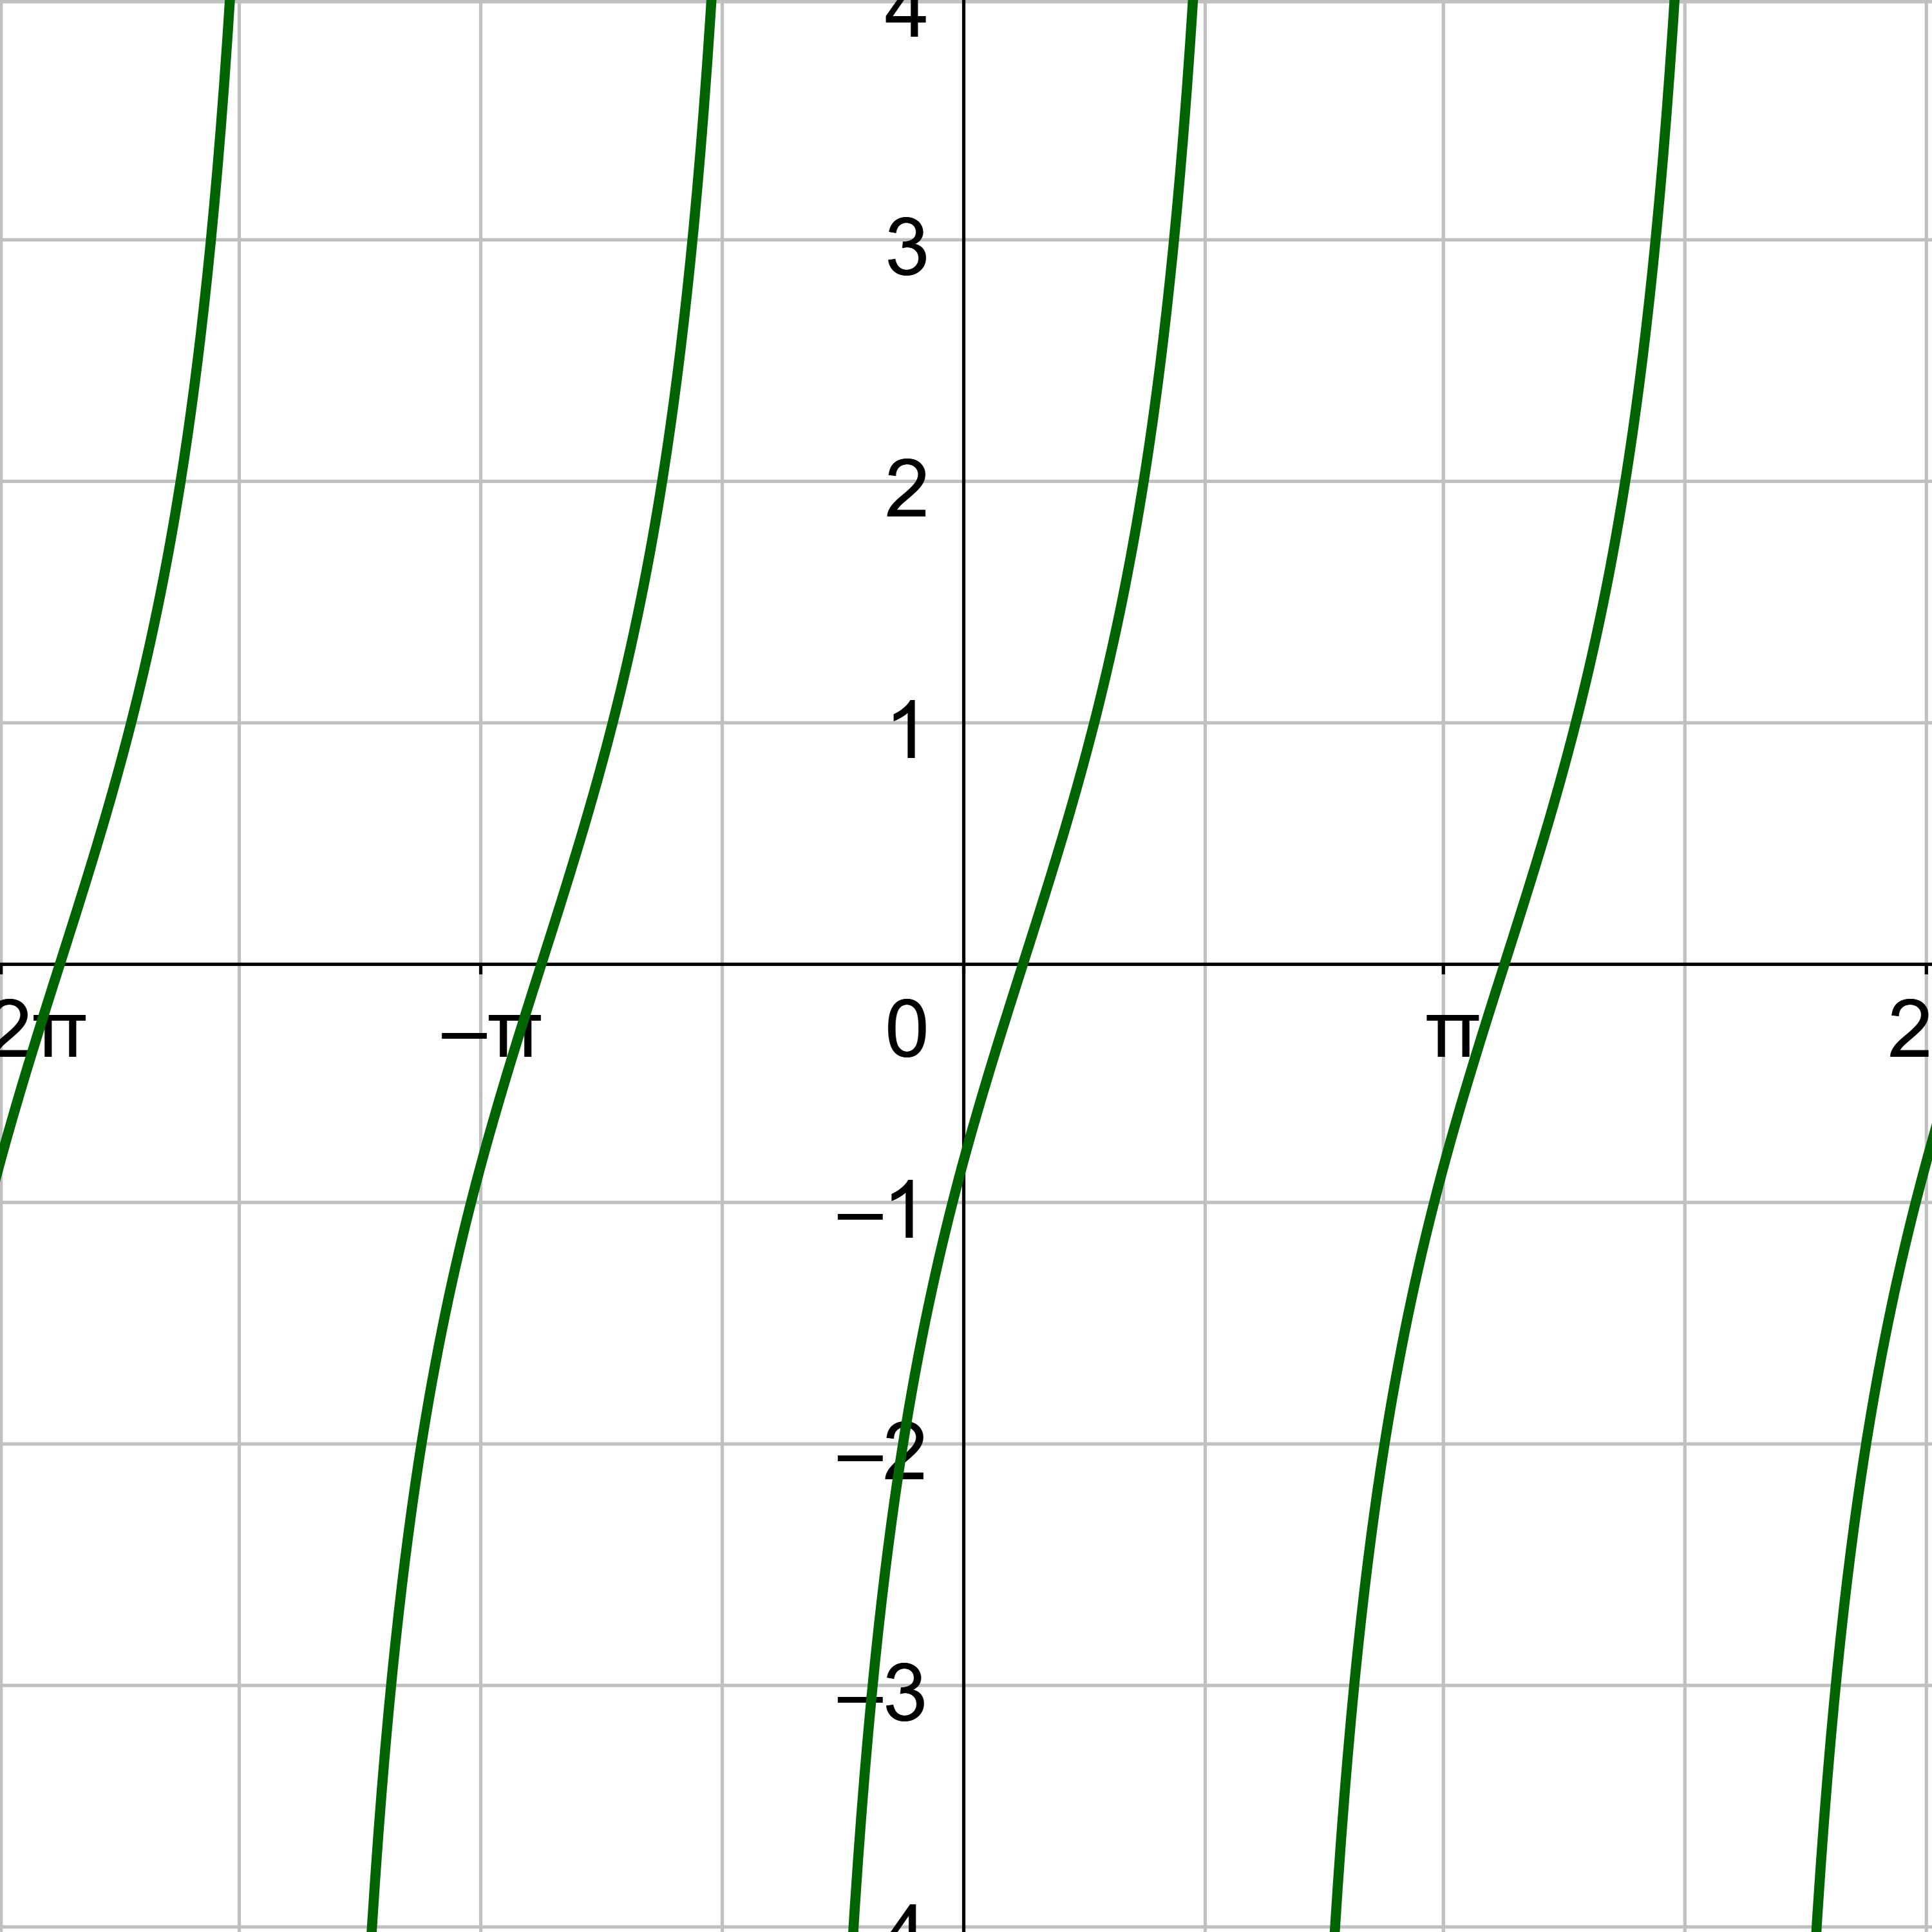
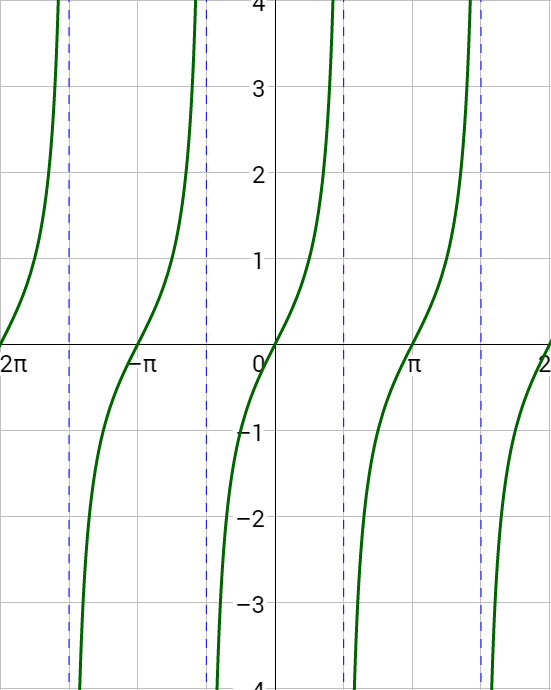
A graph of y = tan x is given in figure 2. Notice there are asymptotes for angles where tangent is undefined, such as \(x = –\frac{π}{2}\) and \(x = \frac{π}{2}\). Key points are \(\left(–\frac{π}{4}, –1\right)\), \(\left(0, 0\right)\), and \(\left(\frac{π}{4}, 1\right)\). The shape of the tangent graph repeats every π instead of the 2π of sine and cosine, so the period of tangent is π.
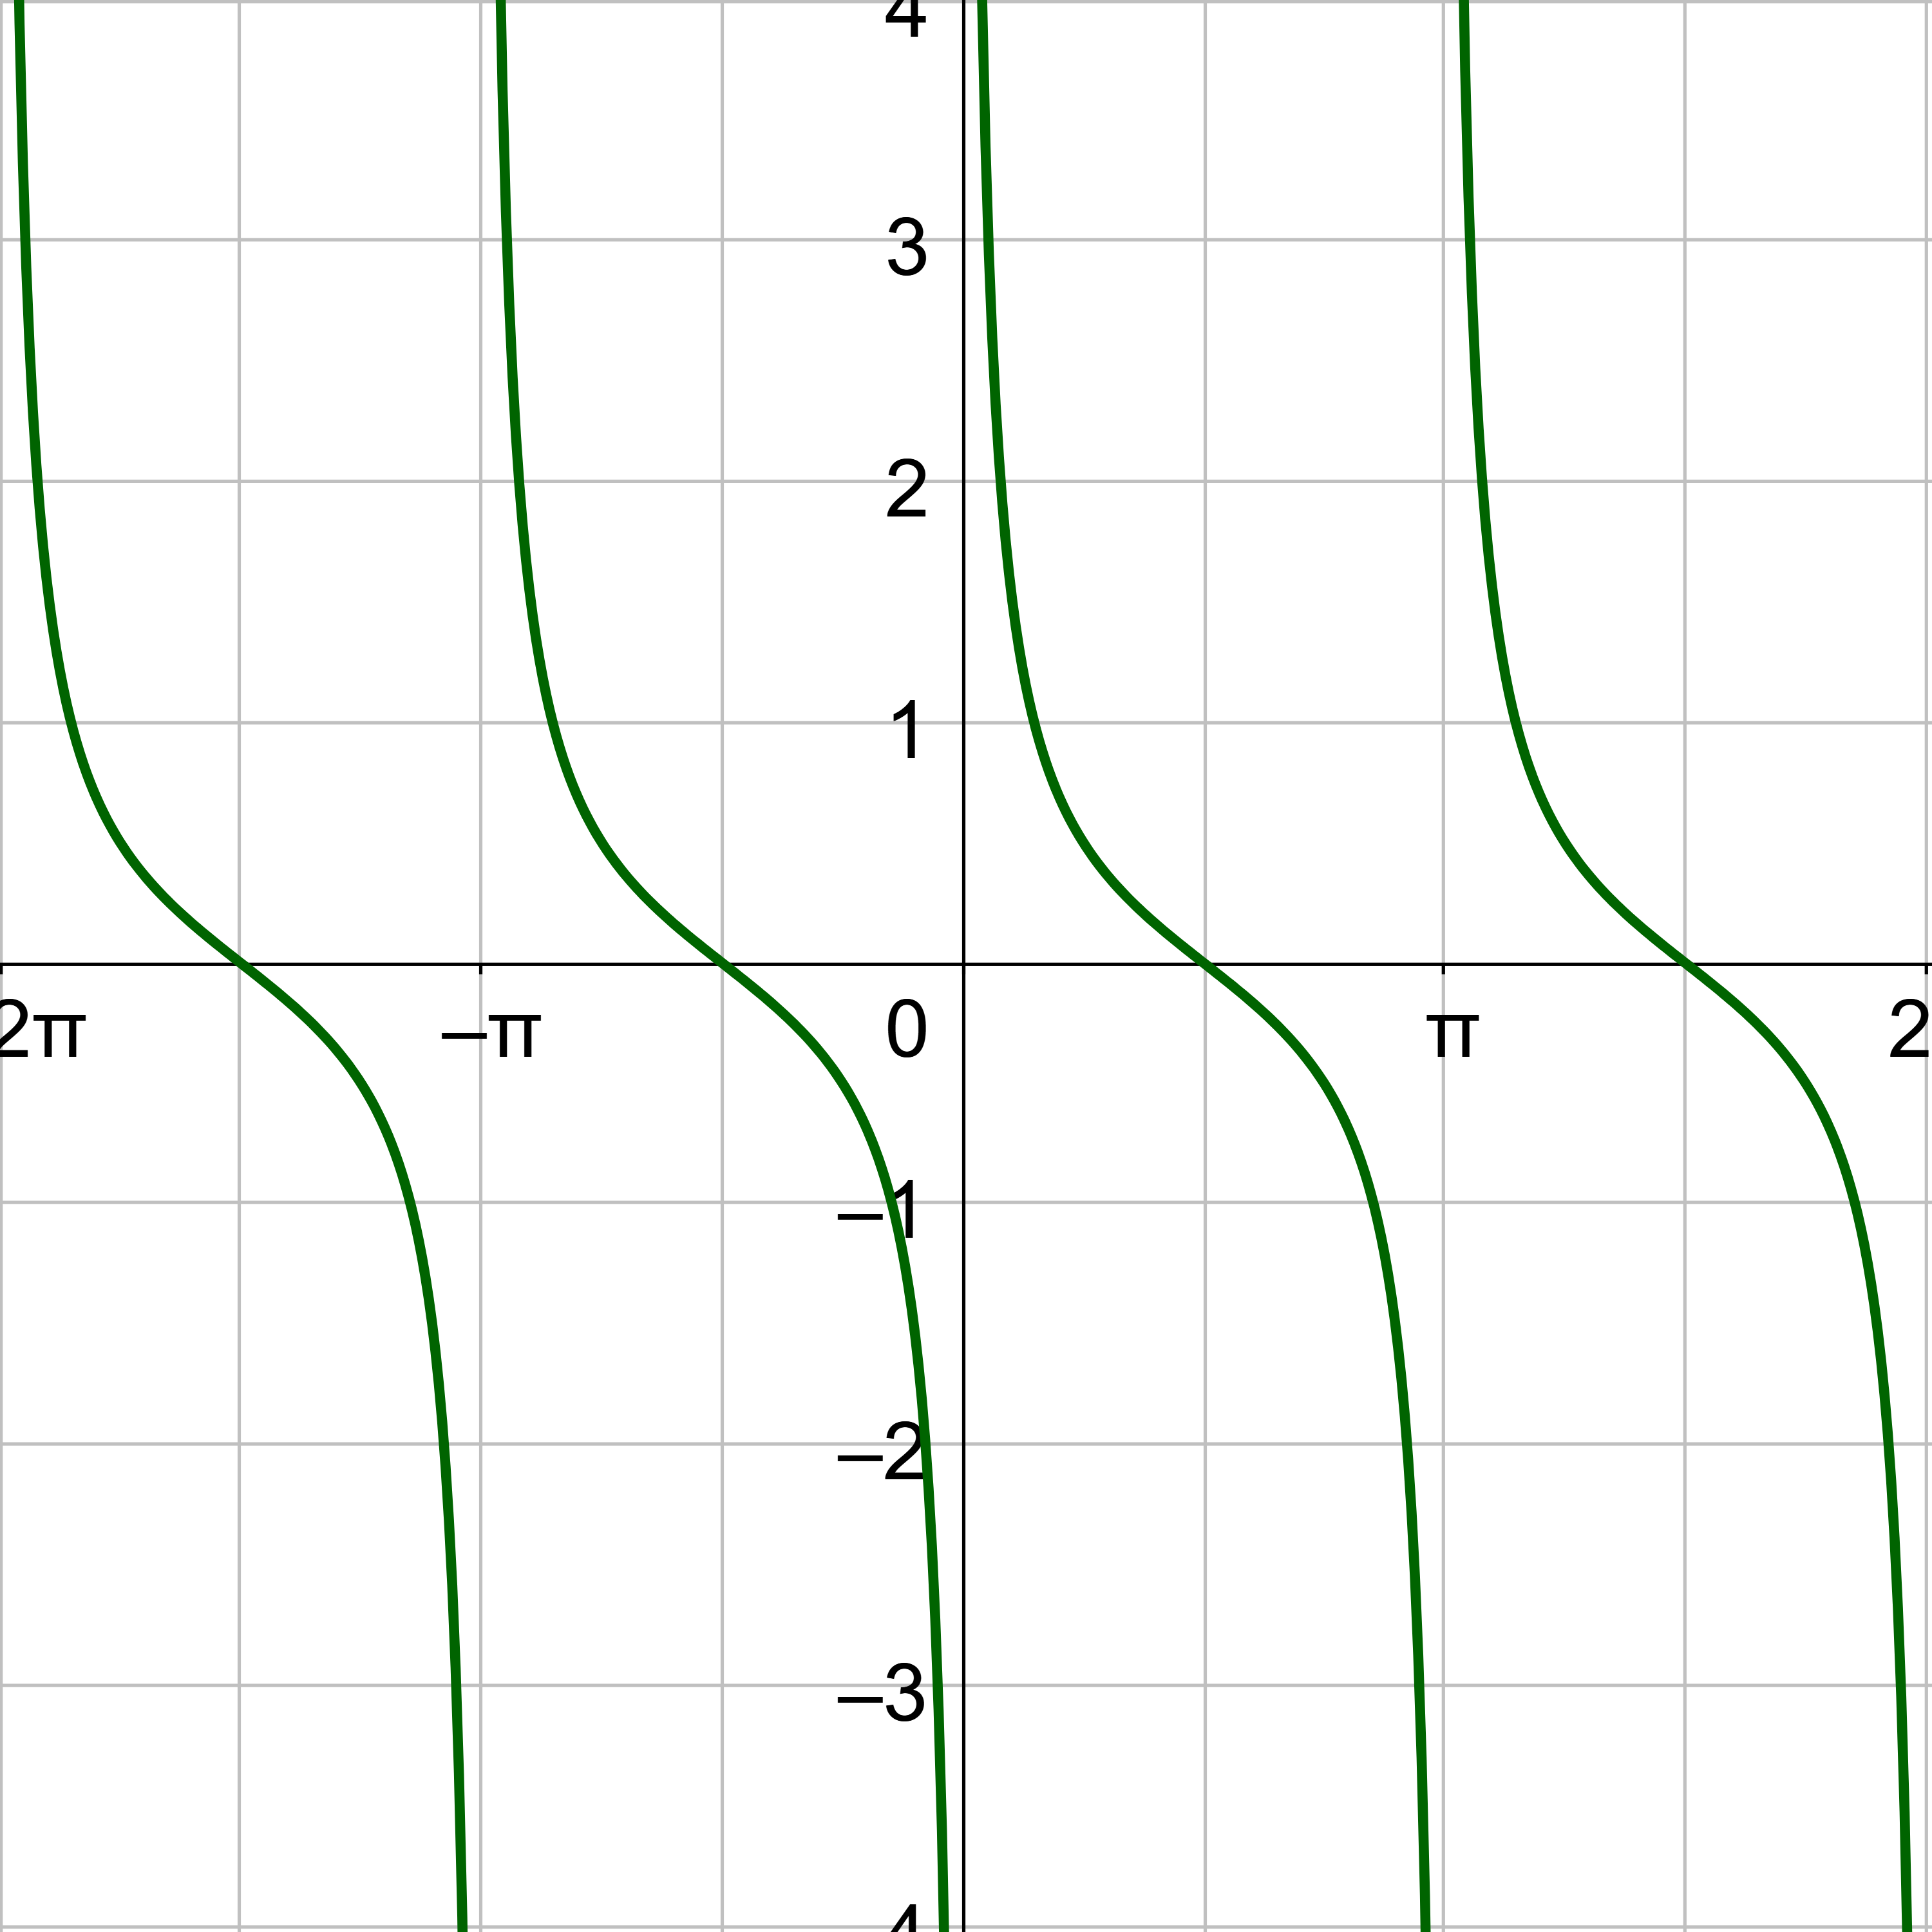
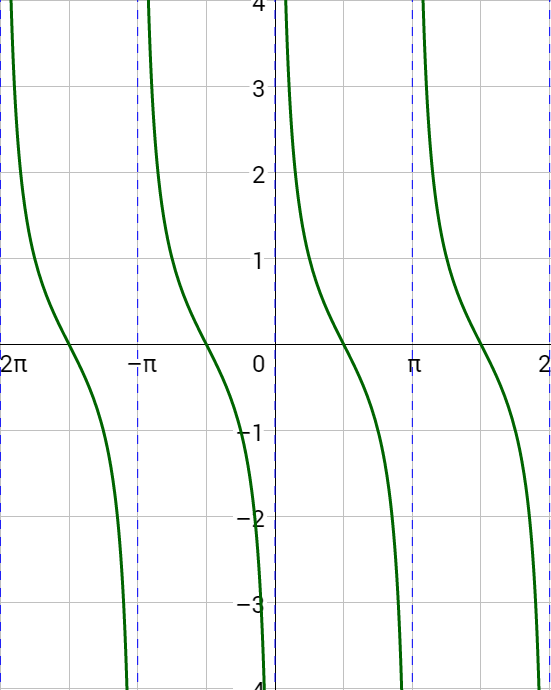
A graph of y = cot x is given in figure 3. Notice there are asymptotes for angles where cotangent is undefined, such as x = 0 and x = π. Key points are \(\left(\frac{π}{4}, 1\right)\), \(\left(\frac{π}{2}, 0\right)\), and \(\left(\frac{3π}{4}, –1\right)\). The shape of the cotangent graph repeats every π like tangent, so the period of cotangent is π.
Vertical Stretch = | a | (if a < 0, the graph is inverted.)
Period:
Phase Shift: (if c > 0, shifts right)
Midline: y = d
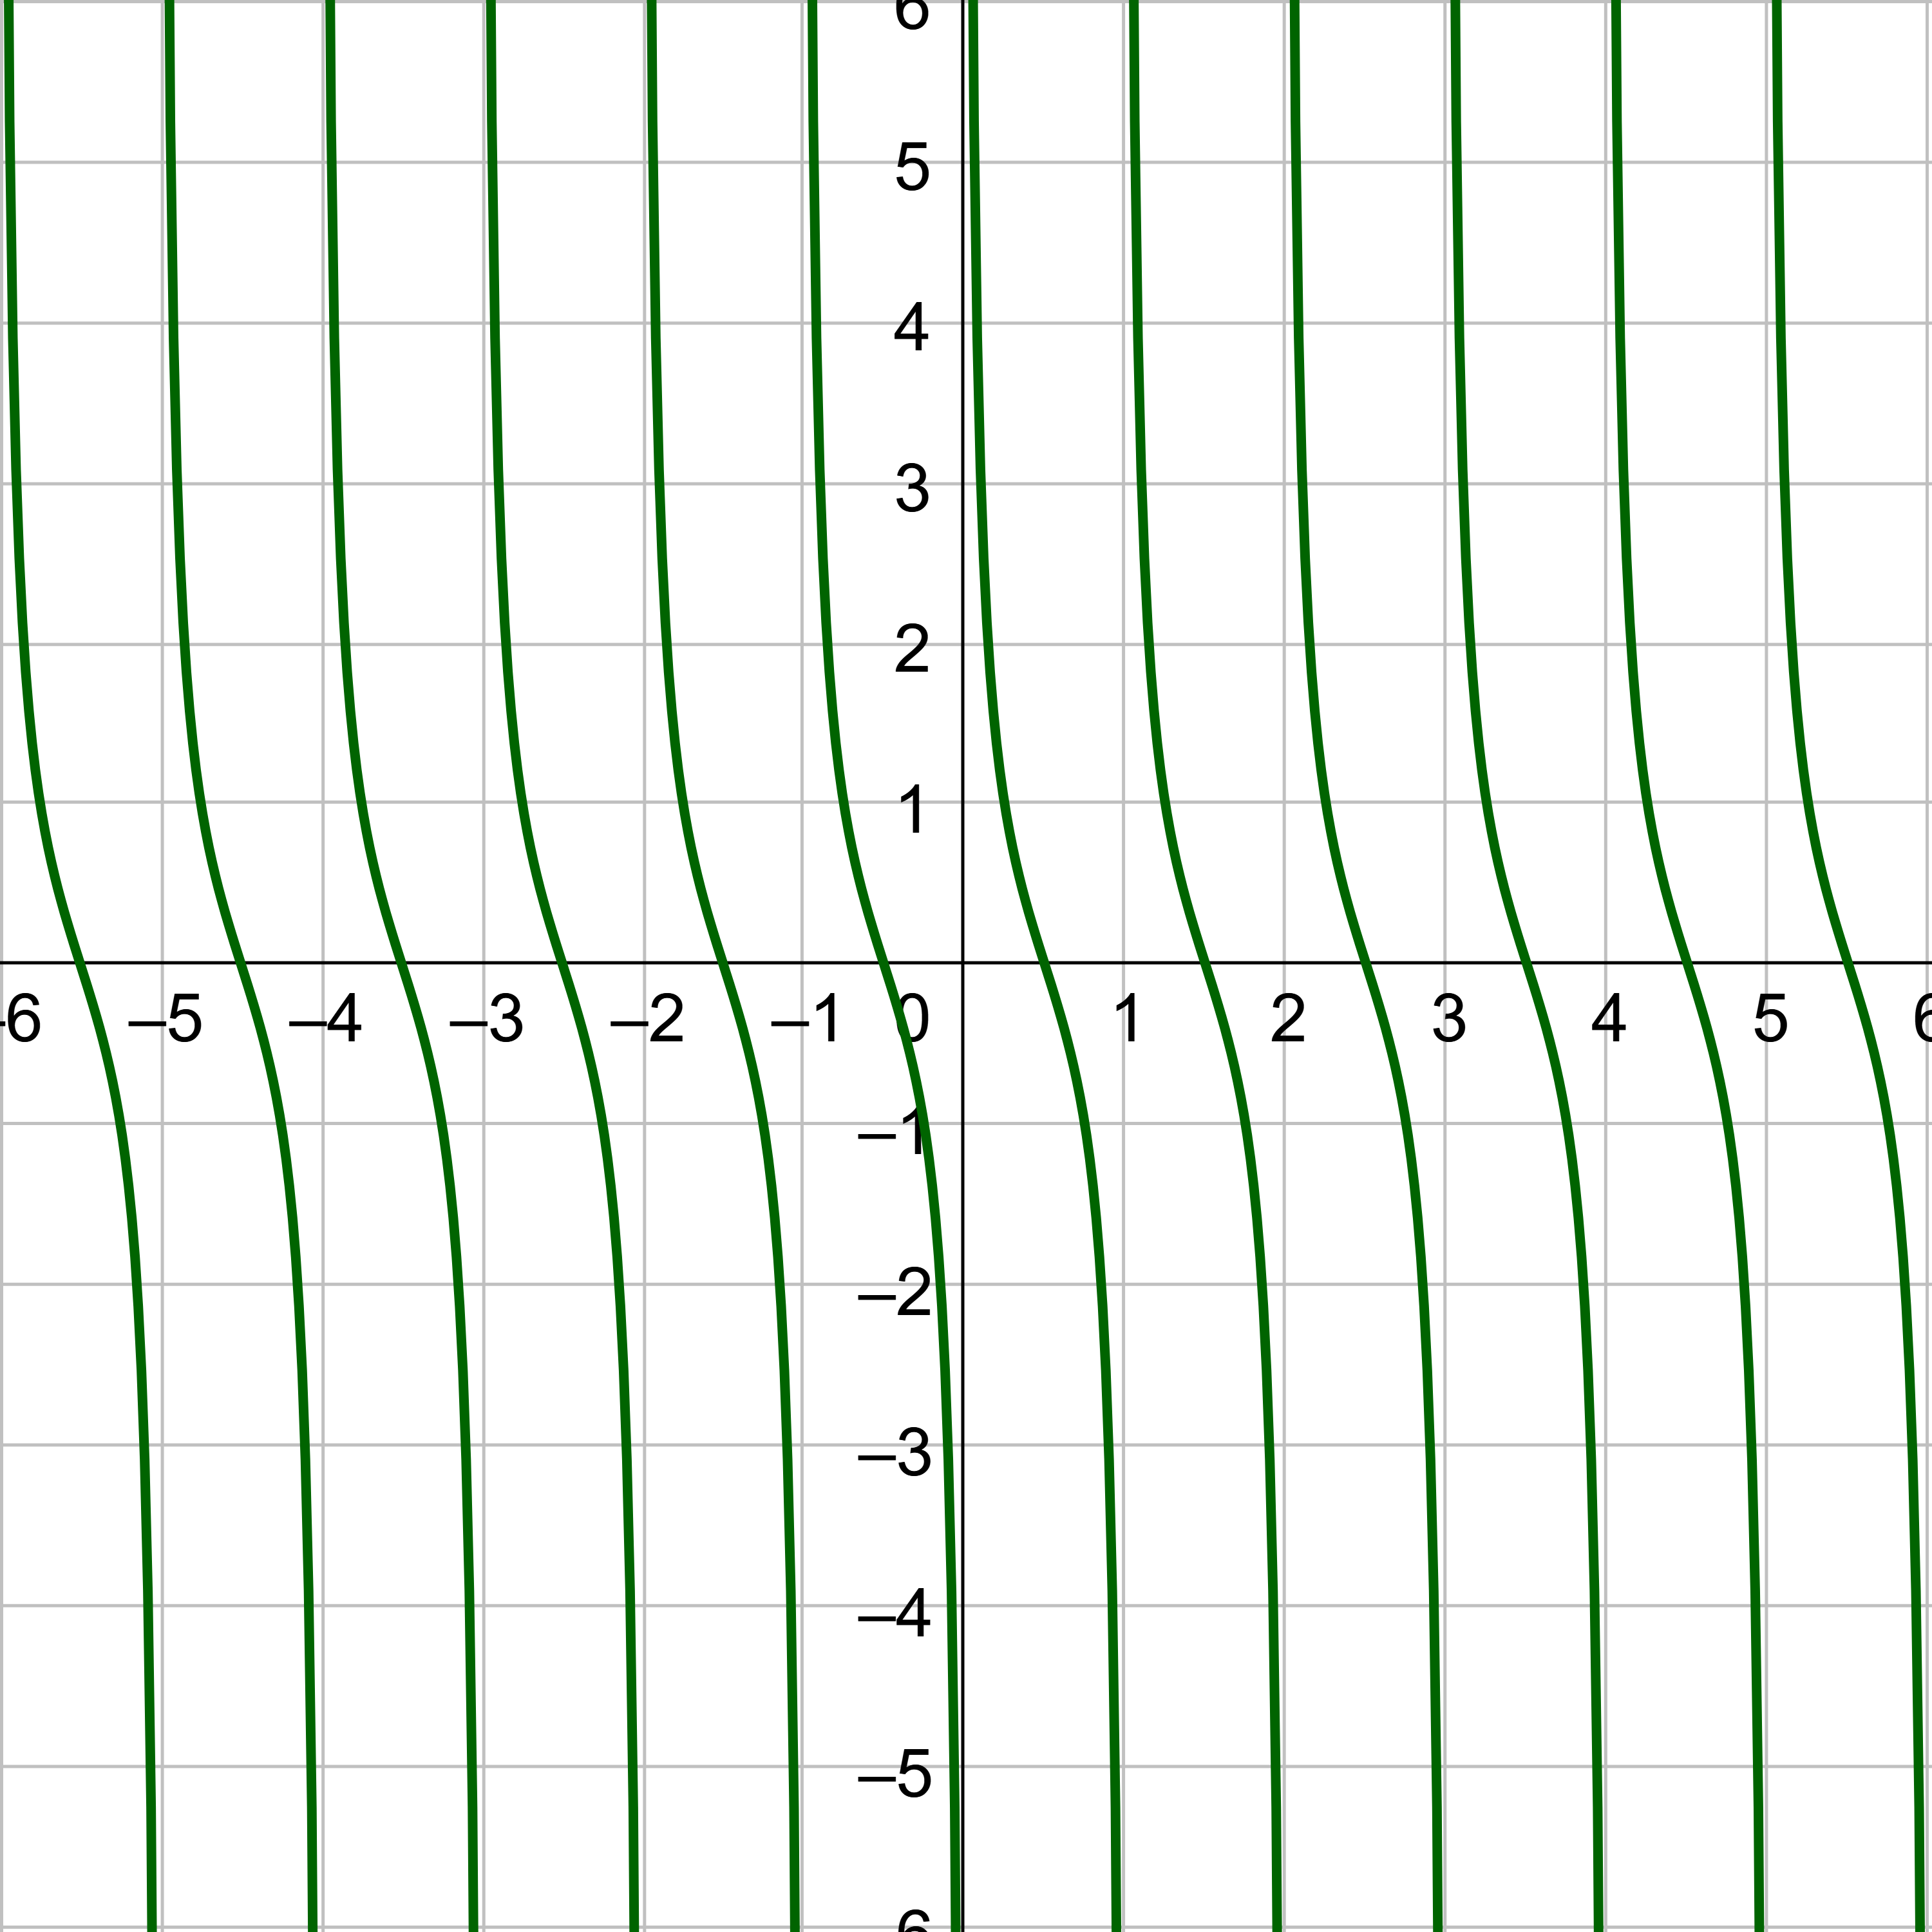
Sketch the graph of .
Solution
Compare to y = a tan(bx – c) + d.
a = 1
b = π
c =
d = 0
The midline is y = d, so y = 0. There is no vertical shift.
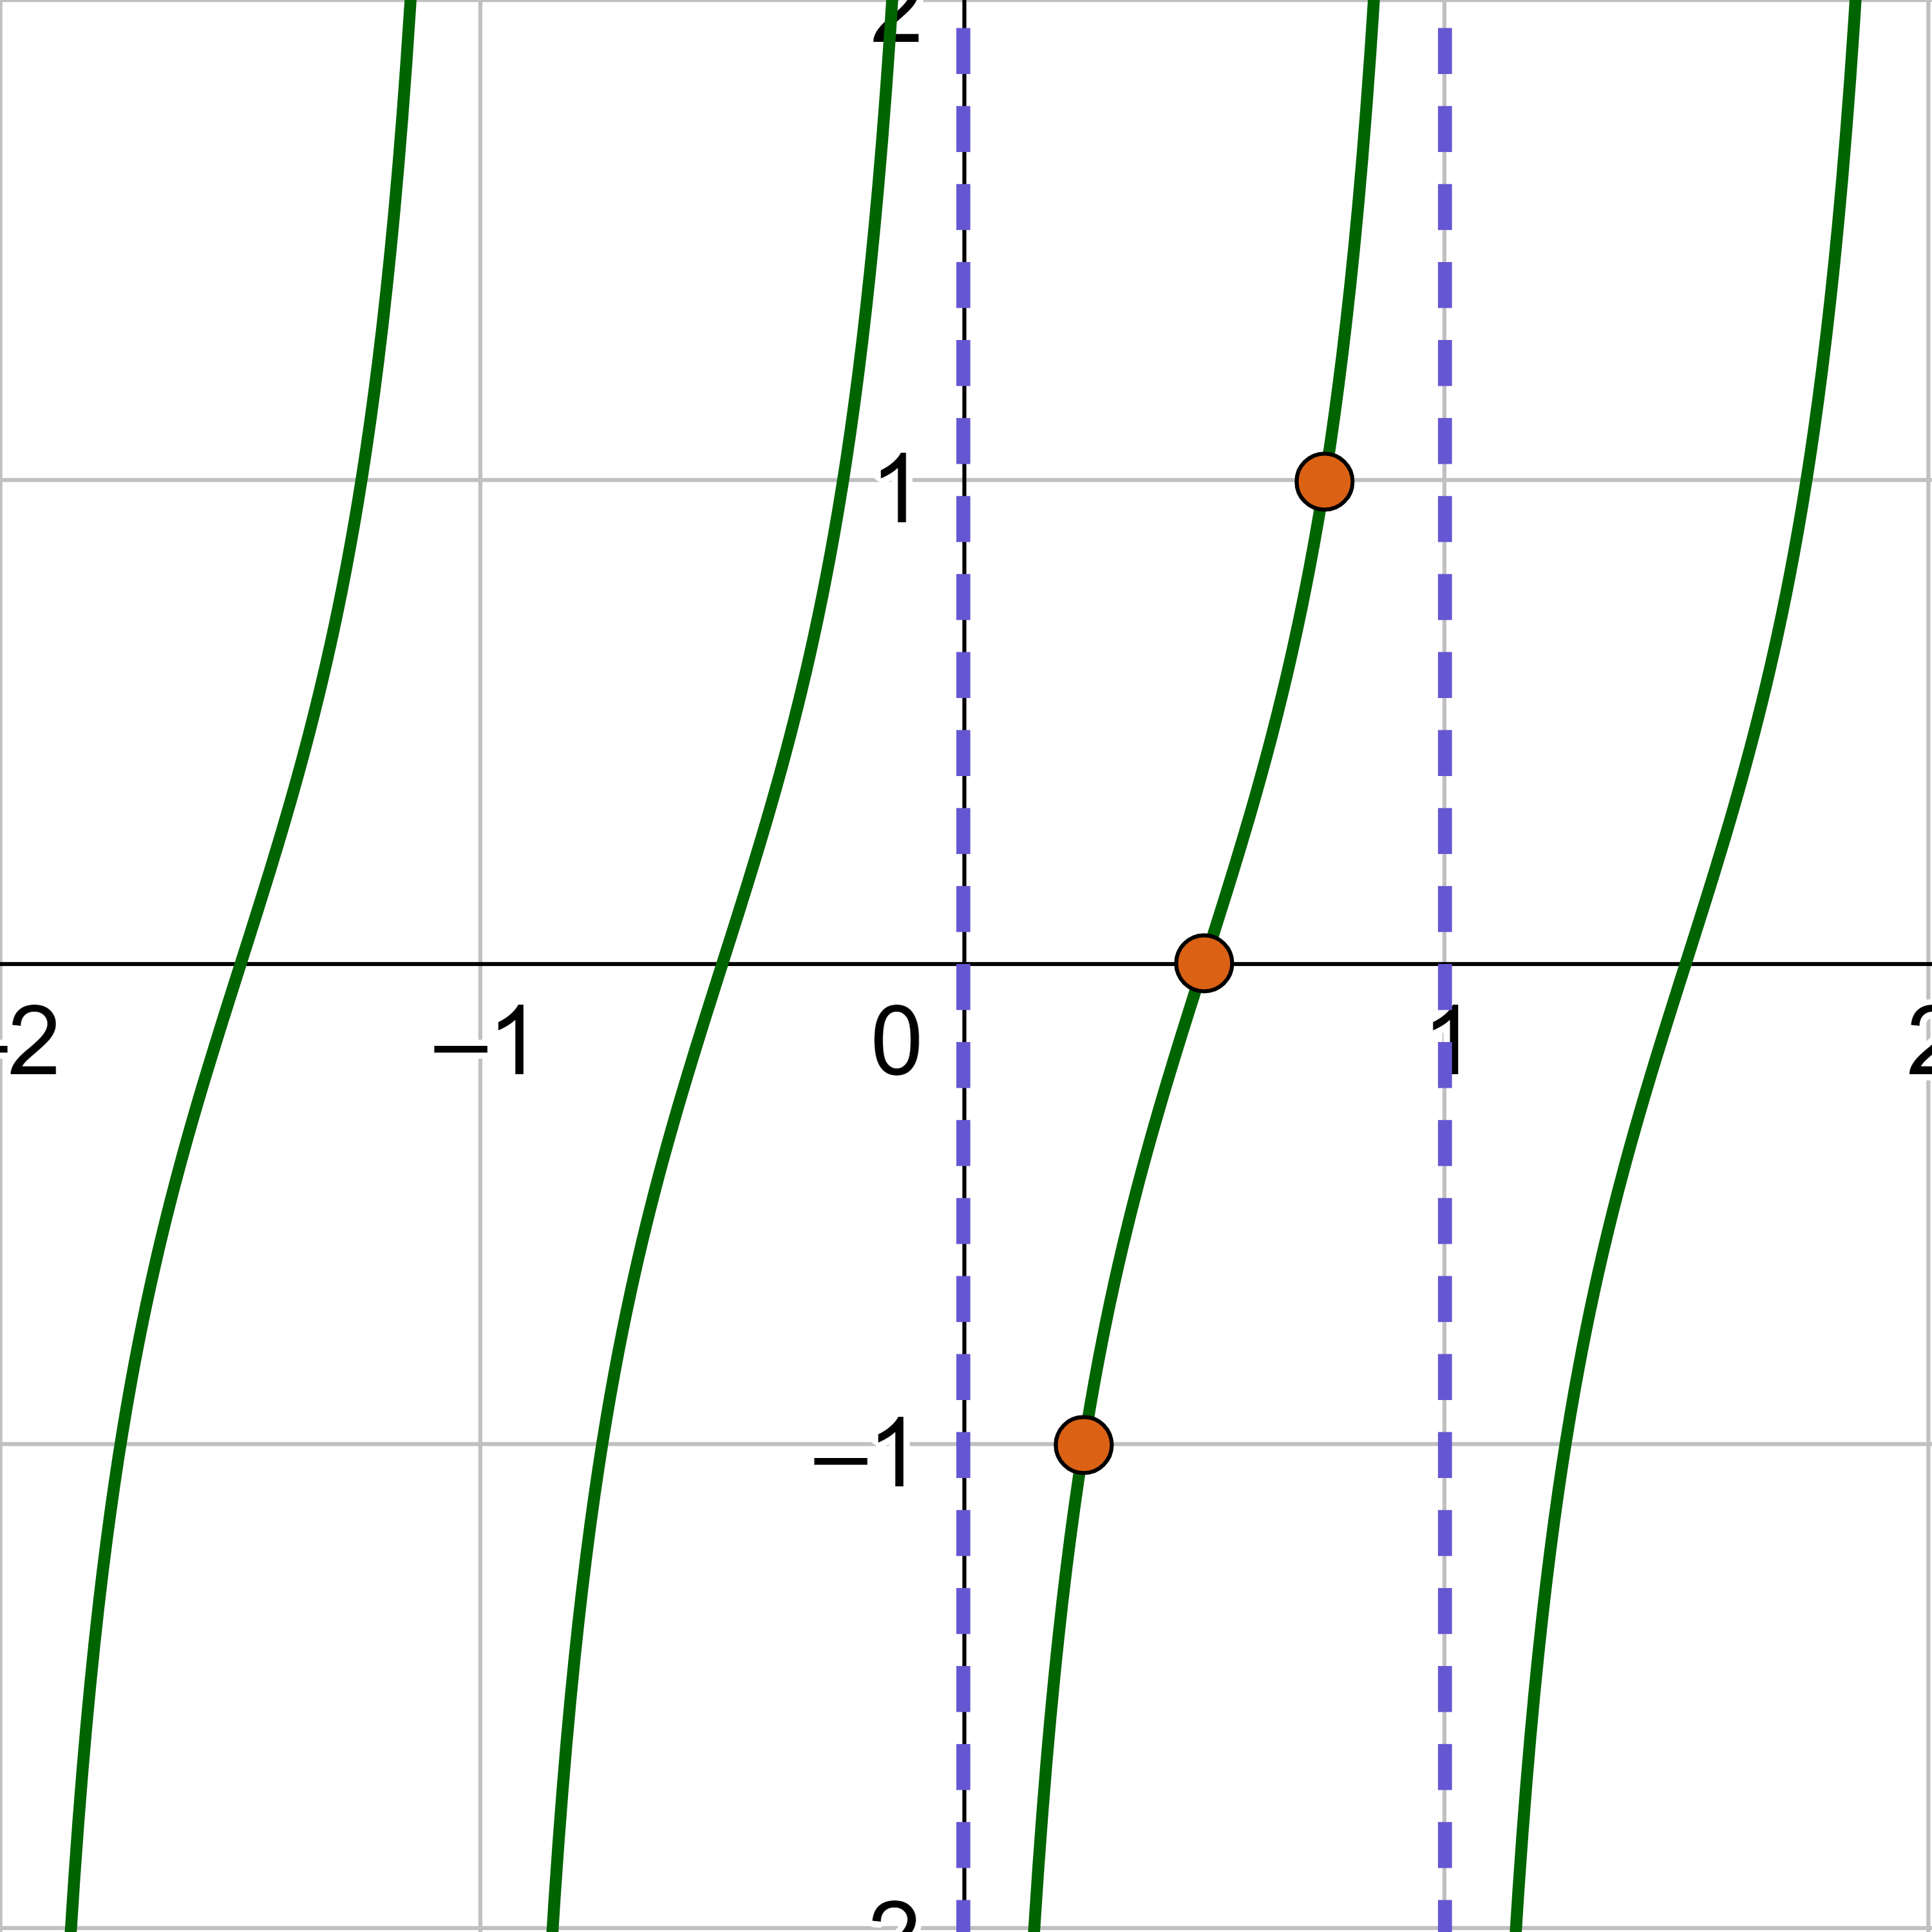
The vertical stretch is 1, so label the y-axis so the inflection point of the curve is 1 above the midline, 1, and the other inflection point is 1 below the midline, −1.
The period is
$$ T=\frac{π}{b} $$
$$ T=\frac{π}{π} $$
$$ T=1 $$
The phase shift is
$$ PS = \frac{c}{b} $$
$$ PS = \frac{\frac{π}{2}}{π} $$
$$ PS = \frac{1}{2} $$
The middle key point for tangent is at (0, 0), but it has shifted right \(\frac{1}{2}\), so it is \(\left(\frac{1}{2}, 0\right)\). The asymptotes are half a period on either side of the middle key point, x = 0 and x = 1. The left inflection point is halfway between the 1st asymptote and the middle key point with height of the vertical stretch below the midline, \(\left(\frac{1}{4}, -1\right)\). The other inflection point is halfway between the middle key point and right asymptote and the height of the vertical shift above the midline, \(\left(\frac{3}{4}, 1\right)\).
Sketch the tangent curve through the key points and continue the shape so it repeats at either end.
Sketch the graph of y = 2 cot(x) + 1.
Solution
Compare y = 2 cot(x) + 1 to y = a cot(bx – c) + d.
a = 2
b = 1
c = 0
d = 1
The midline is y = d, so y = 1. There is no vertical shift.
The vertical stretch is 2, so label the y-axis so the inflection point of the curve is 2 above the midline, 3, and the other inflection point is 2 below the midline, −1.
The period is
$$ T=\frac{π}{b} $$
$$ T=\frac{π}{1} $$
$$ T=π $$
The phase shift is
$$ PS = \frac{c}{b} $$
$$ PS = \frac{0}{1} $$
$$ PS = 0 $$
The left asymptote is at the origin, but shifted the phase shift, x = 0. The other asymptote is the period to the right, x = π. The middle key point for cotangent is halfway between the asymptotes on the midline, \(\left(\frac{π}{2}, 0\right)\). The left inflection point is halfway between the 1st asymptote and the middle key point with height of the vertical stretch above the midline, \(\left(\frac{π}{2}, 3\right)\). The other inflection point is halfway between the middle key point and right asymptote and the height of the vertical shift below the midline, \(\left(\frac{3π}{2}, -1\right)\).
Sketch the cotangent curve through the key points and continue the shape so it repeats at either end.

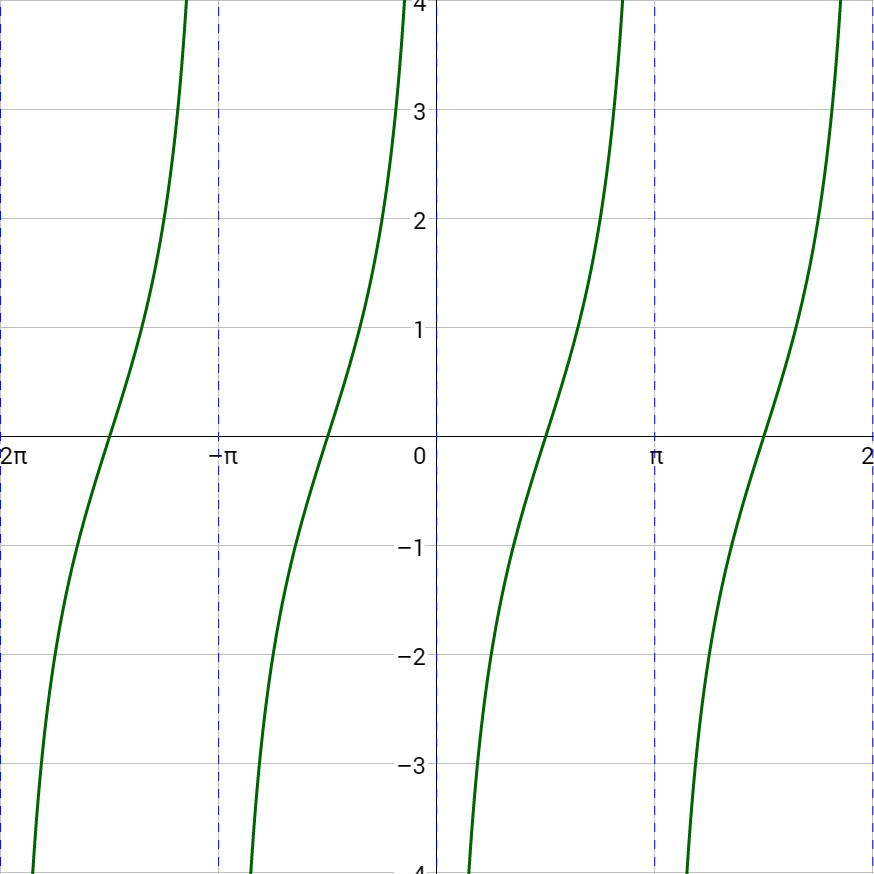
Sketch a graph of \(y = 2 \tan{\left(x - \frac{π}{2}\right)}\).
Answer
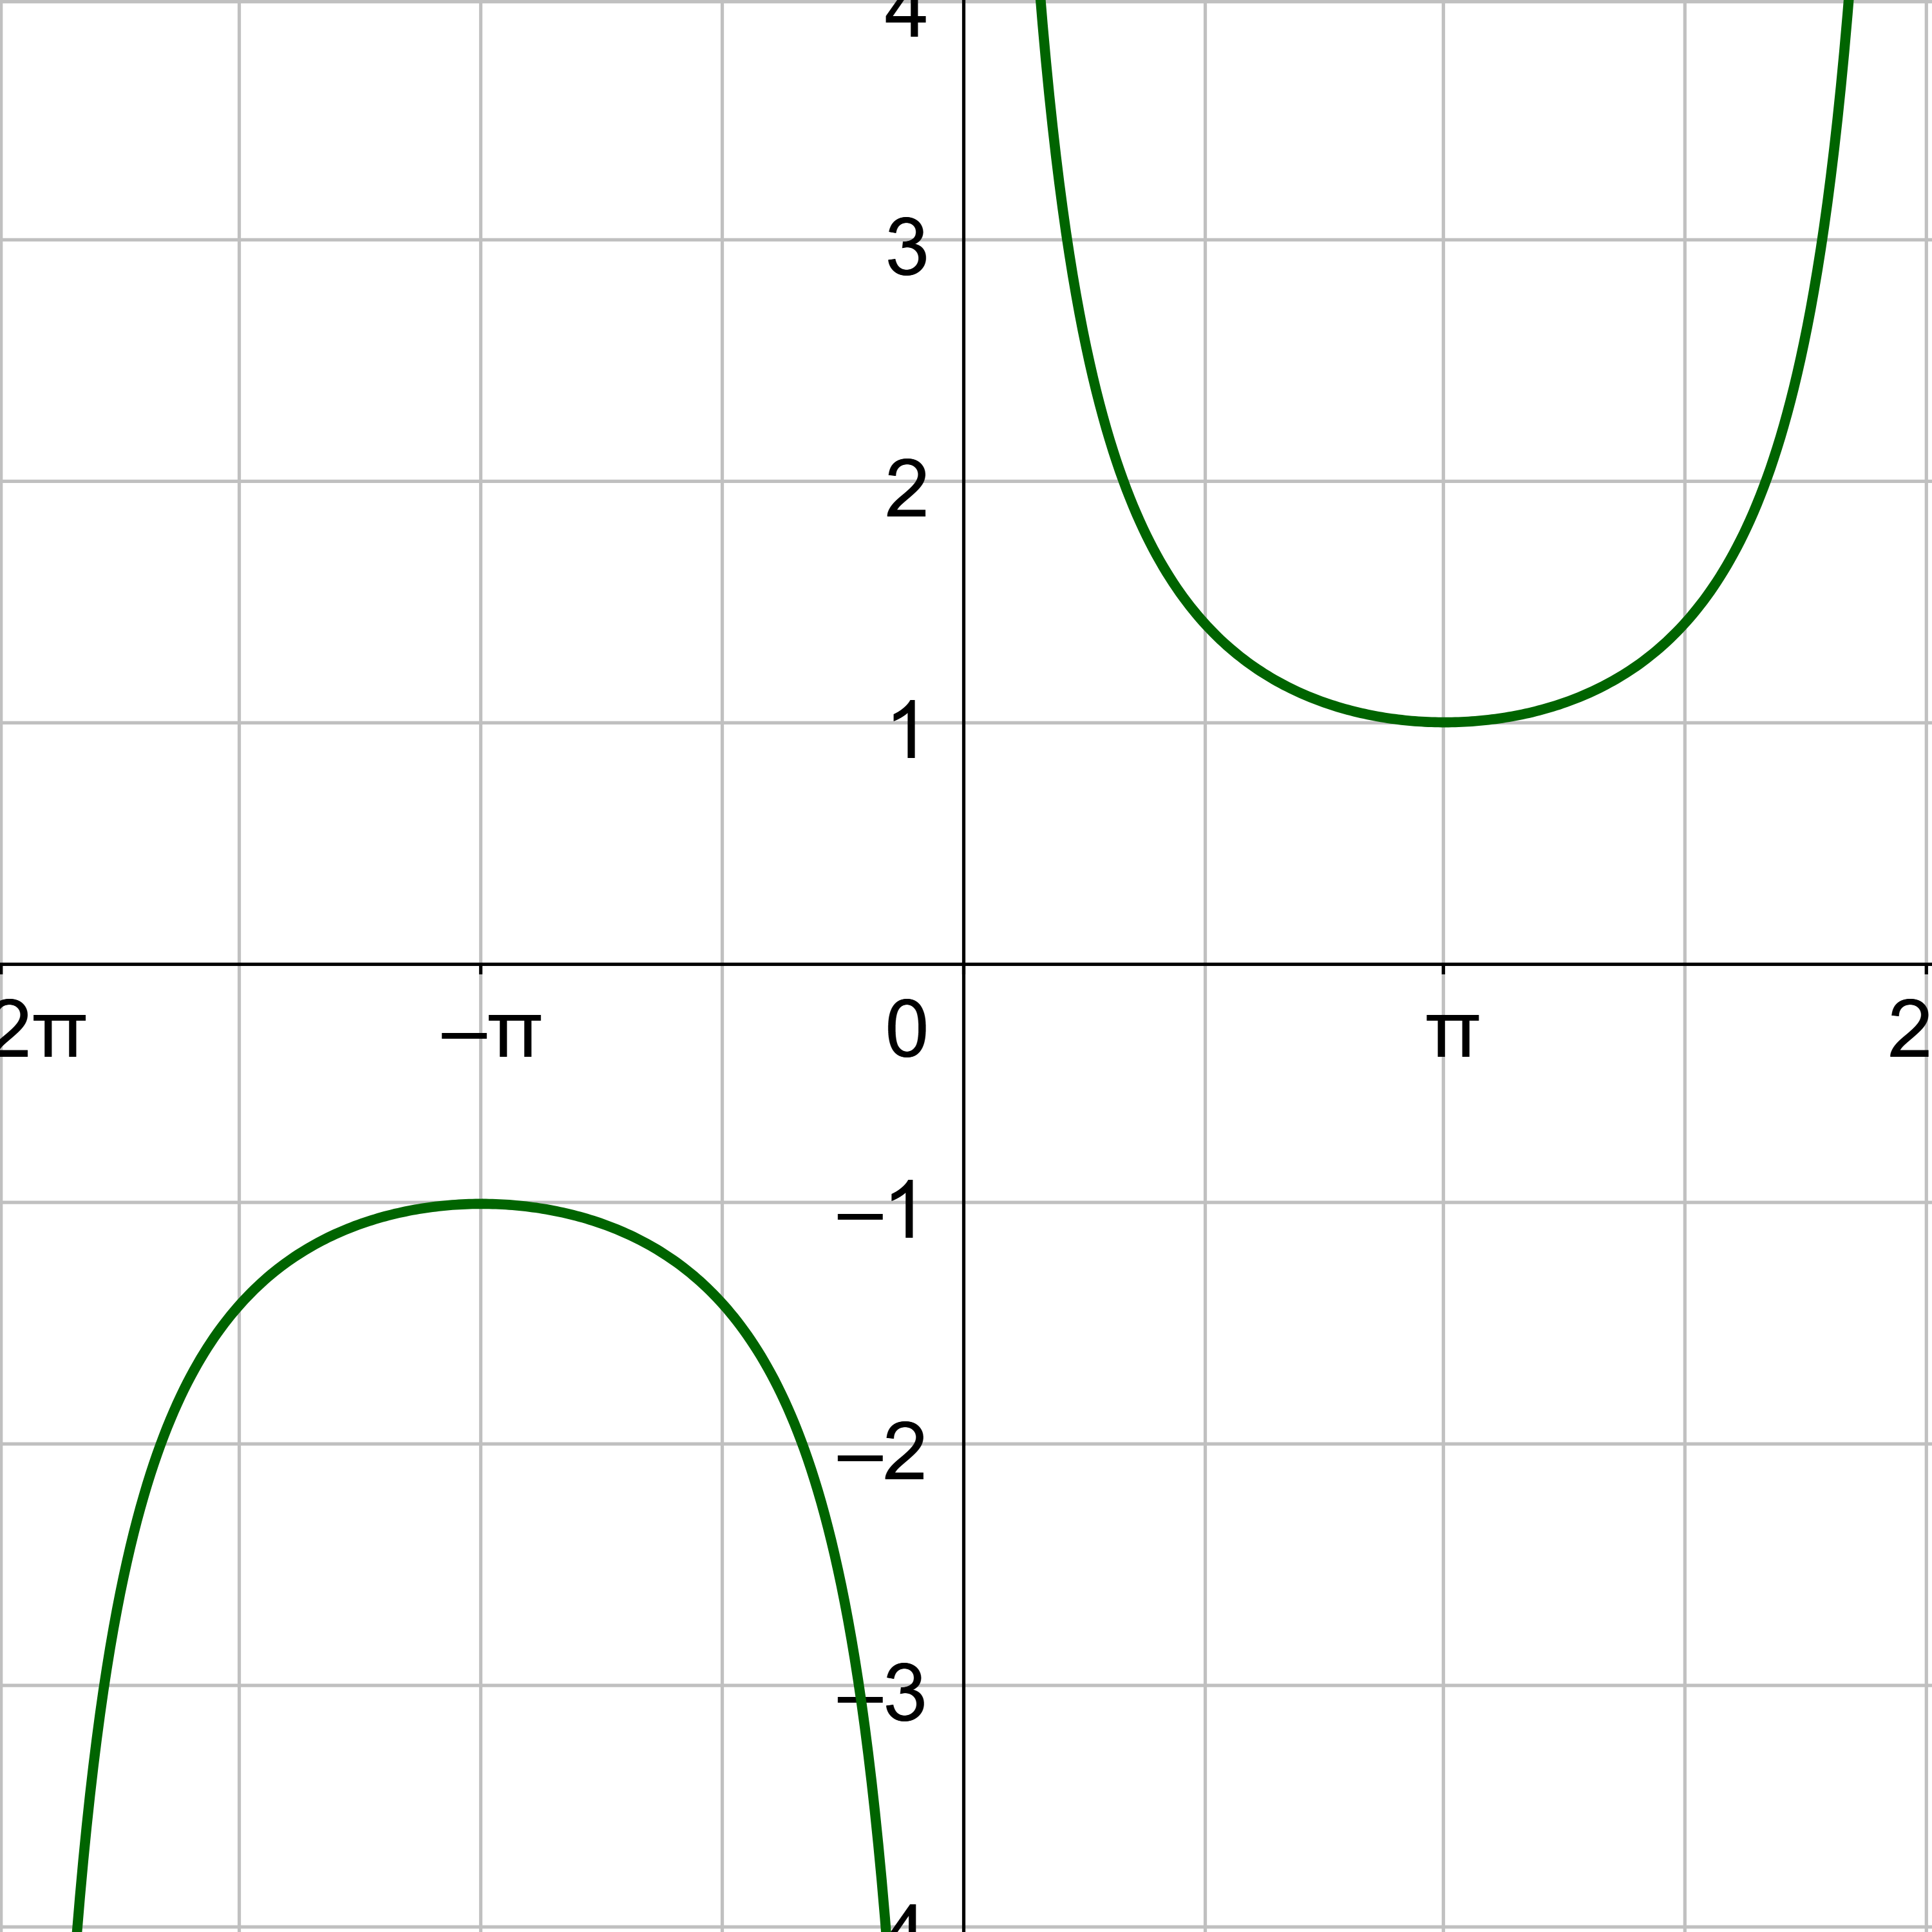
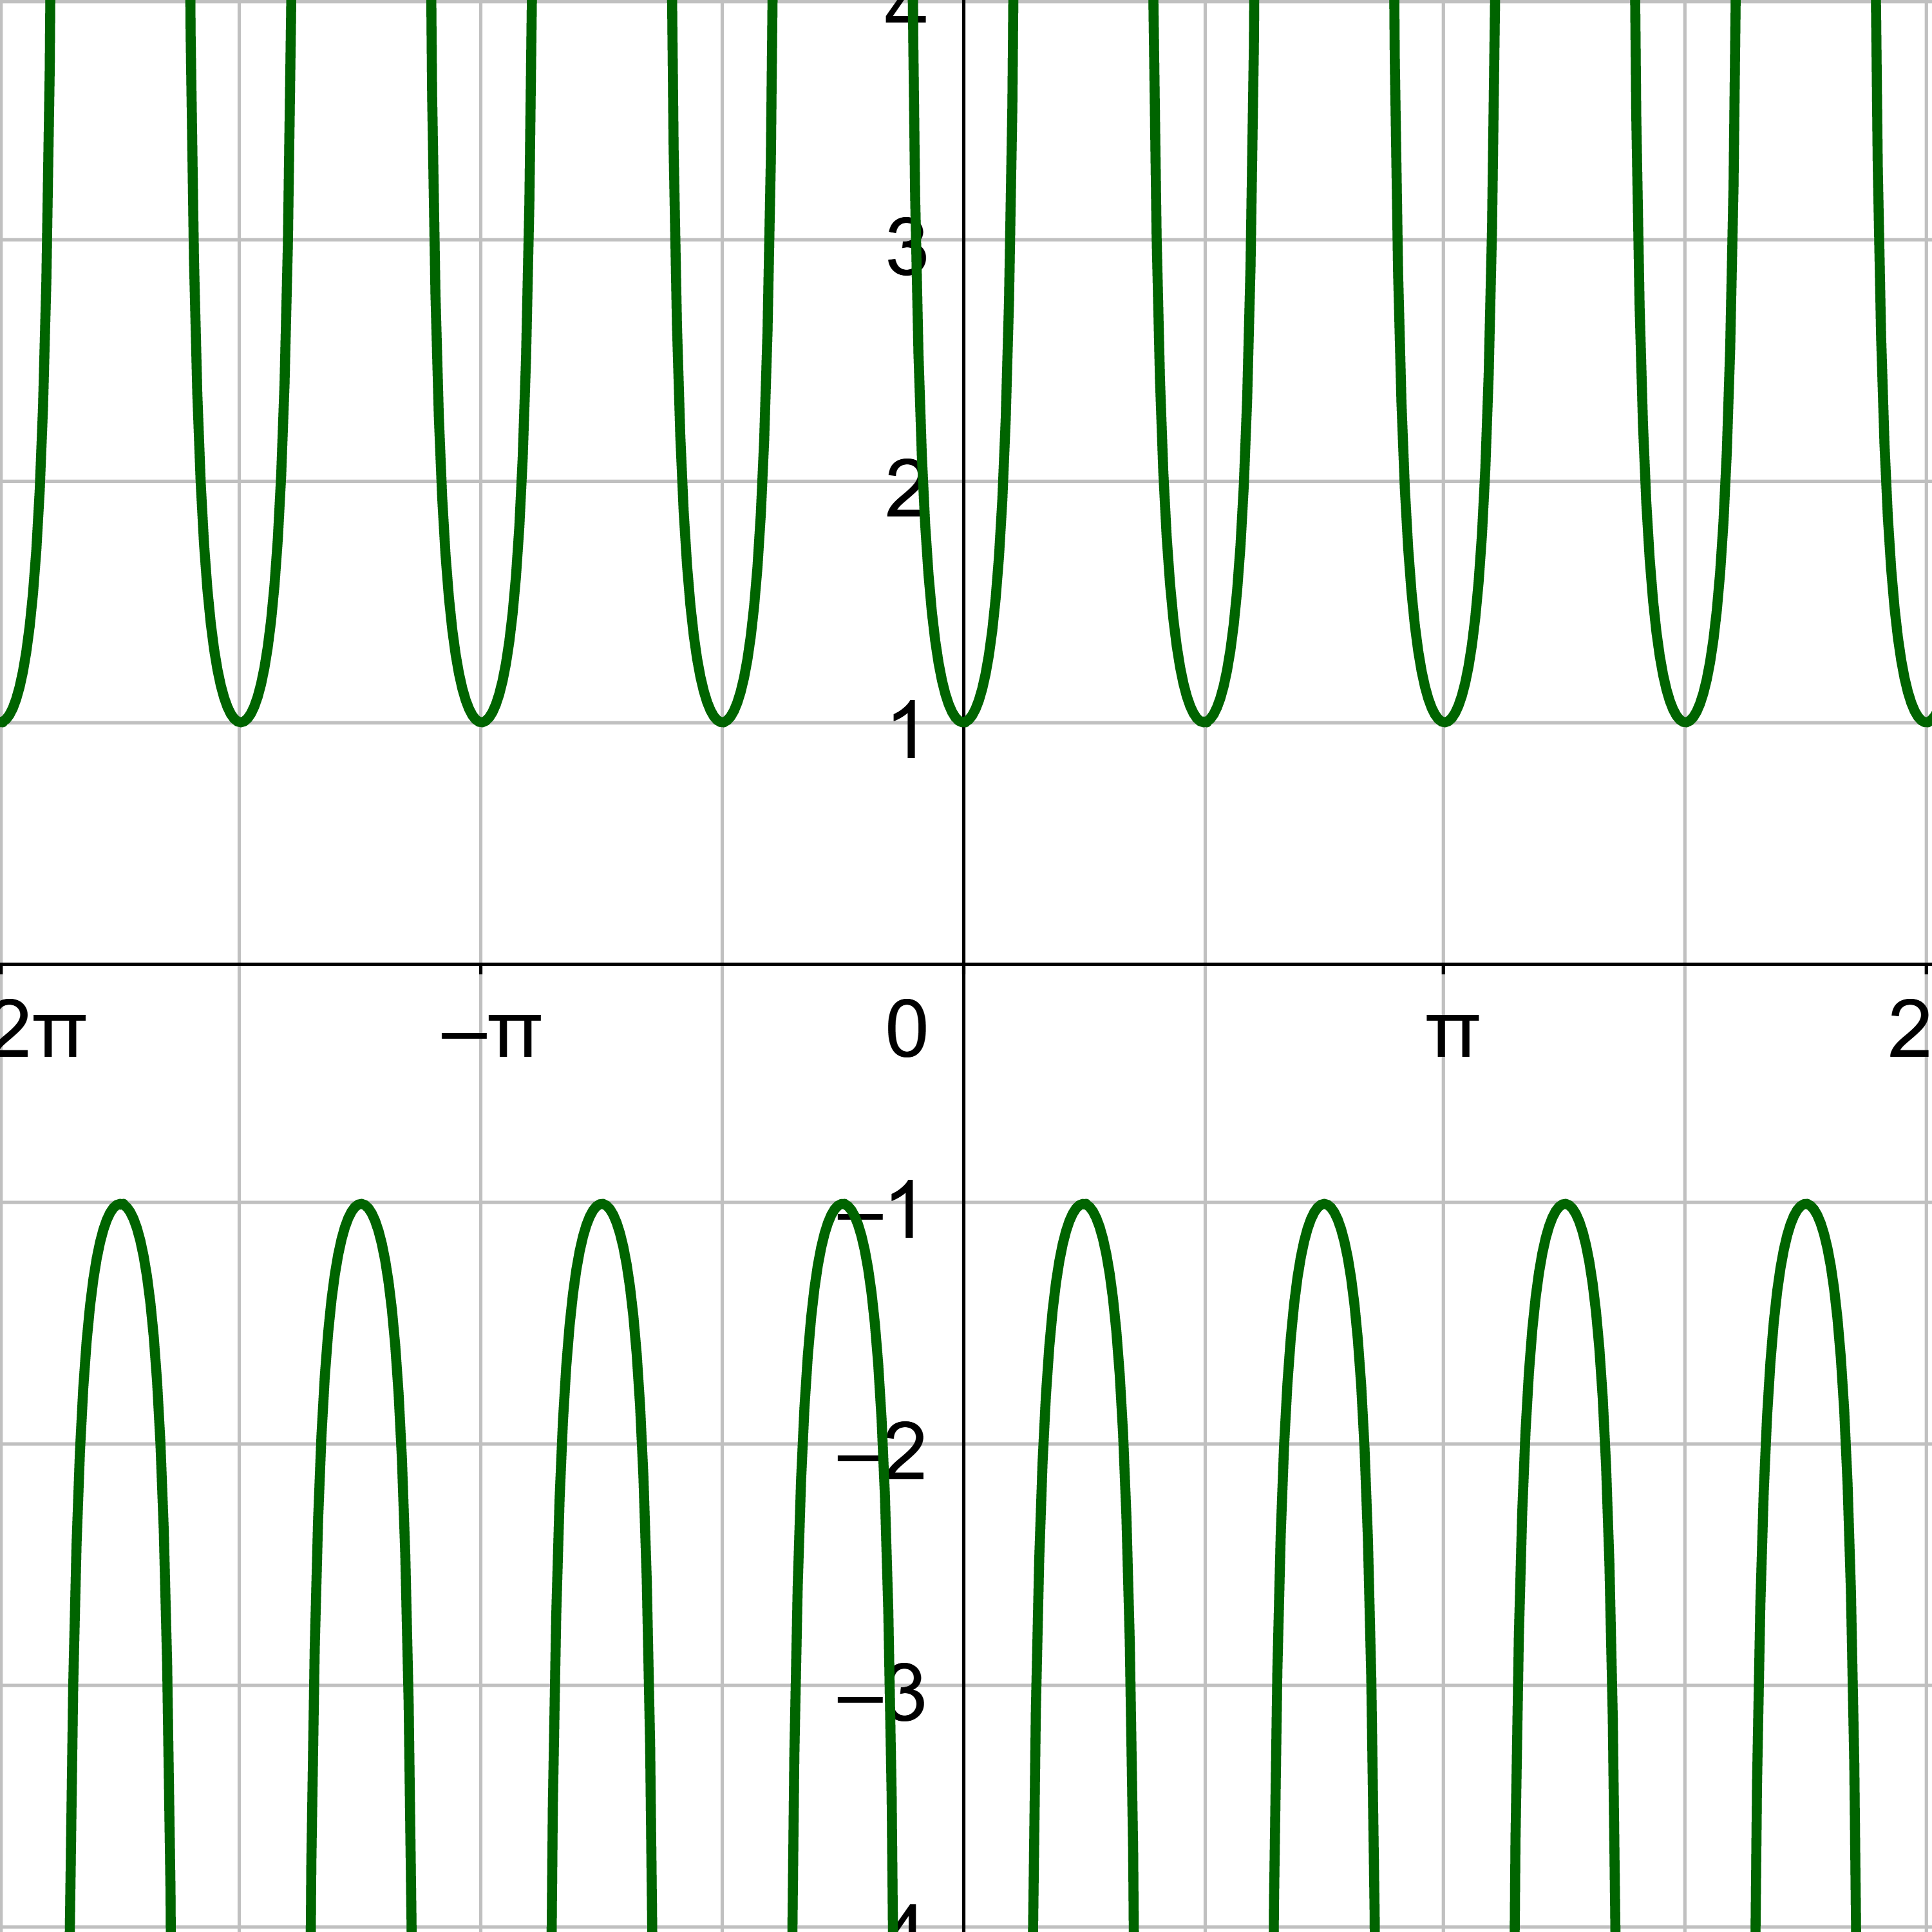
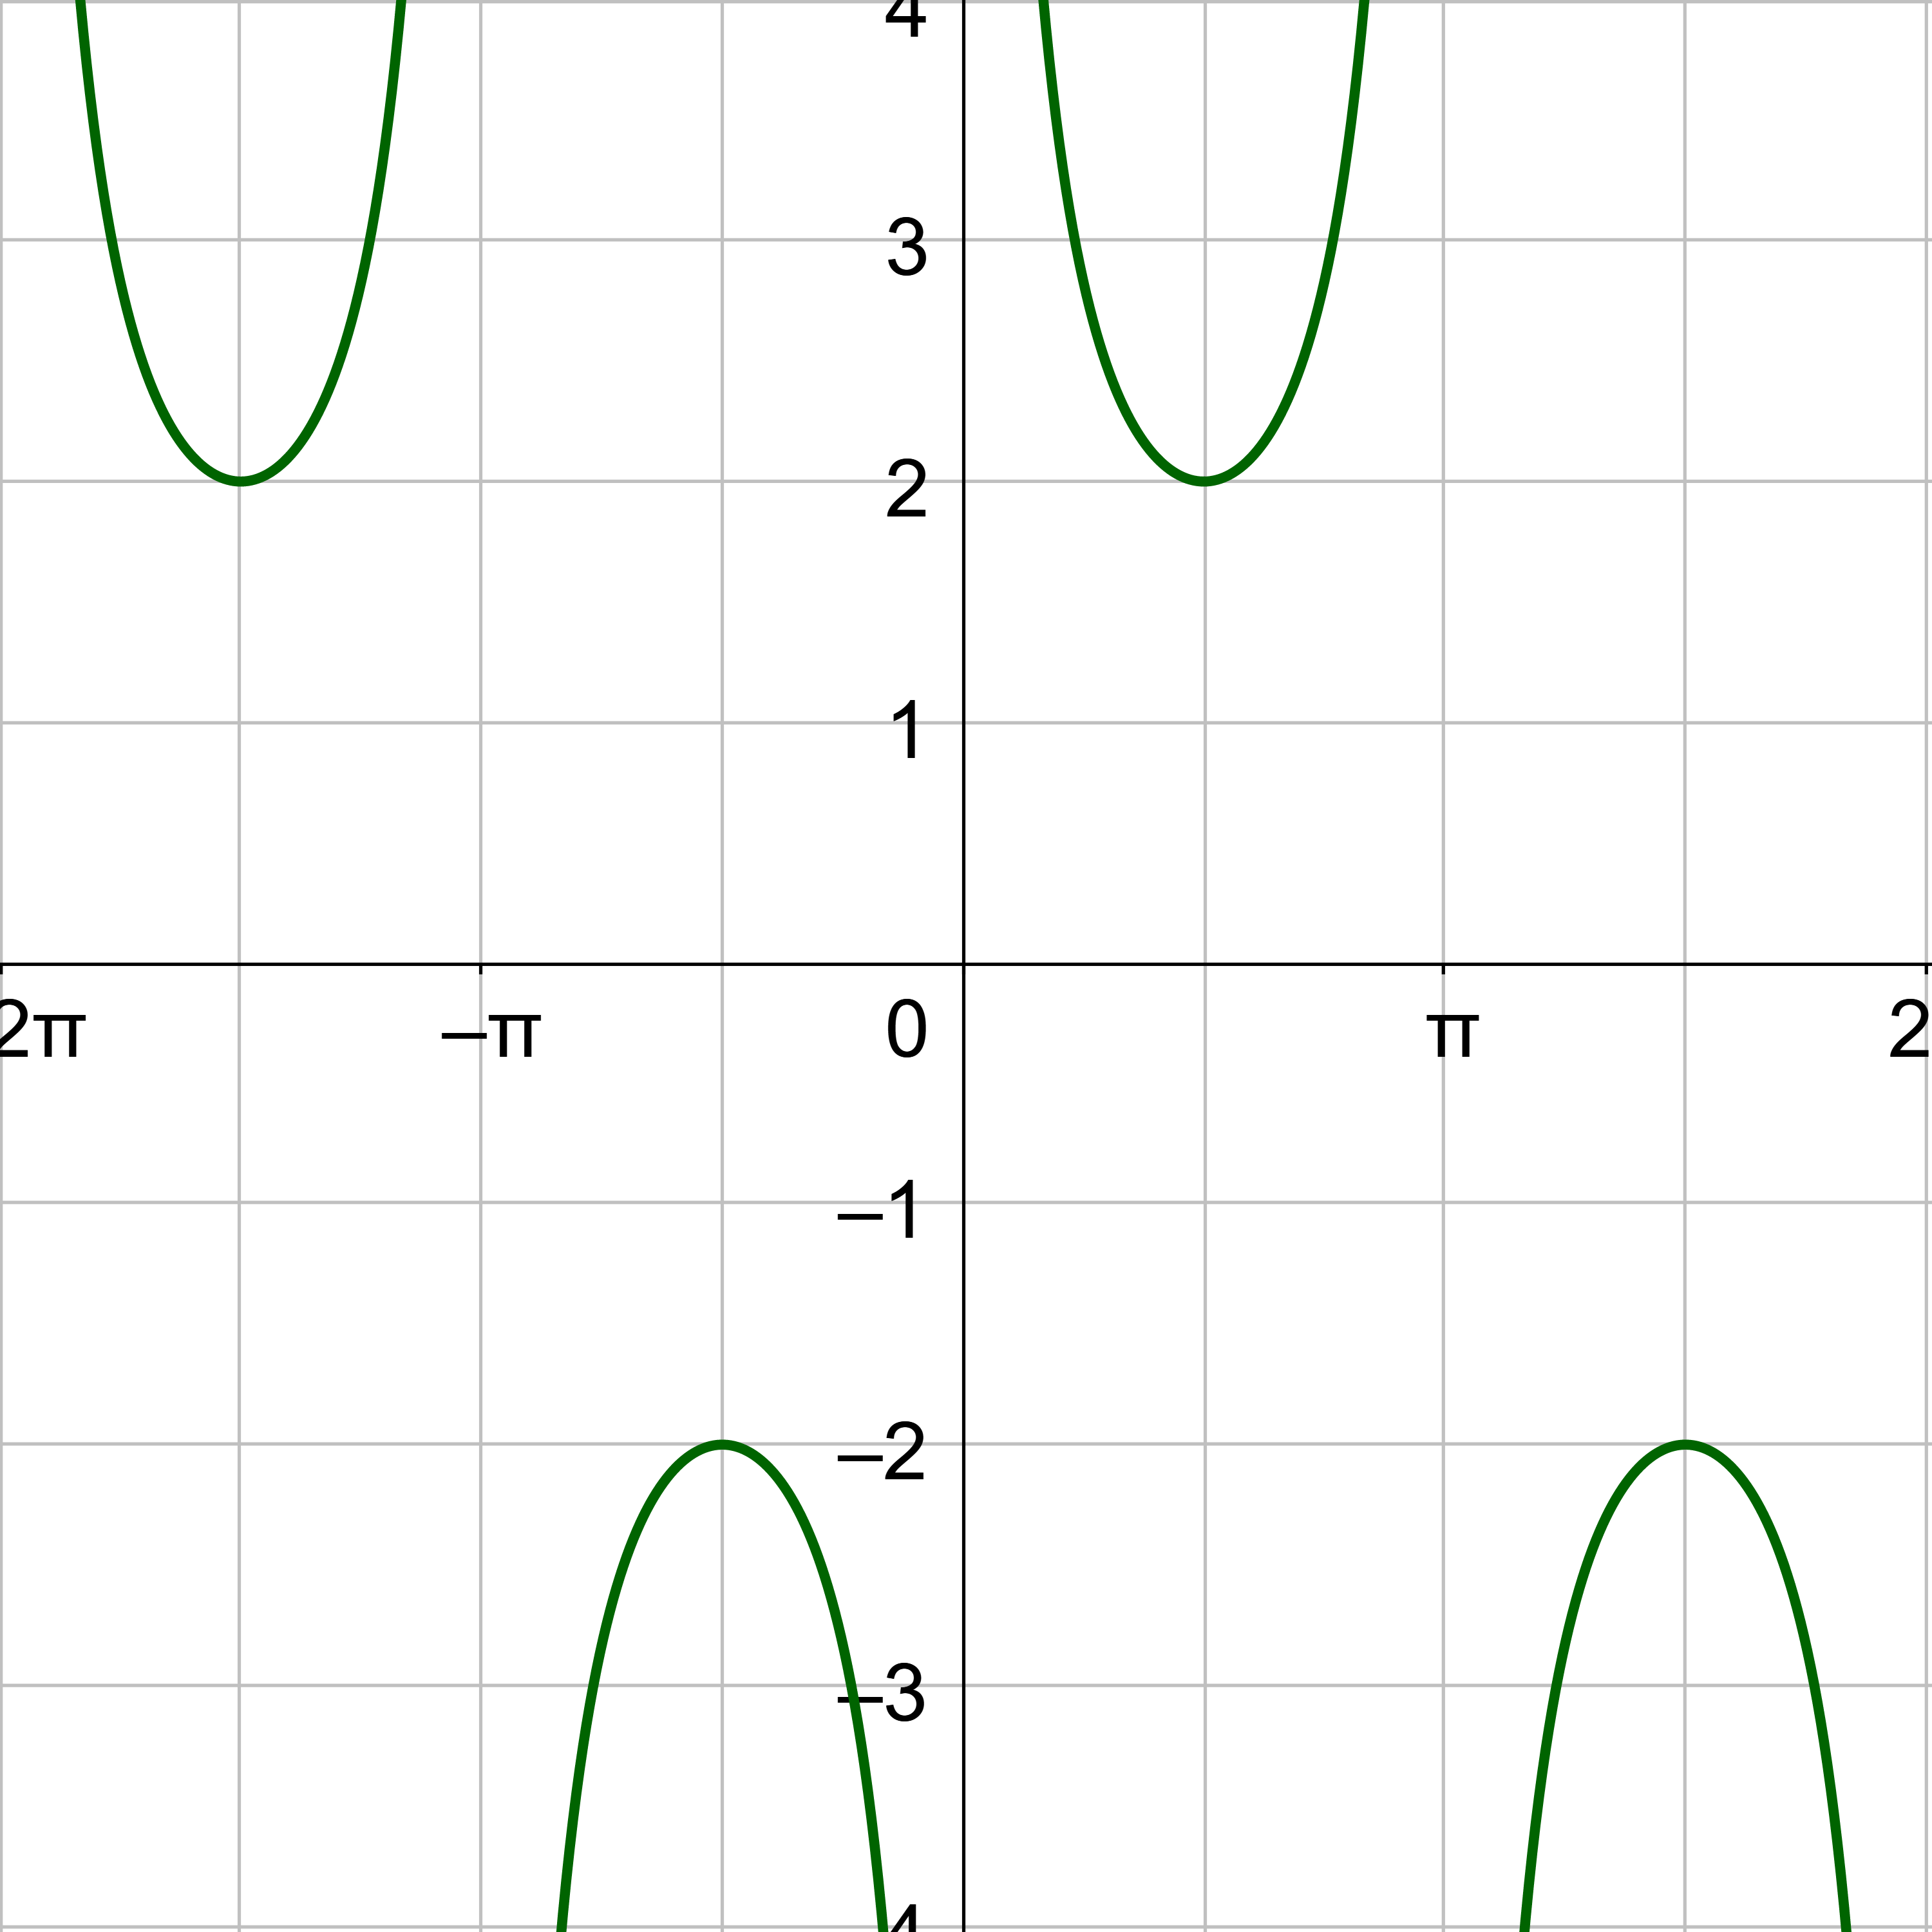
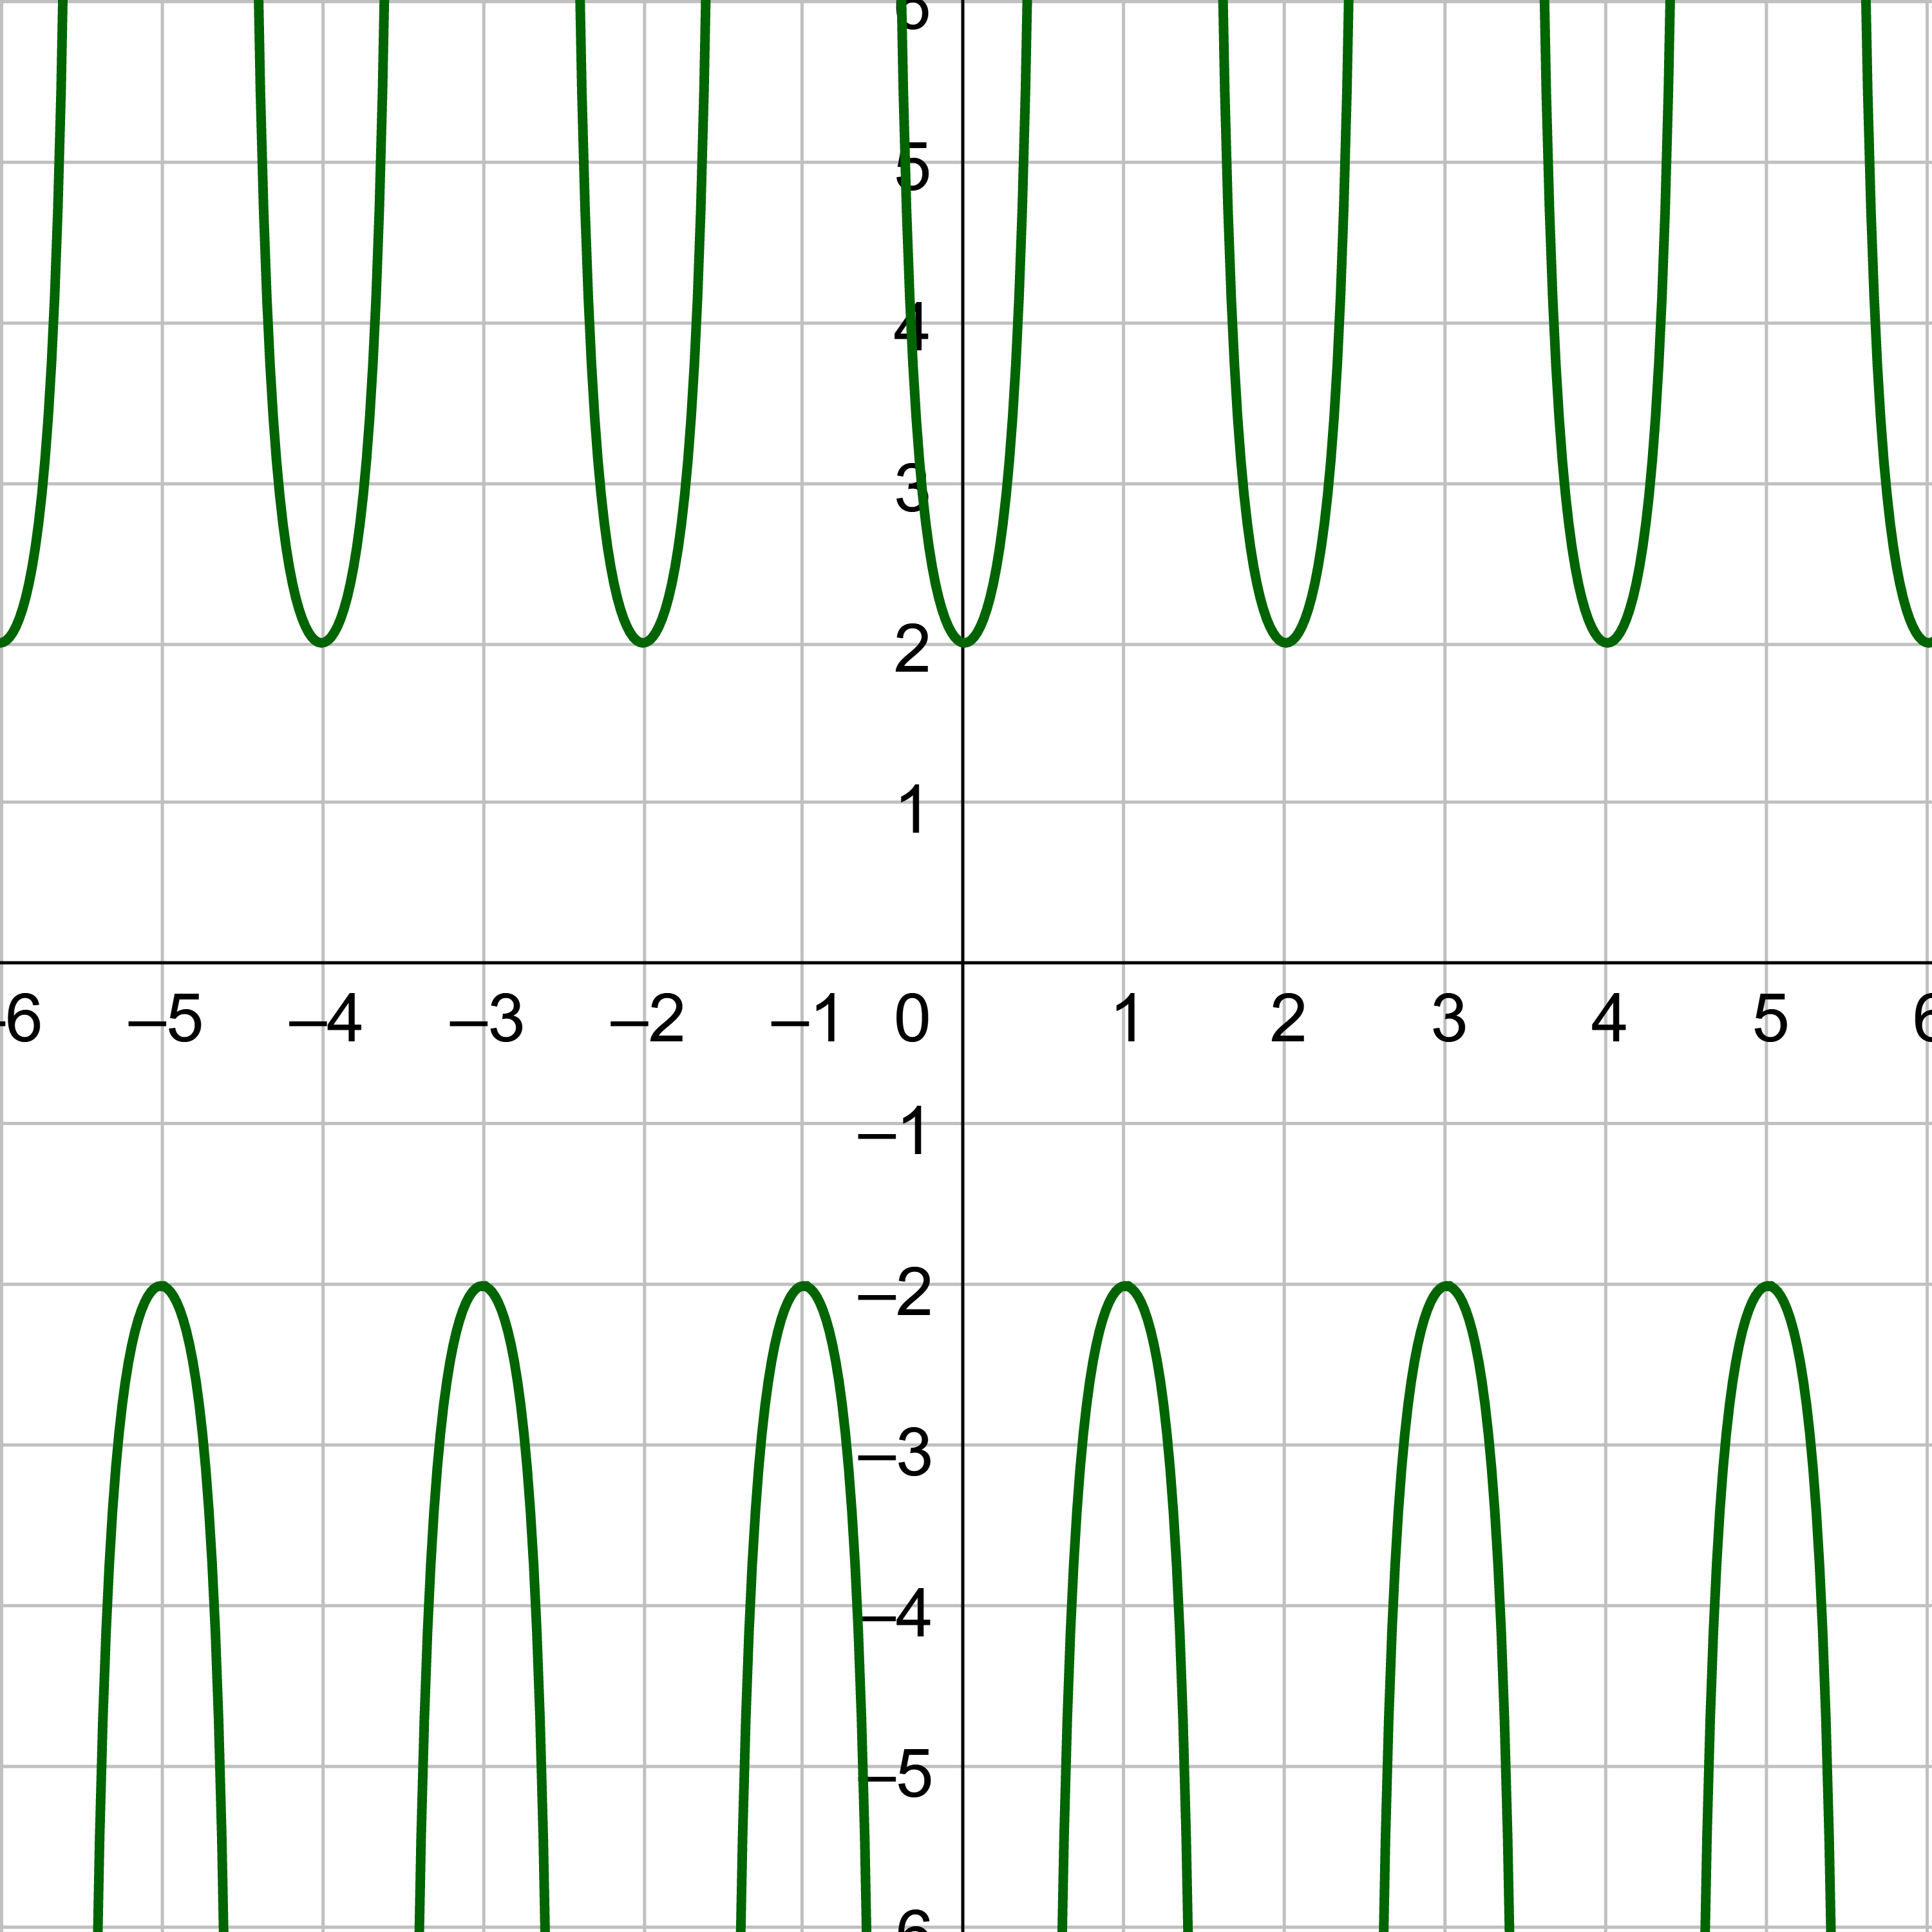
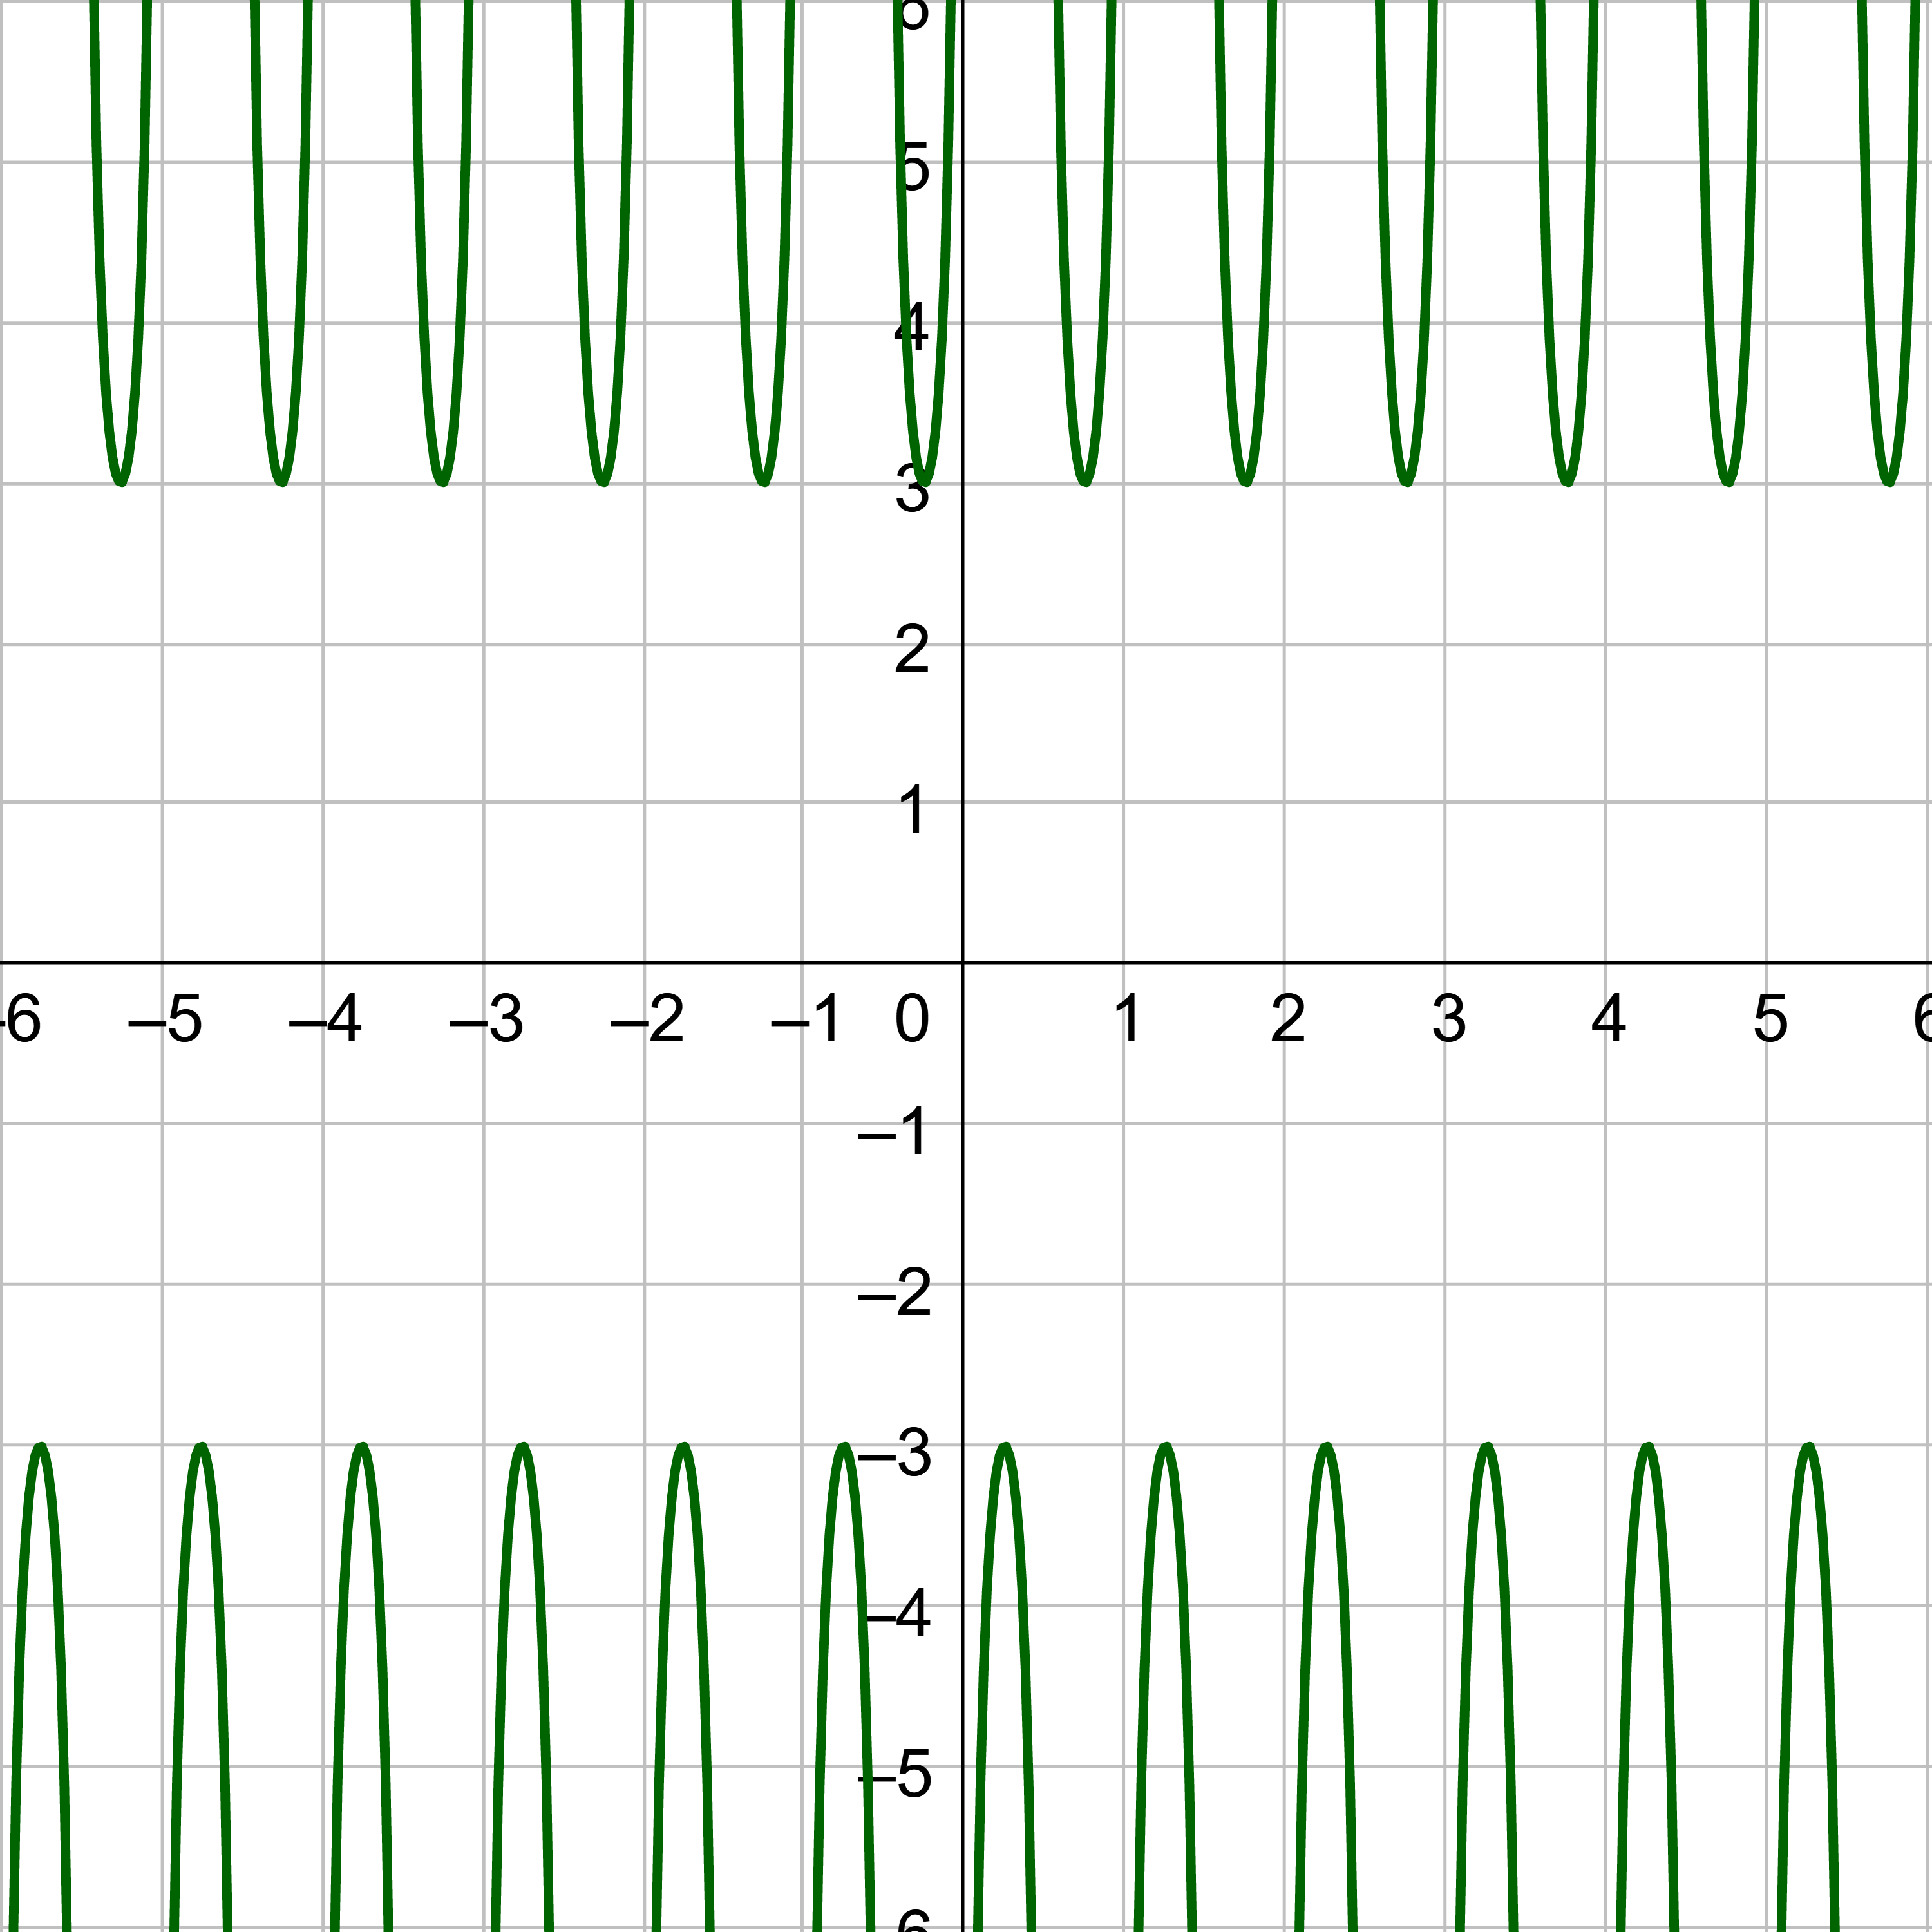
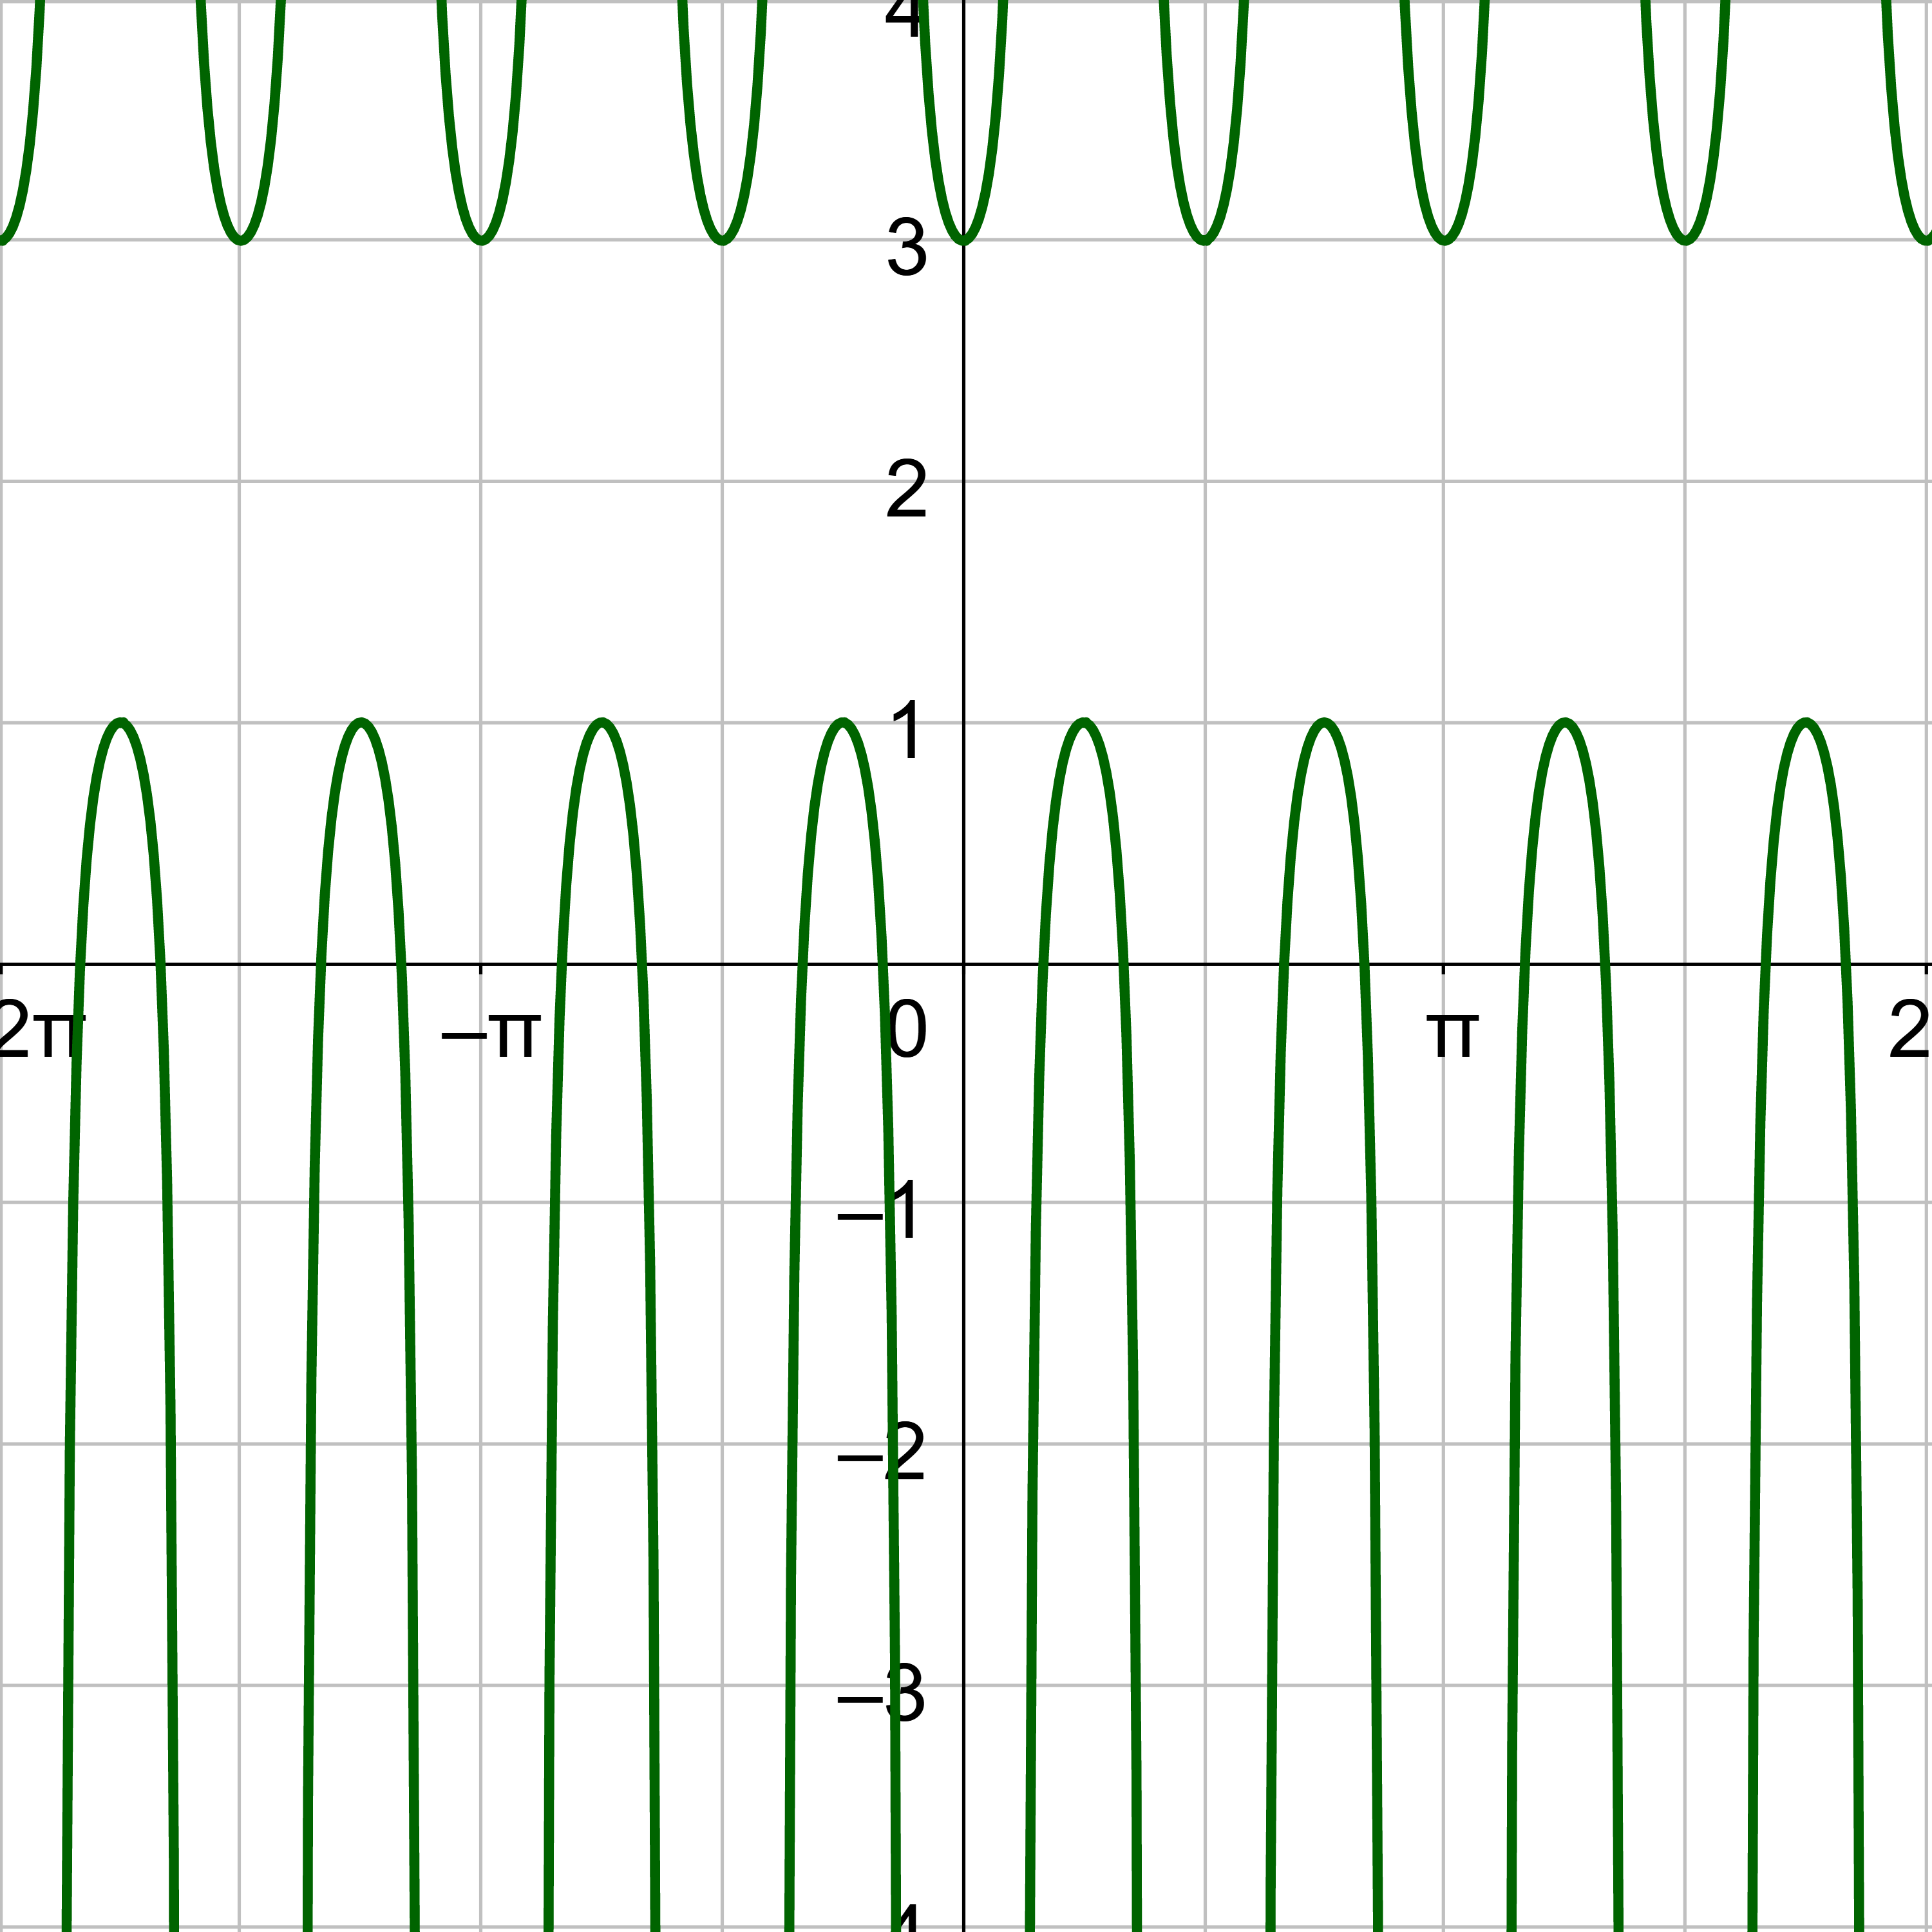
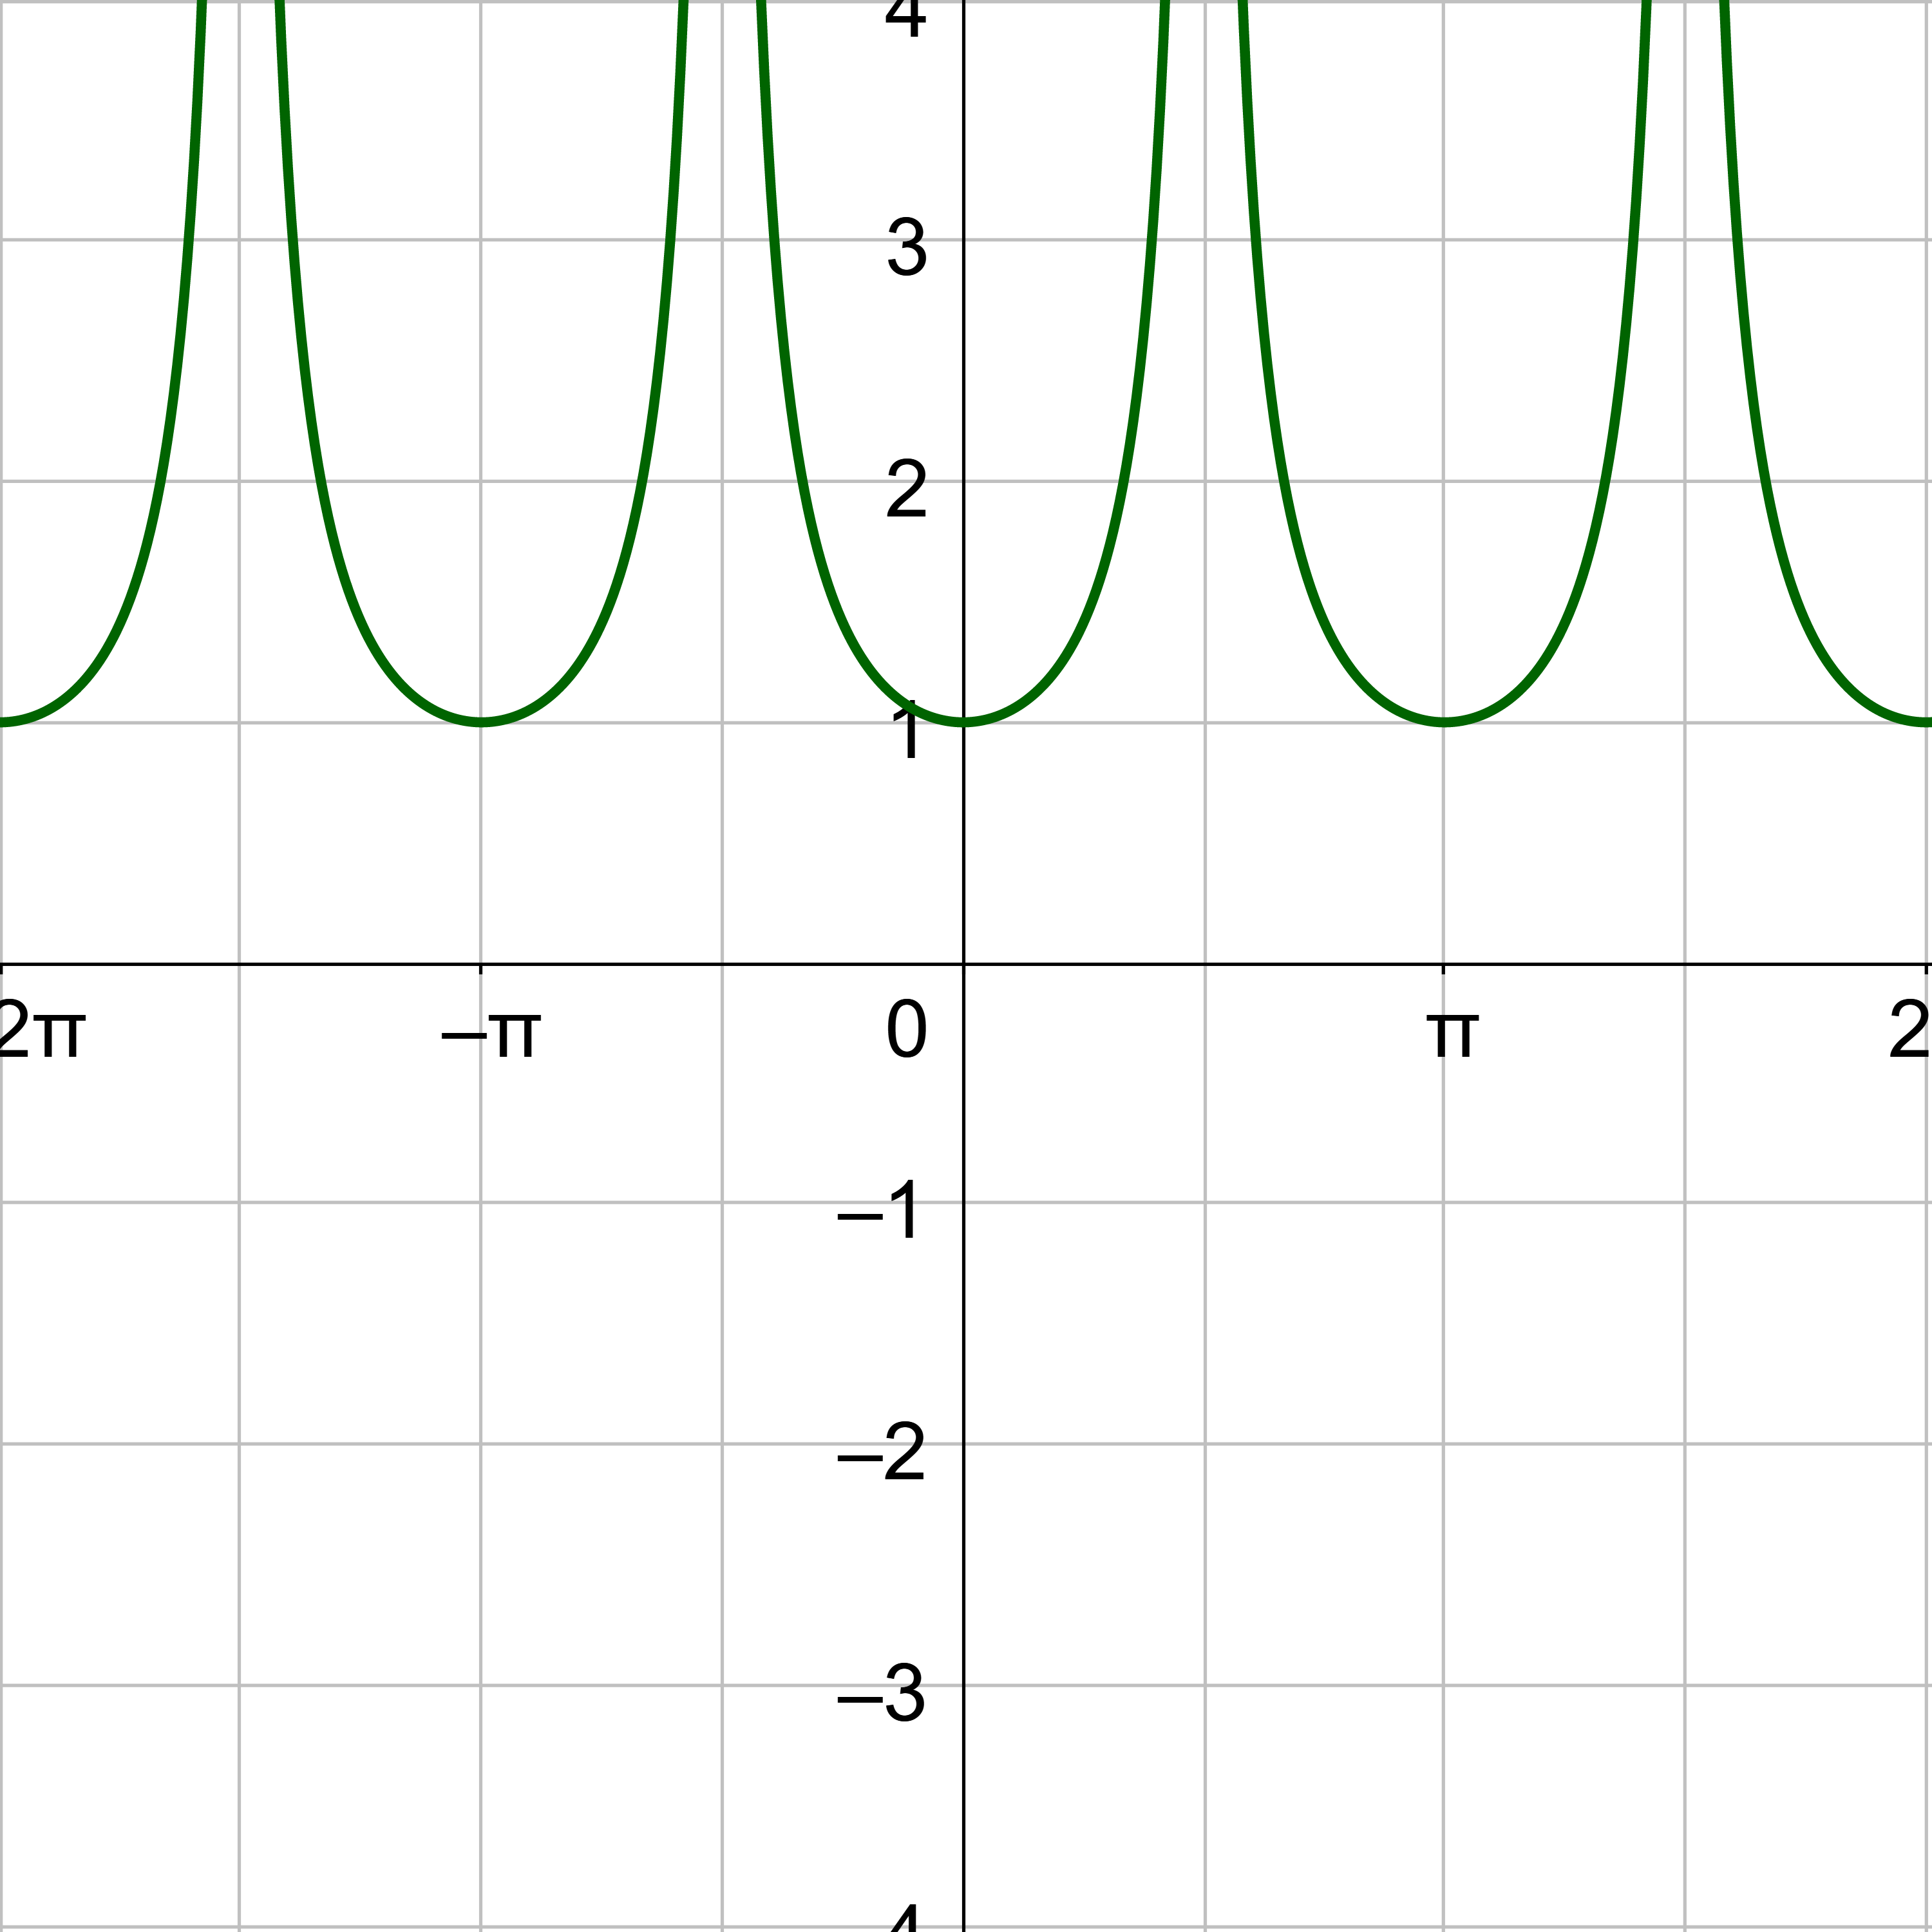
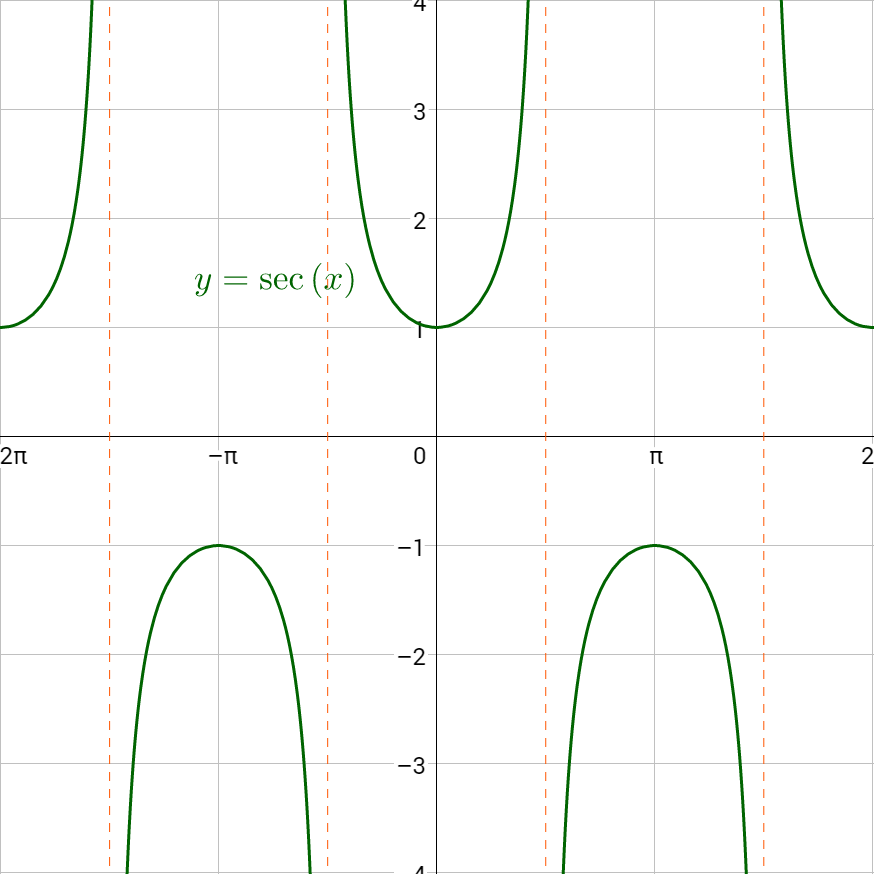
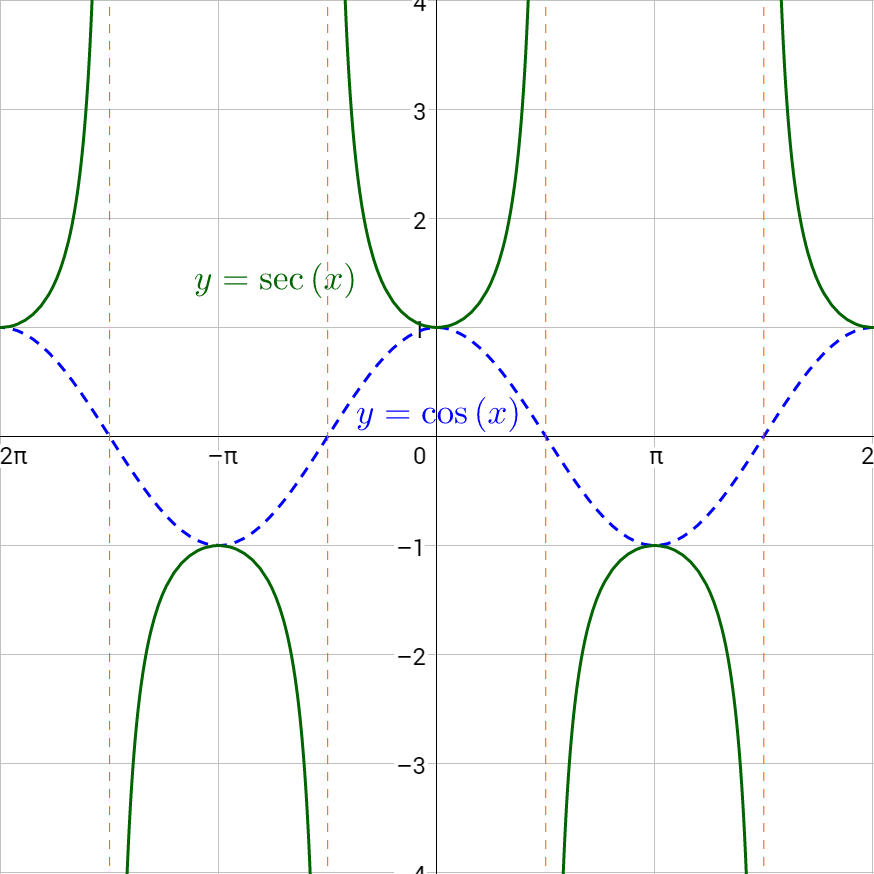
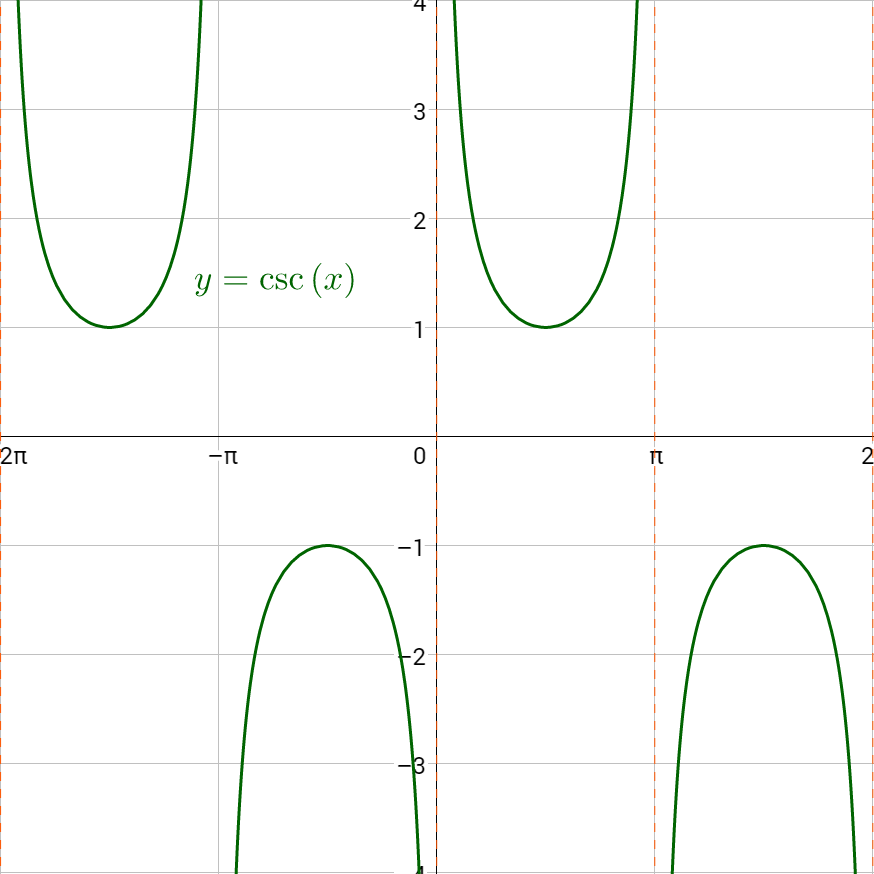
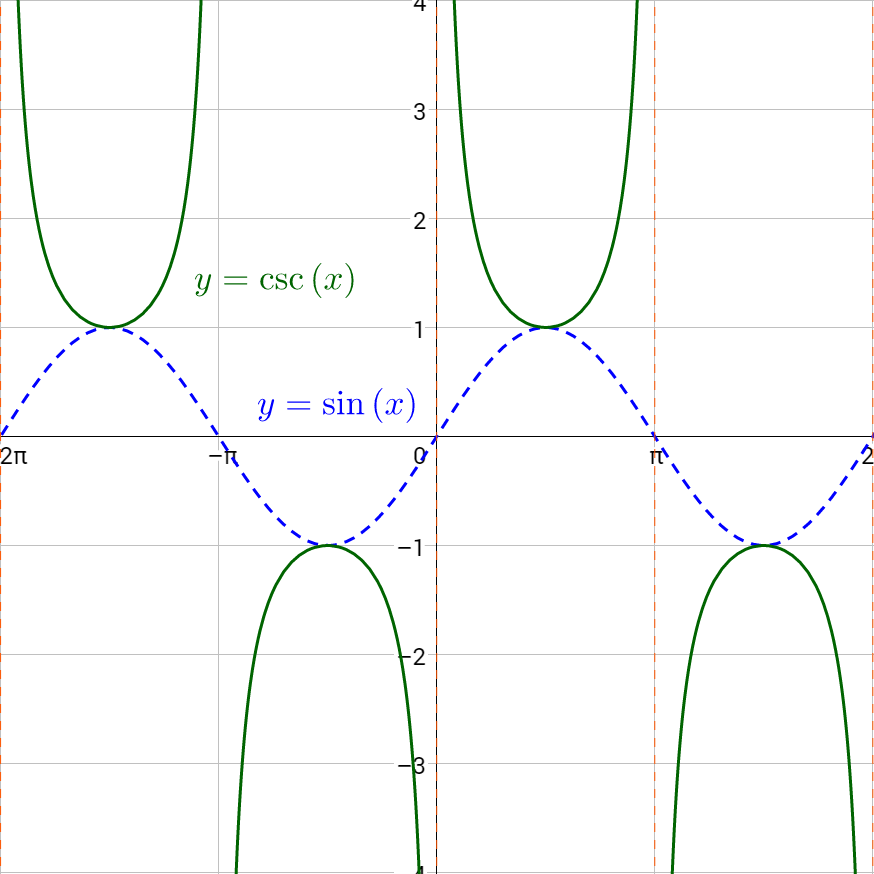
Secant and cosecant are reciprocals of cosine and sine respectively, so their graphs should be related. Secant is graphed in figure 6a, and cosecant is in figure 7a. Notice the graphs are identical except for a phase shift of \(\frac{π}{2}\). Figure 6b graphs both secant and cosine on the same graph. Notice that x-intercepts on the cosine graph correspond to asymptotes on the secant graph. This is because the functions are reciprocals. The reciprocal of 0 is \(\frac{1}{0}\) which is undefined. Also notice, that when cosine is 1, secant is also 1. Again, this is because of the reciprocal relationship; the reciprocal of 1 is 1. The same pattern exists between cosecant and sine as in figure 7b.
The period of both secant and cosecant is 2π like sine and cosine. There is no amplitude for secant and cosecant, but there is a vertical stretch that is used instead.
Sketch a graph of .
Solution
Compare to y = a sec(bx – c) + d.
a = 1
b = π
c = \(-\frac{π}{2}\)
d = 0
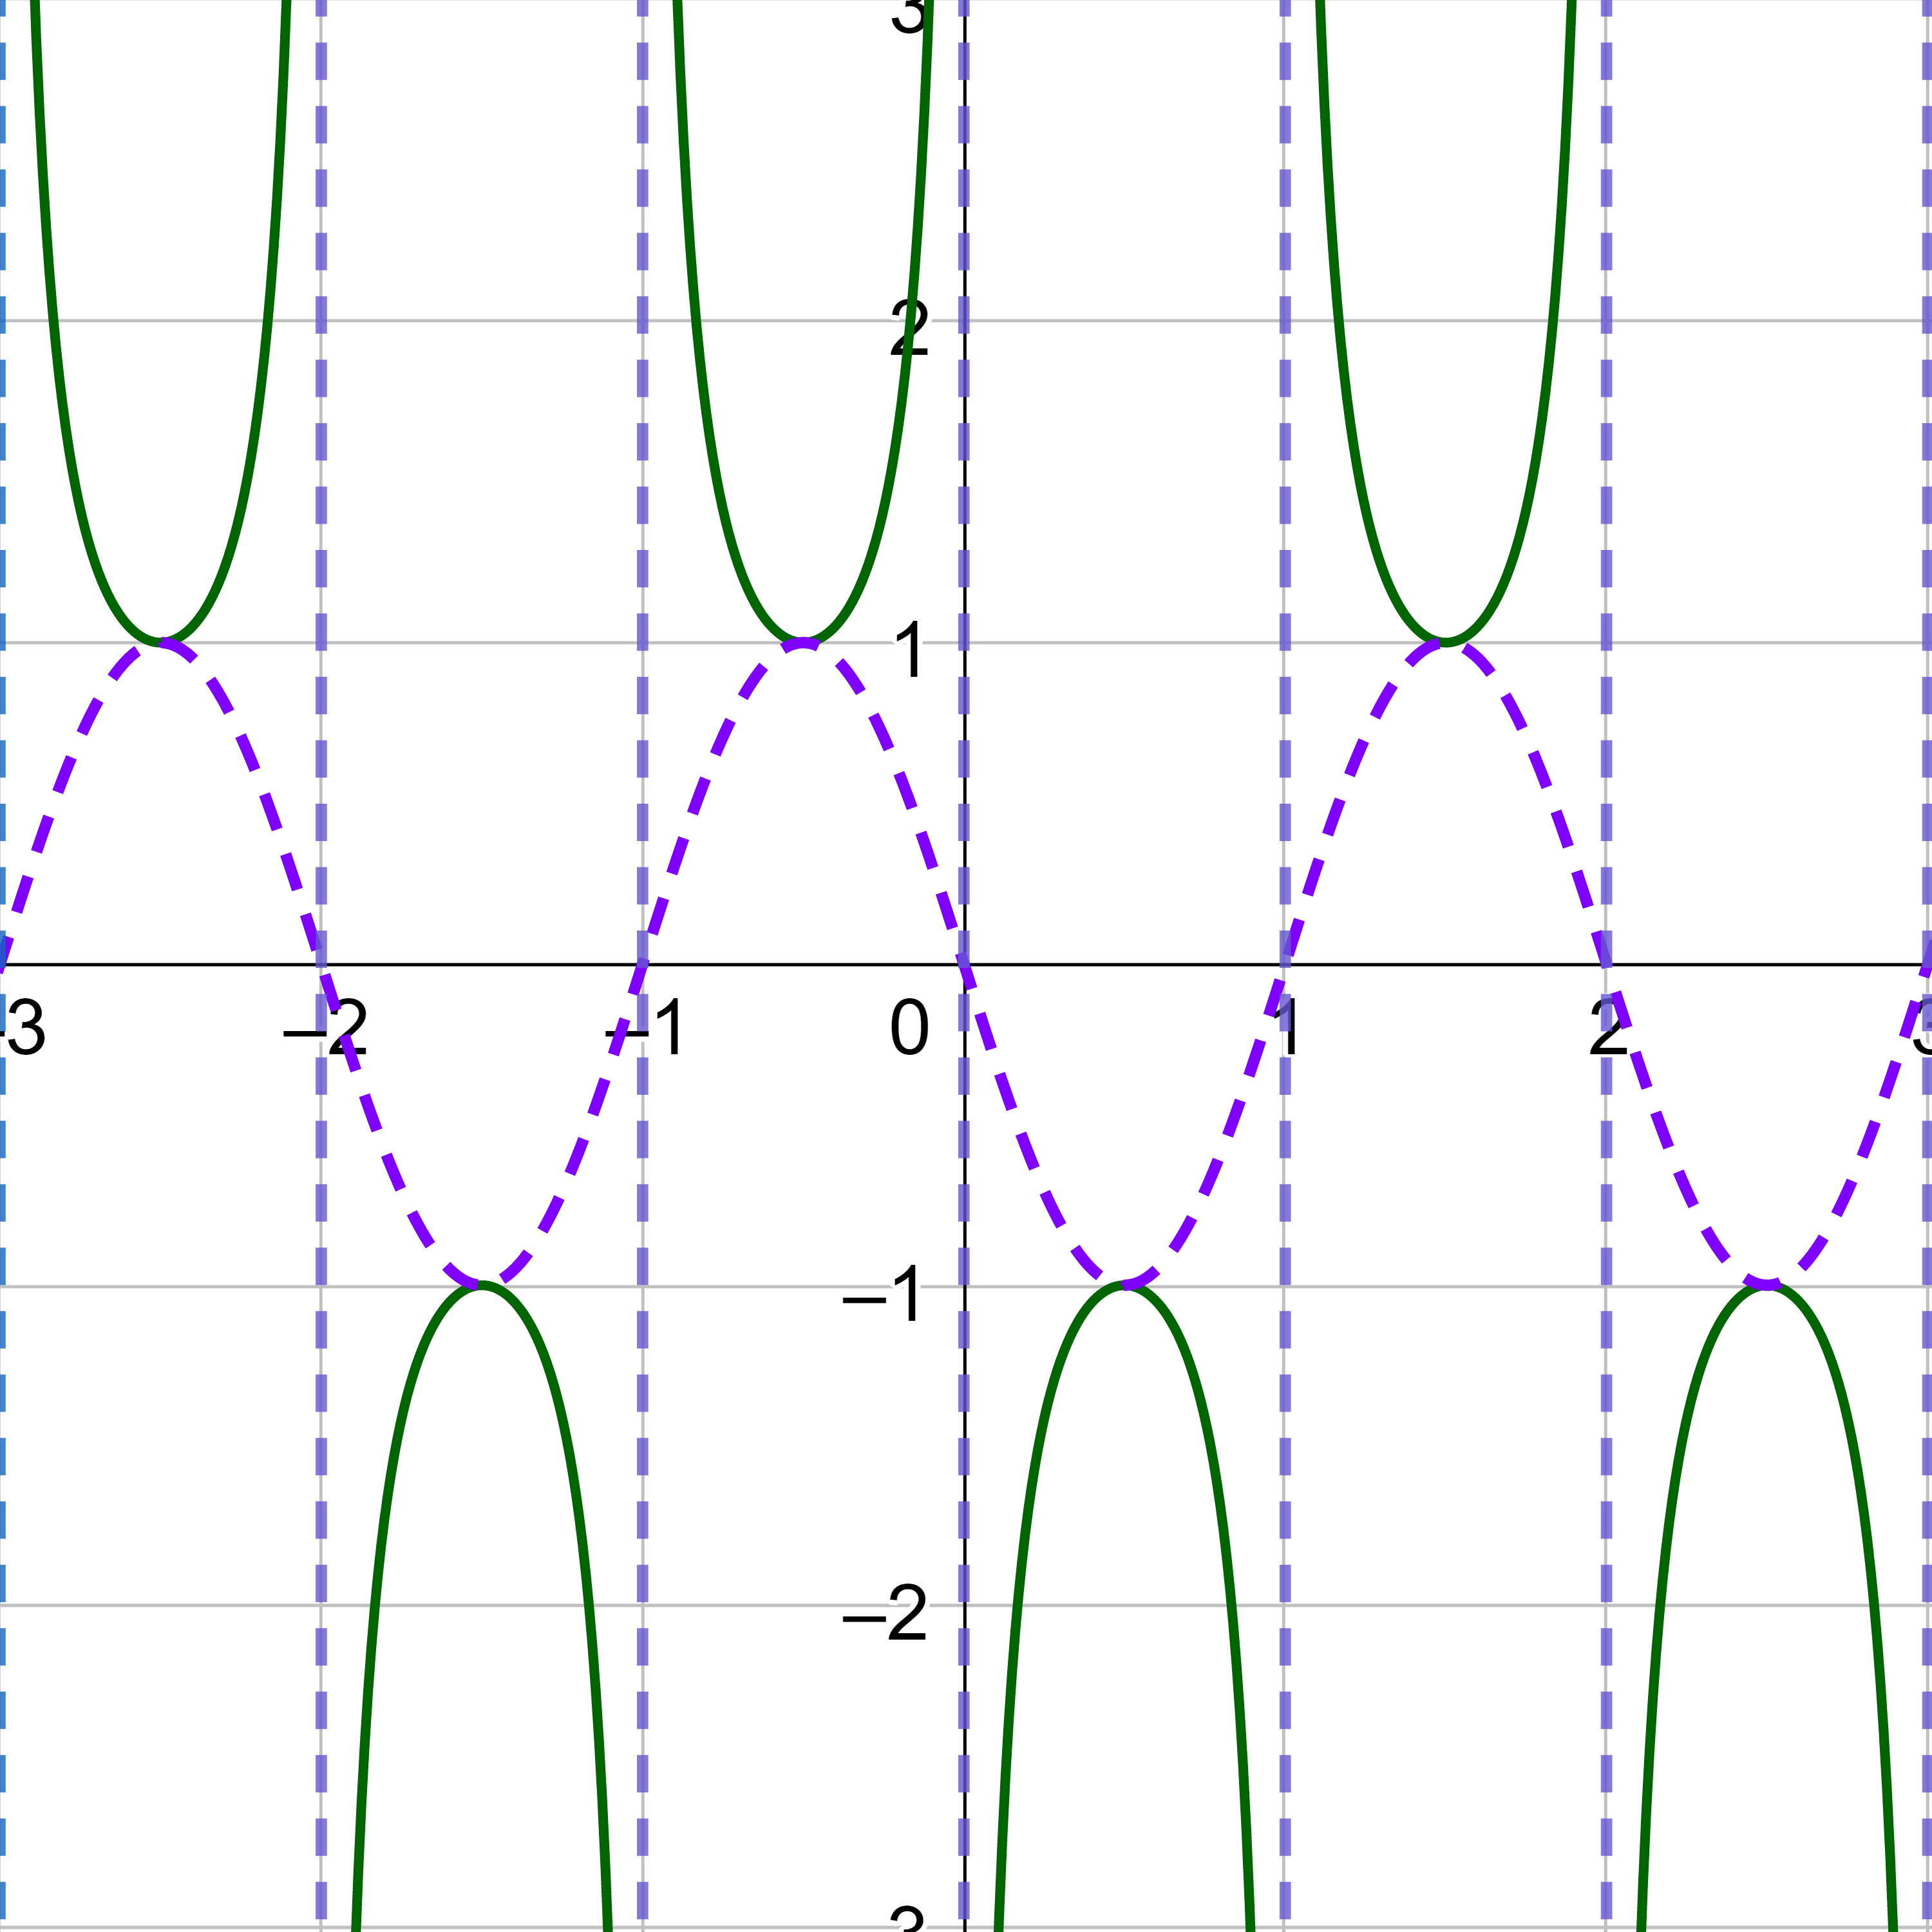
Since the desired function is secant, start by sketching the reciprocal function, cosine. Then, sketch the basic secant graph, the asymptotes are where the cosine graph crosses the x-axis.
The midline is y = d, so y = 0 which is the x-axis.
The amplitude is 1, so label the y-axis so the maximum of the curve is 1 above the midline, 1, and the minimum is 1 below the midline, −1.
The period is
$$ T = \frac{2π}{b} $$
$$ T = \frac{2π}{π} $$
$$ T = 2 $$
The phase shift is
$$ PS = \frac{c}{b} $$
$$ PS = \frac{-\frac{π}{2}}{π} $$
$$ PS = -\frac{1}{2} $$
The first key point for cosine is at (0, a), but it has shifted left \(\frac{1}{2}\), so it is \(\left(-\frac{1}{2}, 1\right)\). The fifth key point is one period to the right or at \(\left(-\frac{1}{2} + 2, 1) = (\frac{3}{2}, 1). These are the maximums. The minimum is the middle key point and is halfway between the 1st and 5th key points but an amplitude below the midline, \(\left(\frac{1}{2}, -1\right)\). One zero is halfway between the 1st and 3rd key points on the midline, (0, 0). The other zero is halfway between the 3rd and 5th key points on the midline, (1, 0).
Sketch the sine curve through the key points and continue the shape so it repeats at either end.
Draw the vertical asymptotes everywhere the cosine graph crosses the midline, x-axis. Then draw the secant shaped graph so that it touches the minimums and maximums of the cosine graph.
Sketch a graph of .
Solution
Compare to y = a sec(bx – c) + d.
a = ½
b = 1
c = 0
d = –1
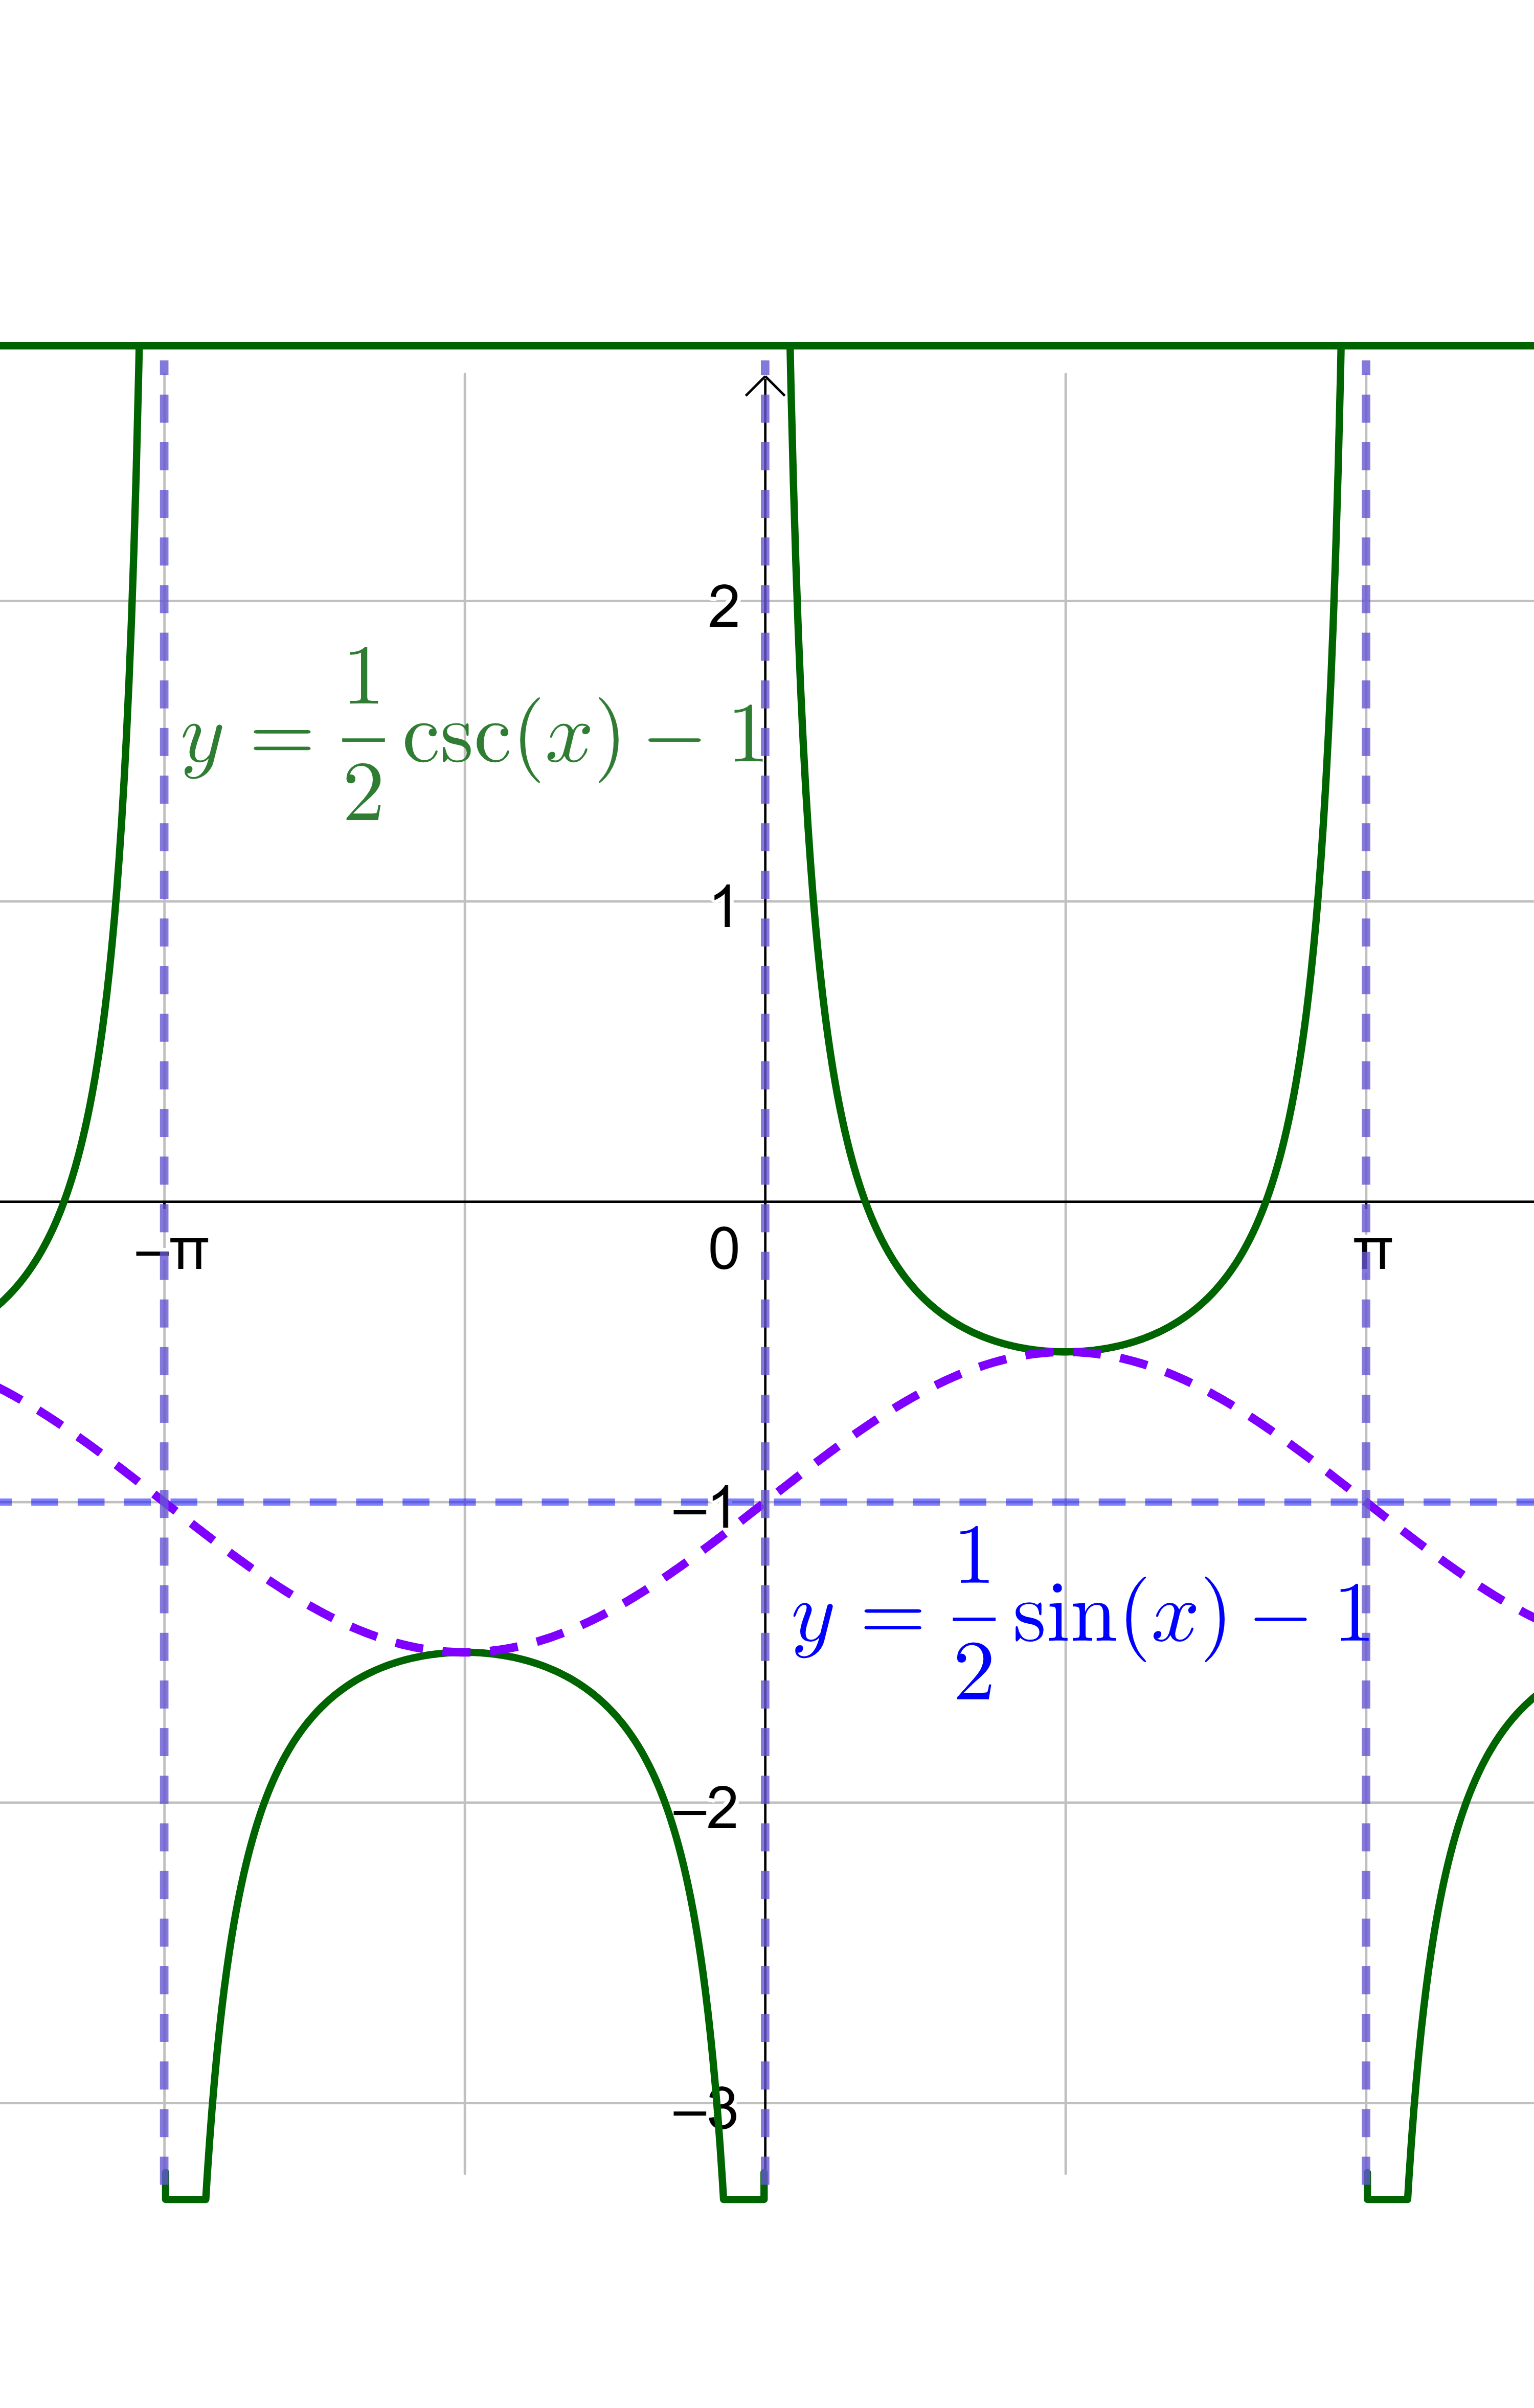
Since, the desired function is cosecant, start by sketching the reciprocal function, sine. Then, sketch the basic cosecant graph, the asymptotes are where the sine graph crosses the x-axis.
The midline is y = d, so y = −1. Draw this line on the graph as a light dotted line.
The amplitude is ½, so label the y-axis so the maximum of the curve is ½ above the midline, −½, and the minimum is ½ below the midline, −3/2.
The period is
$$ T = \frac{2π}{b} $$
$$ T = \frac{2π}{1} $$
$$ T = 2π $$
The phase shift is
$$ PS = \frac{c}{b} $$
$$ PS = \frac{0}{1} $$
$$ PS = 0 $$
The first key point for sine is at (0, 0), but it has shifted down 1, so it is (0, −1). The fifth key point is one period to the right or at (2π, −1). The middle key point is halfway between the 1st and 5th key points, (π, −1). The maximum is halfway between the 1st and 3rd key points and the amplitude higher, \(\left(\frac{π}{2}, -\frac{1}{2}\right)\). The minimum is halfway between the 3rd and 5th key points and the amplitude lower, \(\left(\frac{3π}{2}, -\frac{3}{2}\right)\).
Sketch the sine curve through the key points and continue the shape so it repeats at either end.
Draw the vertical asymptotes everywhere the cosine graph crosses the midline, x-axis. Then draw the secant shaped graph so that it touches the minimums and maximums of the cosine graph.
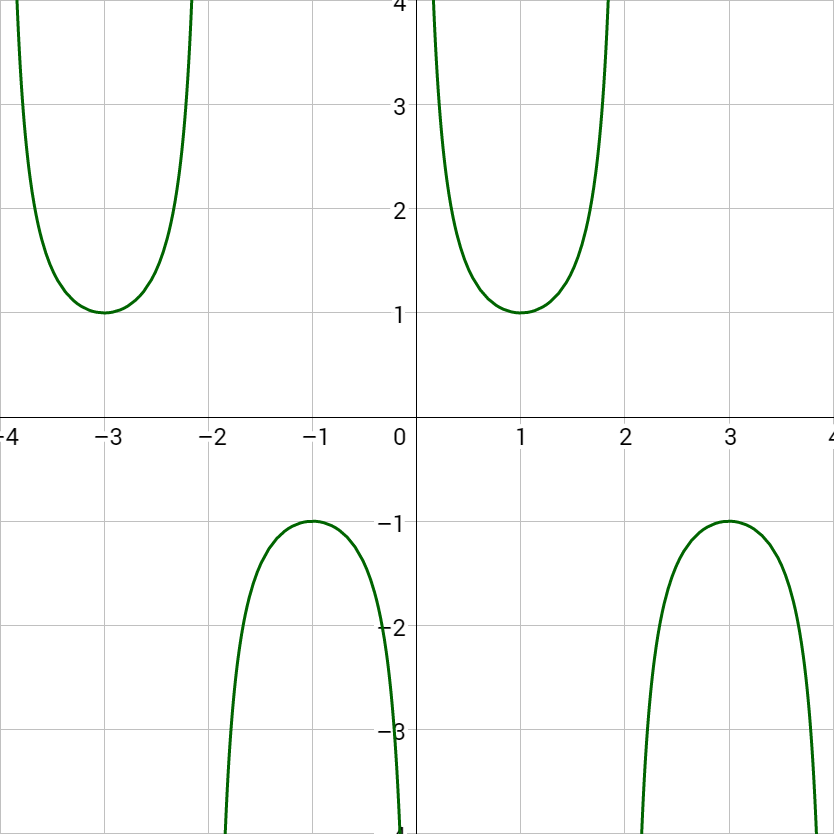
Sketch a graph of .
Answer
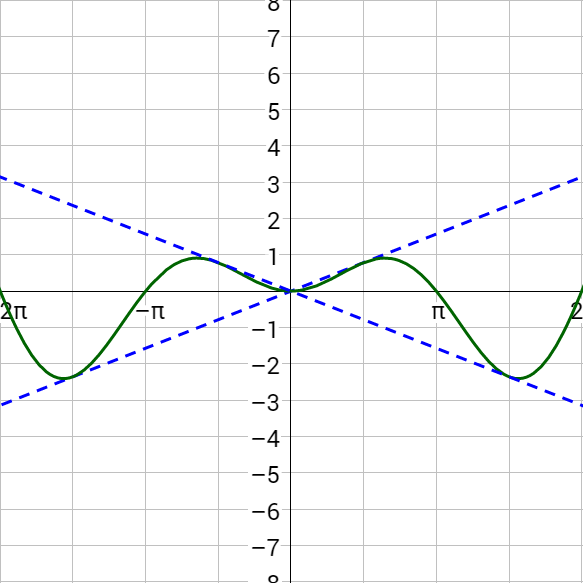
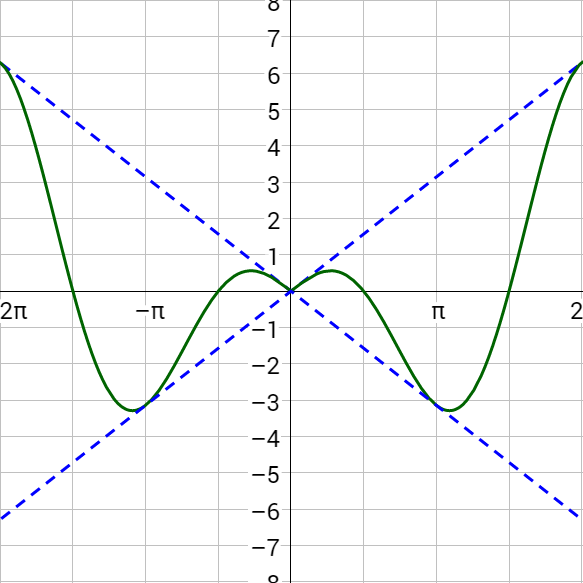
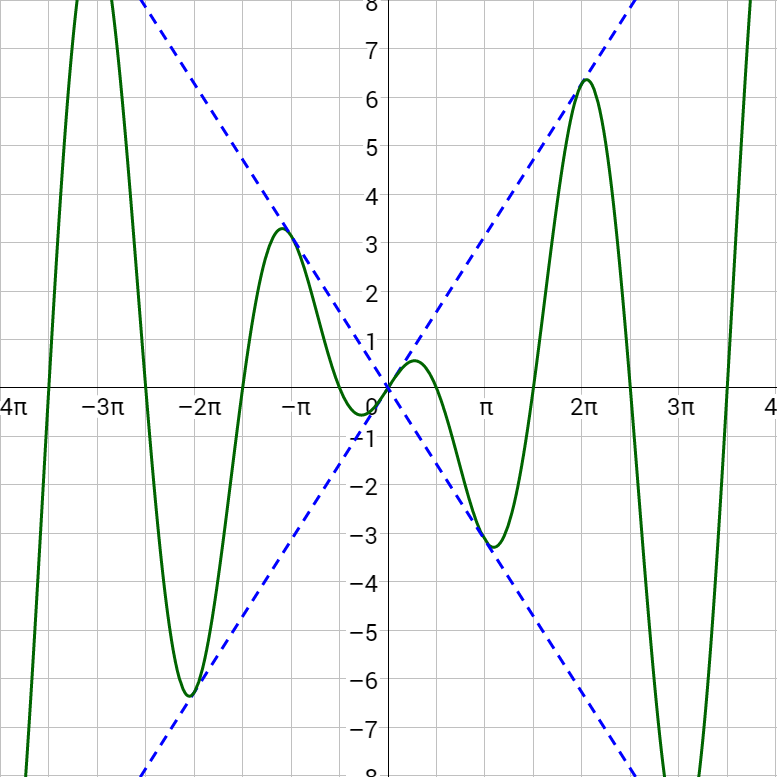
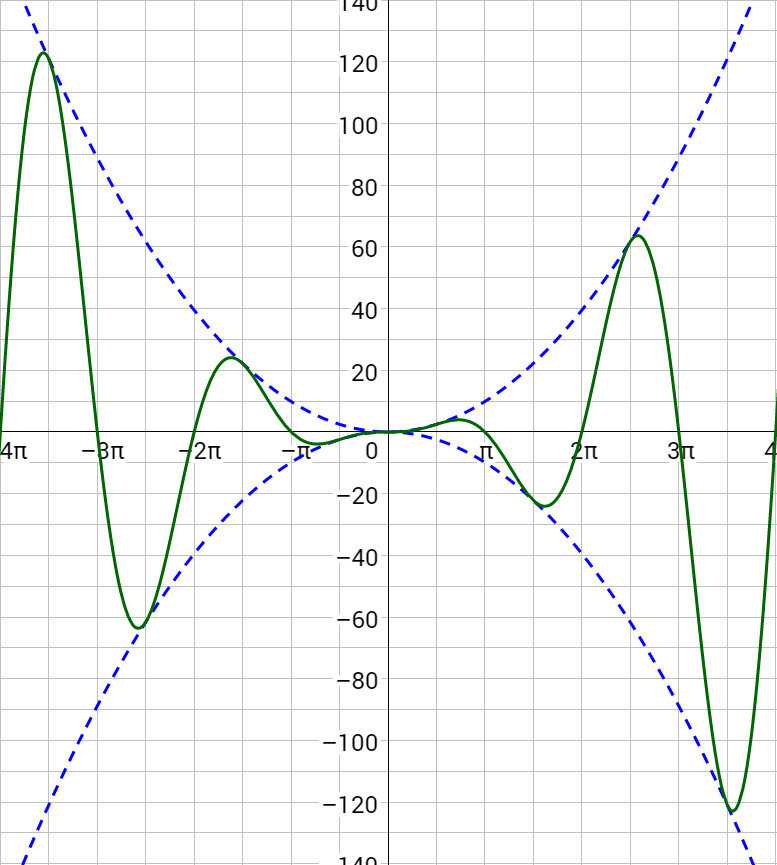
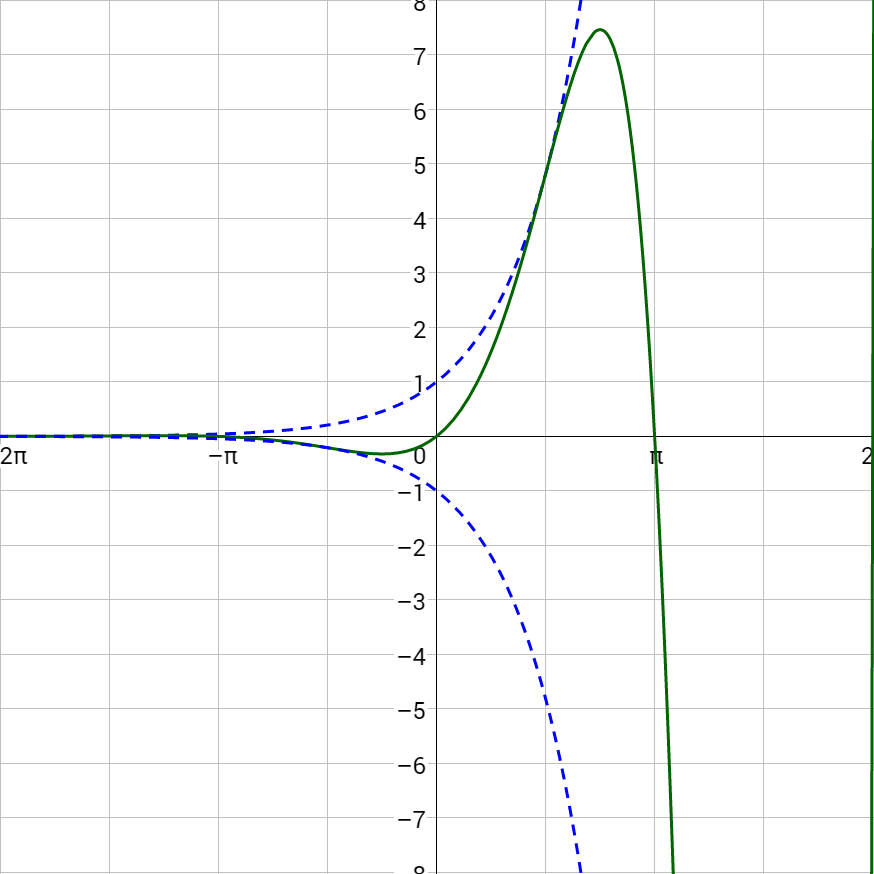
Trigonometric functions can be modified, or damped, by multiplying it by another function. The graph of sine or cosine is then constrained between the damping function and its x-axis reflection.
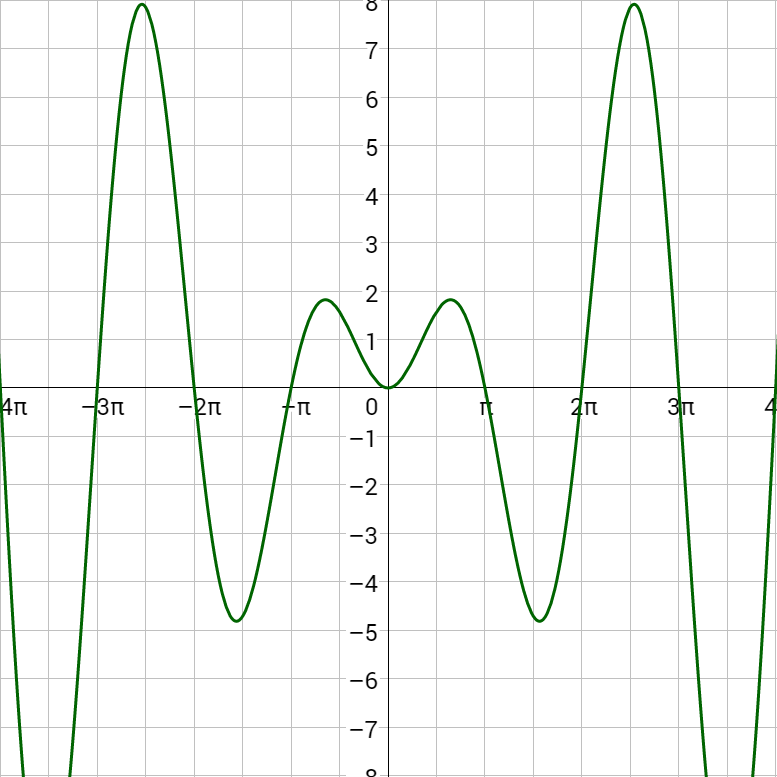
Sketch a graph of y = x cos x.
Solution
The damping function is y = x and the trigonometric function is y = cos x. Start by graphing y = x. Then reflect the graph over the x-axis. Then graph y = cos x, but the minimums and maximums are at the y = x and y = –x lines.
Sketch a graph of y = x2 sin x.
Solution
The damping function is y = x2. Start by graphing y = x2 and its reflection over the x-axis, y = –x2. Then graph y = sin x, but the minimums and maximums are at the y = x2 and y = –x2 curves.
Sketch a graph of y = ex sin x.
Answer
Helpful videos about this lesson.
